练习背景
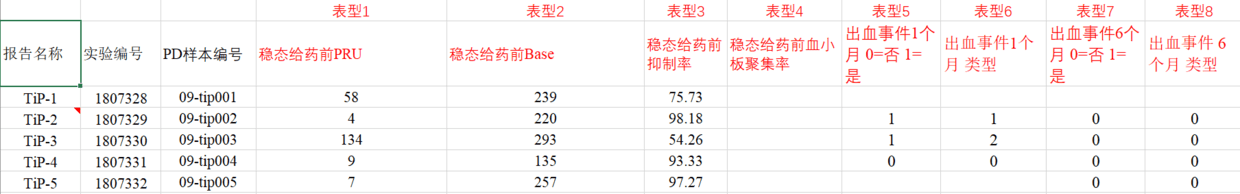
我有一批患者WGS测序数据(100例患者),包括SNP和INDEL。患者是服用了一种药物的,想分析下患者的基因型是否和药物的疗效有关,或者与药物的不良反应有关。下面是测序公司返回的数据,和患者的表型信息。先做SNP的。

合并VCF
首先将100个患者的单独vcf文件合并成一个vcf。使用的工具是 bcftools
第一步,生成压缩文件
ls *snp.vcf | while read vcf;do bgzip -c -f -@ 10 $vcf > ../SNV_gz/${vcf}.gz;done
第二步,建立索引
ls | while read vcf;do bcftools index $vcf;done
第三步,合并
bcftools merge *gz -o ../SNP_merge.vcf
转换成 .map 和 .ped 或者二进制的 .bed .bim .fam
暂时没有发现有什么很大的区别,二进制的似乎处理速度更快。.ped和 .map 在后面的处理中也会生成二进制的,所以我倾向直接生成二进制文件。这里我写有生成 .map .ped 的方法 https://www.jianshu.com/p/adf7e0038c0f
plink --vcf SNP_merge.vcf --allow-extra-chr --make-bed --out SNP
生成三个文件,其中.bed 是 二进制,其他两个和 .map 和 .ped中差不多,具体可以看我上面网址里的也可以看官方文档里的详细介绍。
添加表型信息
我的数据中不包含父母信息,实验也与此无关,所以家庭编号和父母编号都设置为未知0,主要添加性别和表型信息。plink1.9 中修改要简单点,你可以直接使用 Unix tail, cut, paste 和sed等方式修改文件,也可以使用官方的 —update-chr, —update-cm, —update-map, and —update-name 等命令。我使用R修改表型文件(SNP.fam)。
过滤 VCF
call出的SNP位点总会存在假阳性等可能,所以要过滤下。总结几篇文章,可以过率的工具也很多,有 samtools,vcftools,plink 等。能过滤的选项也真的是多,如果扩展起来都能写几篇文章。下面是一些常主流的,过滤主要包括两方面,一是对单个样本SNP质控,包括以下(公司返回的数据已经进行了第一步的过滤)
http://www.cnblogs.com/chenwenyan/p/10563835.html
https://www.jianshu.com/p/cf7cd6b5e54a
https://www.cnblogs.com/leezx/p/9013615.html QC 部分
- The mapping quality >30;
- The depth of the variate position >4
- The QUAL>20
二是对所有样本根据生物意义和统计学进行过滤,包括以下 - 次等位基因深度(minor allele count)不少于3
- SNP在所有样本里缺失过多则删除此SNP
- 样本缺失太多SNP则删除样本
- 次等位基因频率(MAF)
根据文献确定下面的简单过滤方式 。
—geno filters out all variants with missing call rates exceeding the provided value (default 0.1) to be removed, while —mind does the same for samples.
—maf filters out all variants with minor allele frequency below the provided threshold (default 0.01)
—hwe filters out all variants which have Hardy-Weinberg equilibrium exact test p-value below the provided threshold. We recommend setting a low threshold—serious genotyping errors often yield extreme p-values like 1e-50 which are detected by any reasonable configuration of this test, while genuine SNP-trait associations can be expected to deviate slightly from Hardy-Weinberg equilibrium (so it’s dangerous to choose a threshold that filters out too many variants).
plink --bfile SNP --geno 0.1 --maf 0.05 --mind 0.05 --hwe 0.0001 --make-bed --out SNP_filter
这里过滤遇到一个问题,不清楚多个过滤选项的时候先后顺序是什么。例如其实去除 —geno>0.1 的SNP后,样本 —mind 是都小于 0.05的,但是提示我样本都不合格都被剔除了。所以我就分步进行了过滤。
过滤前100个样本,239091个SNP,过滤后只剩下11410个SNPs。
PCA 分析
https://www.jianshu.com/p/968c5cb911dd
plink --bfile SNP --pca -out SNP_pca
会生成 SNP_pca.eigenval 和 SNP_pca.eigenvec 文件。然后用R读取SNP_pca.eigenvec 文件分析。
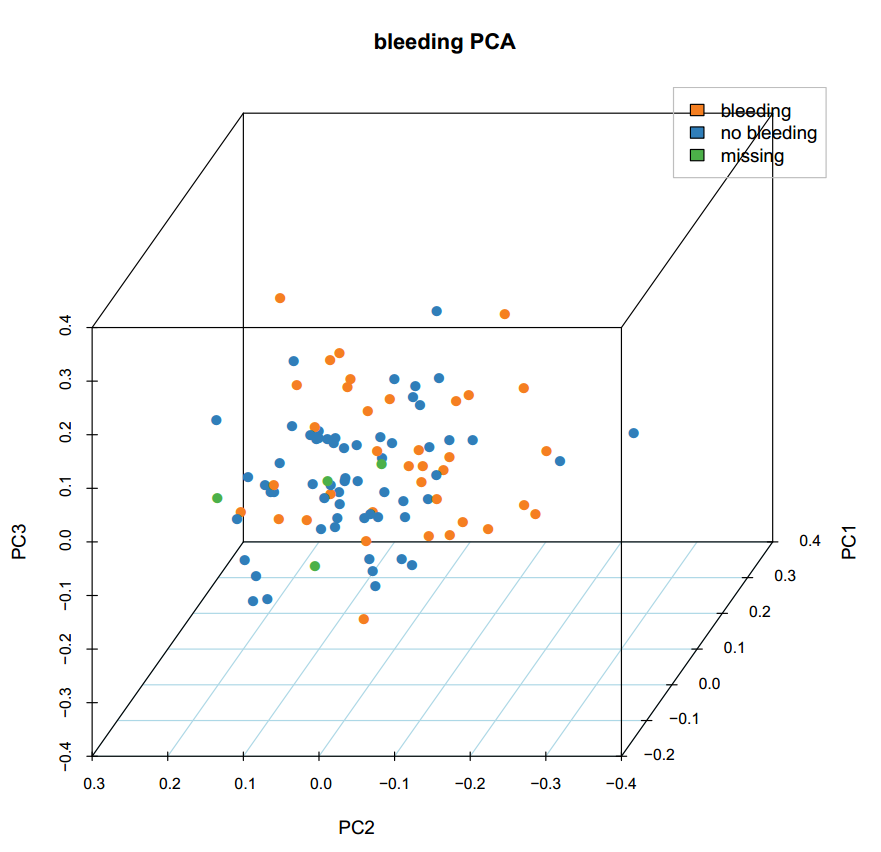
pca<- read.table("SNP_filter/SNP_pca.eigenvec", header=F ,sep=" ")pch <- trait[,8]col=pch#[1] 2 1 2 1 2 1 1 1 2 2 2 3 2 2 2 2 2 2 1 1 1 2 1 2 2 2 2 2 2 1 1 2 2 1 2 2 2#[38] 1 2 2 1 2 2 2 2 2 2 1 1 1 2 2 2 2 2 3 1 2 2 2 1 2 2 1 2 3 3 1 2 2 2 1 1 1#[75] 1 1 1 1 2 1 2 1 2 2 1 2 1 2 1 1 2 1 2 1 2 2 2 2 2 2plot(pca$V3,pca$V4 ,pch=pch,col=col,main="pca",xlab="pc1",ylab="pc2")
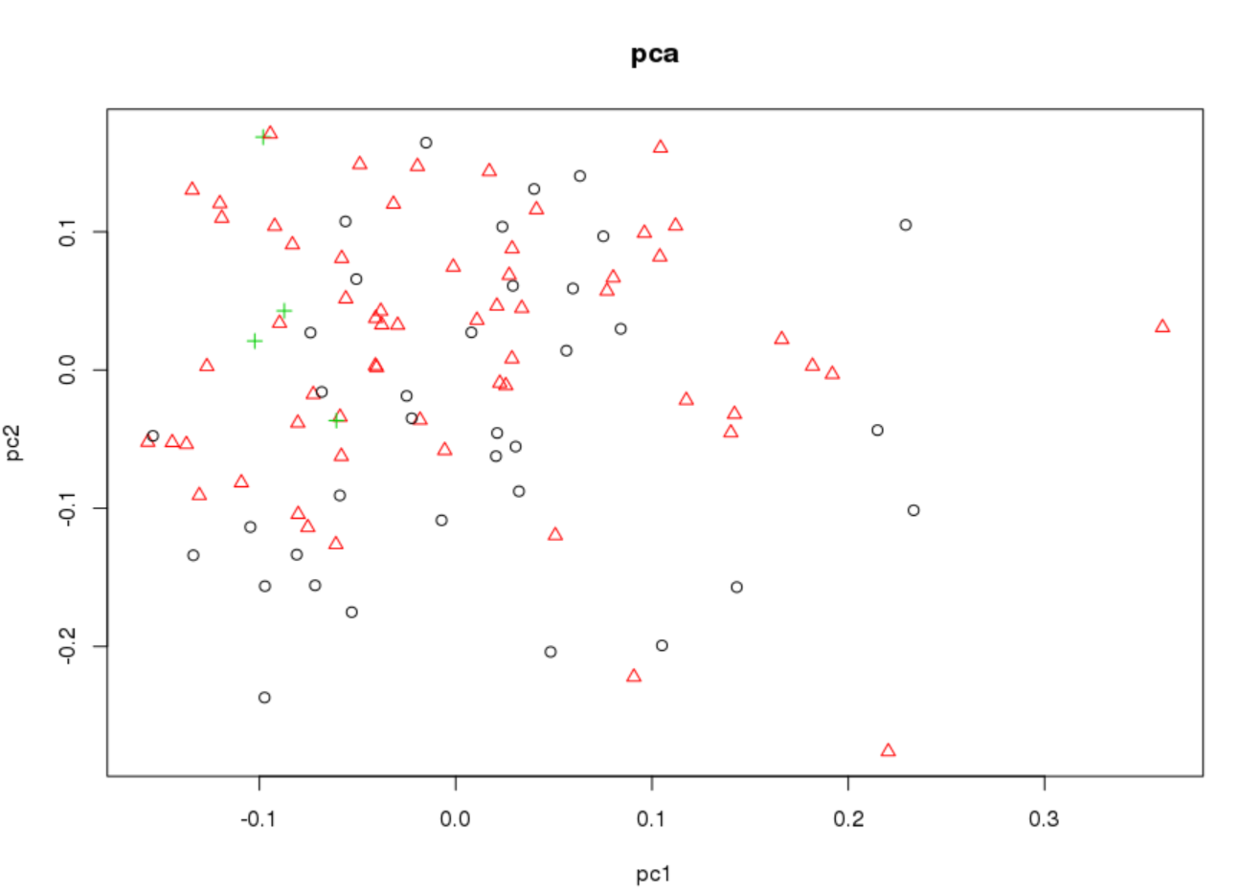
根据此表型完全无法将样本分开, 同时又试了其他几个表型,也不行。所以是否是因为在遗传学上,这些样本并无太大差异,待考证。在其他文章中此方法用于 Population structure, 不同地域种群差异。
使用PC1、PC2、PC3 作图也一样。
其他参考文章
https://www.jianshu.com/p/286050959dbd
https://www.cnblogs.com/leezx/p/9013615.html
https://wenku.baidu.com/view/1b984c16482fb4daa58d4bfd.html?pn=51

若有收获,就点个赞吧
0 人点赞
