官方参考
https://deeptools.readthedocs.io/en/develop/content/installation.html
下载安装
- python pip 安装
$ conda install -c bioconda deeptools
- conda 安装
$ conda install -c bioconda deeptools
bamCoverage 介绍
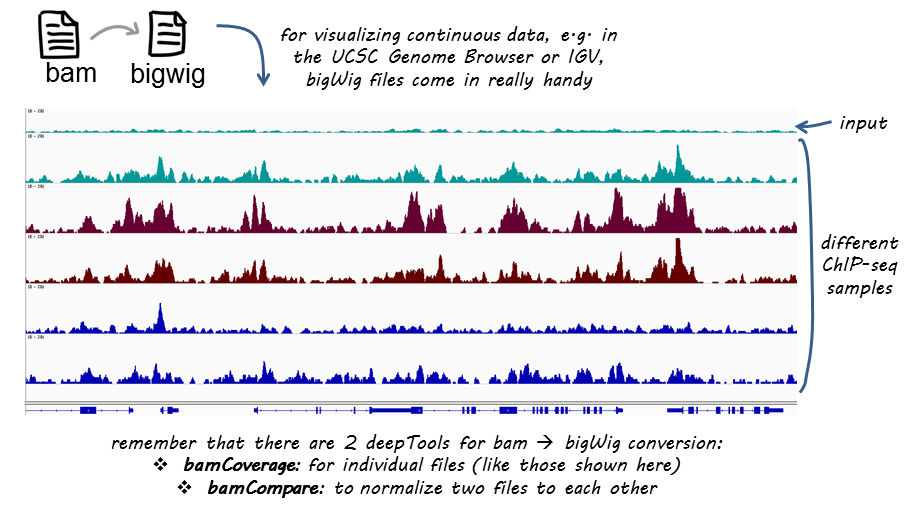
此工具将读取BAM文件,并生成bigWig或bedGraph。覆盖率计算为每个bin的读取次数,bin为定义的连续读取的窗口大小。bamCoverage通过RPKM,CPM,BPM ,1x,RPGC等方法提供标准化。
ChIP-seq的用法示例
较小的bin大小用于更高的分辨率,将覆盖范围标准化为1x小鼠基因组大小,在标准化步骤期间排除染色体X,以及扩展读取:
bamCoverage —bam a.bam -o a.SeqDepthNorm.bw
—binSize 10
—normalizeUsing RPGC
—effectiveGenomeSize 2150570000
—ignoreForNormalization chrX
—extendReads
bigwigCompare 的使用
此工具根据映射的读取数比较两个bigWig文件。为了比较bigWig文件,将基因组划分为相同大小的区间,然后在每个区域中计算reads,然后给出数值。该值可以比率,比率的log2值,求和或者差值。
usage: bigwigCompare
—bigwig1, -b1 Bigwig file 1. Usually the file for the treatment.
—bigwig2, -b2 Bigwig file 2. Usually the file for the control.
—binSize, -bs Size of the bins, in bases, for the output of the bigwig/bedgraph file.
—numberOfProcessors, -p
Number of processors to use. Type “max/2” to use half the maximum number of processors or “max” to use all available processors.
—outFileName, -o Output file name
—outFileFormat, -of Possible choices: bigwig, bedgraph
computeMatrix 的使用
此工具依赖于上面步骤生成的bw文件,再给出bed或者gtf文件的区域(例如TSS),计算每个基因区域的结合得分,生成中间文件用以给plotHeatmap和plotProfiles作图。
$ computeMatrix reference-point \ # choose the mode
—referencePoint TSS \ # alternatives: TES, center
-b 3000 -a 10000 \ # define the region you are interested in
-R testFiles/genes.bed
-S testFiles/log2ratio_H3K4Me3_chr19.bw
—skipZeros
-o matrix1_H3K4me3_l2r_TSS.gz \ # to be used with plotHeatmap and plotProfile
—outFileSortedRegions regions1_H3K4me3_l2r_genes.bed
-p the number of threads
plotHeatmap
这个工具根据区域得分画出热图,依赖于上面computeMatrix 产生的矩阵文件。
This tool creates a heatmap for scores associated with genomic regions. The program requires a matrix file generated by the tool computeMatrix.
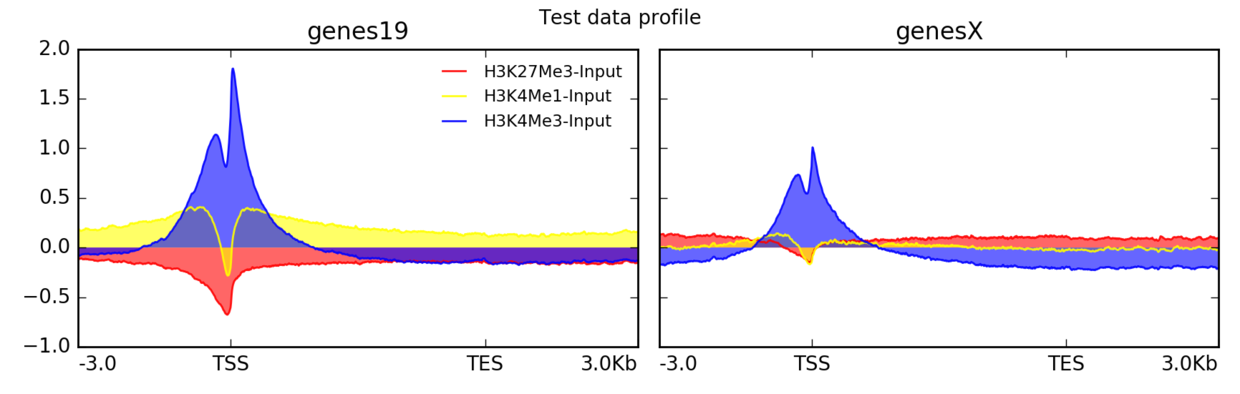
plotProfile
$ plotProfile -m matrix.mat.gz
-out ExampleProfile2.png
—plotType=fill \ # add color between the x axis and the lines
—perGroup \ # make one image per BED file instead of per bigWig file
—colors red yellow blue
—plotTitle “Test data profile”

若有收获,就点个赞吧
0 人点赞
