1. 概览
2. 安装
import plotly.graph_objects as gofig = go.Figure(data=go.Bar(y=[2, 3, 1]))# you can also use `fig.show()`fig.write_html("first_figure.html", auto_open=True)
3. 在Dash中使用Plotly
import dashimport dash_core_components as dccimport dash_html_components as htmlimport plotly.graph_objects as gofrom dash.dependencies import Input, Outputapp = dash.Dash(__name__)app.layout = html.Div([html.P("Color:"),dcc.Dropdown(id="dropdown",options=[{"label": x, "value": x}for x in ["Gold", "MediumTurquoise", "LightGreen"]],value="Gold",clearable=False),dcc.Graph(id="graph")])@app.callback(Output("graph", "figure"),[Input("dropdown", "value")])def display_color(color):fig = go.Figure(data=go.Bar(y=[2, 3, 1], marker_color=color))return figapp.run_server(debug=True)
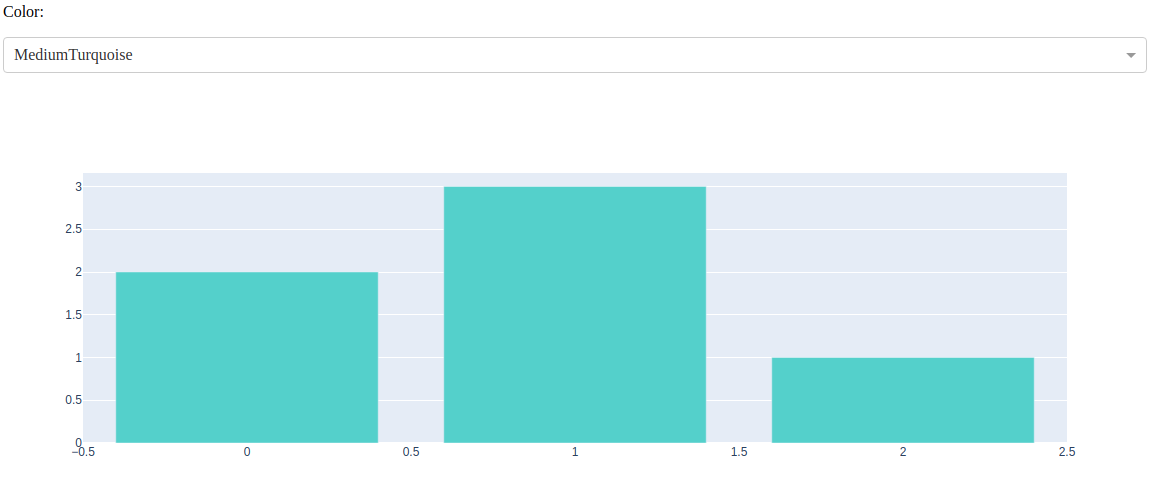
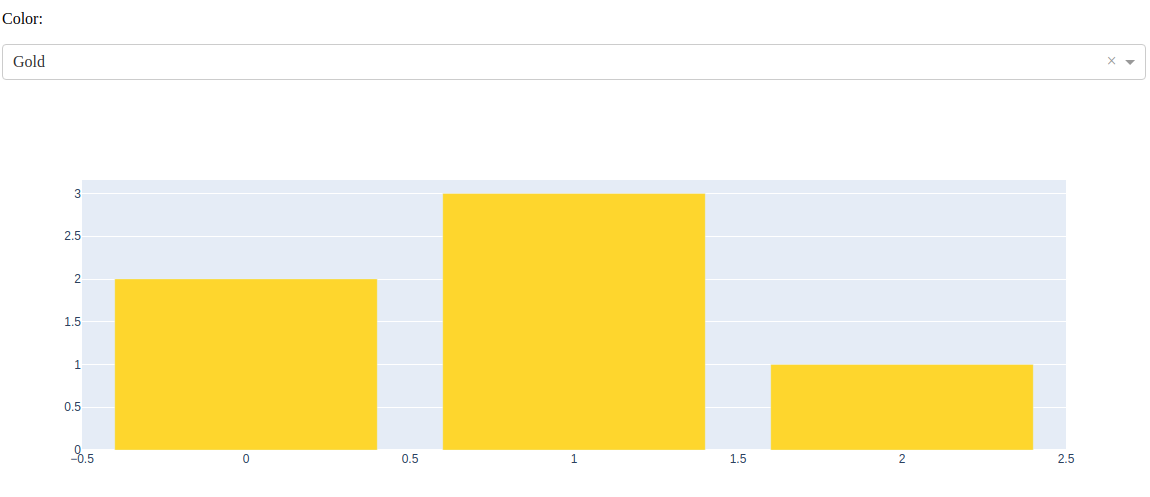
clearable如果设置为 True,则在下拉框中会出现一个 x 清除选项
4. Jupyter Notebook支持
import plotly.graph_objects as gofig = go.Figure(data=go.Bar(y=[2, 3, 1]))fig.show()
💡 你也可以直接使用
FigureWidget对象,改写上面语句为fig = go.FigureWidget(data=go.Bar(y=[2, 3, 1])),显示的页面效果是一样的。
5. JupyterLab支持
6. 静态图片导出
6.1 Kaleido
6.2 Orca
7. Geo地图扩展支持
8. Chart Studio支持
9. Dash是什么?
import dashimport plotly.graph_objects as goimport dash_core_components as dccimport dash_html_components as htmlfig = go.Figure()app = dash.Dash()app.layout = html.Div([dcc.Graph(figure=fig)])app.run_server(debug=True, use_reloader=False)

若有收获,就点个赞吧
0 人点赞
