📃 参考文档:https://www.geeksforgeeks.org/set-pandas-dataframe-background-color-and-font-color-in-python/ 📃 参考文档:http://www.zzvips.com/article/84604.html
使用 Pandas 进行数据分析时,很多时候我们希望能够对 DataFrame 中结果进行高亮,从而方便我们快速地挖掘出一些有用的信息,通常需要高亮场景有以下几种:
- 在 Jupyter Notebook 中高亮
- 高亮单元格背景和文字颜色
- 添加色阶
- 高亮最大、最小、空值单元格
- 根据过滤条件进行高亮
- 高亮文本列中关键词
- 导出 Excel 文件内容时高亮
- 高亮单元格背景和文字颜色
- 添加色阶
- 高亮最大、最小、空值单元格
- 根据过滤条件进行高亮
- 高亮文本列中关键词
关于对导出 Excel 文件内容进行高亮,如果不是周期性的任务,我个人觉得使用 Python 来做这件事情,并没有特别大的意义,反而直接使用 Excel 原生操作更方便些,但如果每天需要生成指定样式的 Excel 文件,如何使用 Pandas 来对输出内容进行高亮还是很有必要做一个详细讲解的。
1、Jupyter Notebook
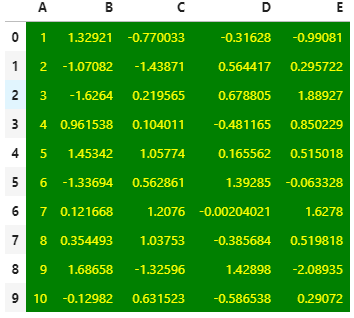
1.1 设置单元格的背景色和字体颜色
import pandas as pdimport numpy as np# Seeding random data from numpynp.random.seed(24)# Making the DatFramedf = pd.DataFrame({'A': np.linspace(1, 10, 10)})df = pd.concat([df, pd.DataFrame(np.random.randn(10, 4), columns=list('BCDE'))], axis=1)# DataFrame without any stylingstyle = {'background-color': 'green', 'color': 'yellow'}df.style.set_properties(**style)
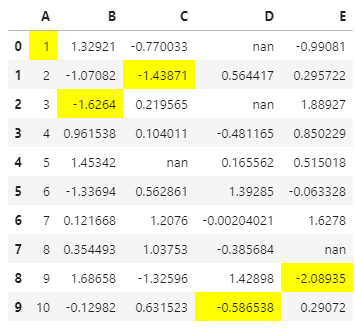
1.2 高亮最大、最小、空值单元格
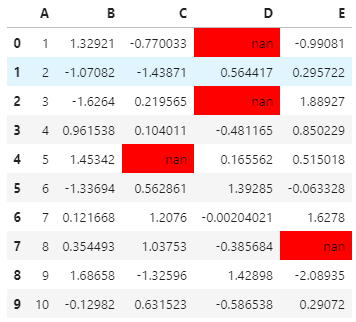
df.iloc[0, 3] = np.nandf.iloc[2, 3] = np.nandf.iloc[4, 2] = np.nandf.iloc[7, 4] = np.nan# Highlight the NaN values in DataFramedf.style.highlight_null(null_color='red')
# Highlight the Max values in each columndf.style.highlight_max(axis=0)
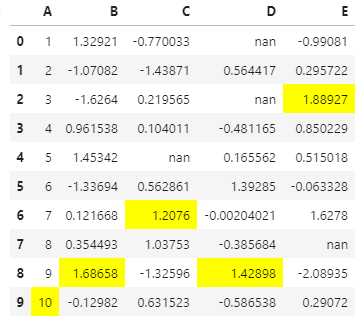
# Highlight the Min values in each columndf.style.highlight_min(axis=0)
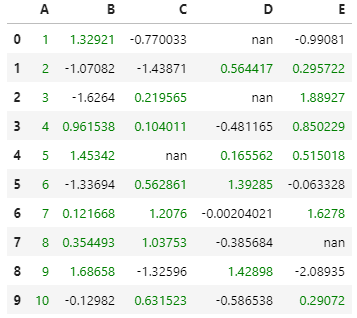
1.3 根据过滤条件进行高亮
def color_positive_green(val):"""Takes a scalar and returns a string withthe css property `'color: green'` for positivestrings, black otherwise."""if val > 0:color = 'green'else:color = 'black'return 'color: %s' % colordf.style.applymap(color_positive_green)
1.4 添加色阶
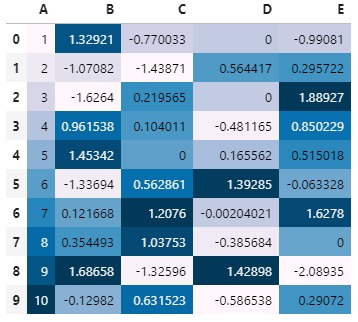
df.fillna(0).style.background_gradient()
 :::warning
💡
 background_gradient 还提供了一个 subset 参数,用于给指定列添加色阶
💡 使用这个方法同样可以使导出的 Excel 文件也具备色阶样式
:::
1.5 结合Seaborn来使用
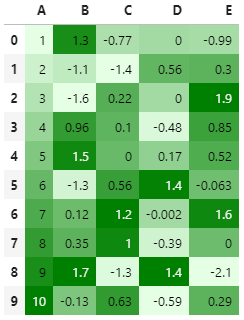
import seaborn as sns# Declaring the cm variable by the# color palette from seaborncm = sns.light_palette("green", as_cmap=True)# Visualizing the DataFrame with set precisiondf.fillna(0).style.background_gradient(cmap=cm).set_precision(2)
1.6 高亮文本
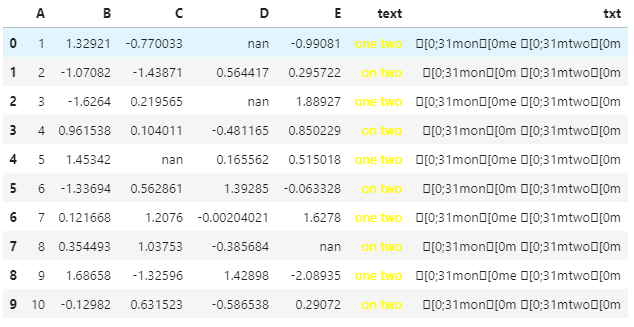
这是通过终端的方式来进行关键词的高亮,但是显示只能以 Series 方式才可以正确显示,DataFrame 的话则不可以。
def highlight_words(series, hl_words):for hlw in hl_words:series = series.str.replace(hlw, '\033[0;31m' + hlw + '\033[0m')return seriest = highlight_words(df["text"], hl_words=["on", "two"])
1.7 CSSSelector方式
我们还可以借用 CSSSelector 来给我们的 DataFrame 进行着色。
df.style.set_table_styles([{'selector': 'td:nth-child(7)', 'props': [('color', 'yellow')]}])
