原文链接:https://plotly.com/python/

Plotly’s Python graphing library makes interactive, publication-quality graphs. Examples of how to make line plots, scatter plots, area charts, bar charts, error bars, box plots, histograms, heatmaps, subplots, multiple-axes, polar charts(极坐标图), and bubble(气泡) charts.

Plotly.py is free and open source and you can view the source, report issues or contribute on GitHub.

1. Fundamentals

image.png

2. Artificial Intelligence and Machine Learning

image.png

3. Basic Charts

image.png

4. Statistical Charts

image.png

5. Scientific Charts

image.png

6. Financial Charts

image.png

7. Maps

image.png

8. 3D Charts

image.png

9. Subplots

image.png

10. Jupyter Widgets Interaction

image.png

11. Transforms

image.png

12. Add Custom Controls

image.png

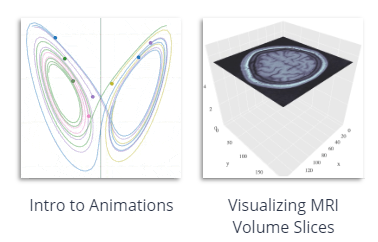
13. Animations

image.png

14. Chart Studio Integration

image.png

15. Advanced