1.需求说明
求出决策树的字典存储形式数据后,绘制出决策树的图形,则会更形象认识和了解其决策树。
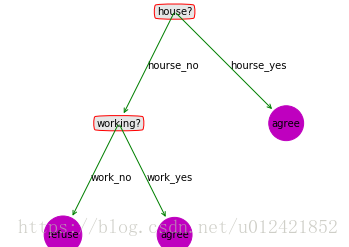
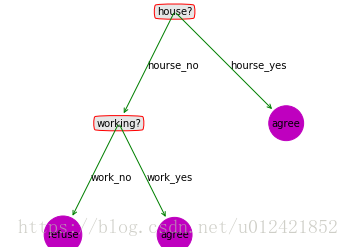
比如,有决策树的字典结构如下所示:
tree_dict = {'house?': {'hourse_no': {'working?': {'work_no': 'refuse', 'work_yes': 'agree'}}, 'hourse_yes': 'agree'}}
2. 代码
# -*- coding: utf-8 -*-"""@author: 蔚蓝的天空TomAim:得到决策树的字典后,需要使用python来绘制对应的决策树figure输入决策树的字典,样例如下所示:dtree = {'house?': {'hourse_no': {'working?': {'work_no': 'refuse', 'work_yes': 'agree'}}, 'hourse_yes': 'agree'}}"""import matplotlib.pyplot as plt#定义判断结点形状,其中boxstyle表示文本框类型,fc指的是注释框颜色的深度decisionNode = dict(boxstyle="round4", color='r', fc='0.9')#定义叶结点形状leafNode = dict(boxstyle="circle", color='m')#定义父节点指向子节点或叶子的箭头形状arrow_args = dict(arrowstyle="<-", color='g')def plot_node(node_txt, center_point, parent_point, node_style):'''绘制父子节点,节点间的箭头,并填充箭头中间上的文本:param node_txt:文本内容:param center_point:文本中心点:param parent_point:指向文本中心的点'''createPlot.ax1.annotate(node_txt,xy=parent_point,xycoords='axes fraction',xytext=center_point,textcoords='axes fraction',va="center",ha="center",bbox=node_style,arrowprops=arrow_args)def get_leafs_num(tree_dict):'''获取叶节点的个数:param tree_dict:树的数据字典:return tree_dict的叶节点总个数'''#tree_dict的叶节点总数leafs_num = 0#字典的第一个键,也就是树的第一个节点root = list(tree_dict.keys())[0]#这个键所对应的值,即该节点的所有子树。child_tree_dict =tree_dict[root]for key in child_tree_dict.keys():#检测子树是否字典型if type(child_tree_dict[key]).__name__=='dict':#子树是字典型,则当前树的叶节点数加上此子树的叶节点数leafs_num += get_leafs_num(child_tree_dict[key])else:#子树不是字典型,则当前树的叶节点数加1leafs_num += 1#返回tree_dict的叶节点总数return leafs_numdef get_tree_max_depth(tree_dict):'''求树的最深层数:param tree_dict:树的字典存储:return tree_dict的最深层数'''#tree_dict的最深层数max_depth = 0#树的根节点root = list(tree_dict.keys())[0]#当前树的所有子树的字典child_tree_dict = tree_dict[root]for key in child_tree_dict.keys():#树的当前分支的层数this_path_depth = 0#检测子树是否字典型if type(child_tree_dict[key]).__name__ == 'dict':#如果子树是字典型,则当前分支的层数需要加上子树的最深层数this_path_depth = 1 + get_tree_max_depth(child_tree_dict[key])else:#如果子树不是字典型,则是叶节点,则当前分支的层数为1this_path_depth = 1if this_path_depth > max_depth:max_depth = this_path_depth#返回tree_dict的最深层数return max_depthdef plot_mid_text(center_point, parent_point, txt_str):'''计算父节点和子节点的中间位置,并在父子节点间填充文本信息:param center_point:文本中心点:param parent_point:指向文本中心点的点'''x_mid = (parent_point[0] - center_point[0])/2.0 + center_point[0]y_mid = (parent_point[1] - center_point[1])/2.0 + center_point[1]createPlot.ax1.text(x_mid, y_mid, txt_str)returndef plotTree(tree_dict, parent_point, node_txt):'''绘制树:param tree_dict:树:param parent_point:父节点位置:param node_txt:节点内容'''leafs_num = get_leafs_num(tree_dict)root = list(tree_dict.keys())[0]#plotTree.totalW表示树的深度center_point = (plotTree.xOff+(1.0+float(leafs_num))/2.0/plotTree.totalW,plotTree.yOff)#填充node_txt内容plot_mid_text(center_point, parent_point, node_txt)#绘制箭头上的内容plot_node(root, center_point, parent_point, decisionNode)#子树child_tree_dict = tree_dict[root]plotTree.yOff=plotTree.yOff-1.0/plotTree.totalD#因从上往下画,所以需要依次递减y的坐标值,plotTree.totalD表示存储树的深度for key in child_tree_dict.keys():if type(child_tree_dict[key]).__name__ == 'dict':plotTree(child_tree_dict[key],center_point,str(key))else:plotTree.xOff=plotTree.xOff+1.0/plotTree.totalWplot_node(child_tree_dict[key],(plotTree.xOff,plotTree.yOff),center_point,leafNode)plot_mid_text((plotTree.xOff,plotTree.yOff),center_point,str(key))#h绘制完所有子节点后,增加全局变量Y的偏移plotTree.yOff=plotTree.yOff+1.0/plotTree.totalDreturndef createPlot(tree_dict):'''绘制决策树图形:param tree_dict:return 无'''#设置绘图区域的背景色fig=plt.figure(1,facecolor='white')#清空绘图区域fig.clf()#定义横纵坐标轴,注意不要设置xticks和yticks的值!!!axprops = dict(xticks=[], yticks=[])createPlot.ax1=plt.subplot(111, frameon=False, **axprops)#由全局变量createPlot.ax1定义一个绘图区,111表示一行一列的第一个,frameon表示边框,**axprops不显示刻度plotTree.totalW=float(get_leafs_num(tree_dict))plotTree.totalD=float(get_tree_max_depth(tree_dict))plotTree.xOff=-0.5/plotTree.totalW;plotTree.yOff=1.0;plotTree(tree_dict, (0.5,1.0), '')plt.show()if __name__=='__main__':tree_dict = {'house?': {'hourse_no': {'working?': {'work_no': 'refuse', 'work_yes': 'agree'}}, 'hourse_yes': 'agree'}}createPlot(tree_dict)
3.运行结果
3.1 如果树的字典存储为
tree_dict = {'house?': {'hourse_no': {'working?': {'work_no': 'refuse', 'work_yes': 'agree'}}, 'hourse_yes': 'agree'}}
则绘制的树图形为:

3.2 如果树的字典存储为
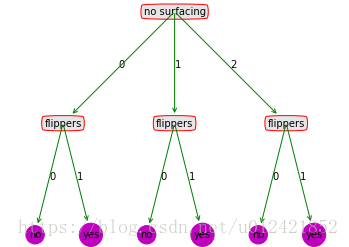
tree_dict = {'no surfacing': {0:{'flippers': {0: 'no', 1: 'yes'}}, 1: {'flippers': {0: 'no', 1: 'yes'}}, 2:{'flippers': {0: 'no', 1: 'yes'}}}}
则绘制的树图形为:


