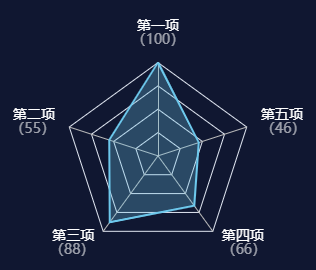
效果
代码
import { useRef, useEffect } from 'react';import * as echarts from 'echarts';import _ from 'lodash';const data = [{text: '第一项',num: 100,},{text: '第二项',num: 55,},{text: '第三项',num: 88,},{text: '第四项',num: 66,},{text: '第五项',num: 46,},];const max = _.maxBy(data, (item) => item.num)?.num;const option: echarts.EChartsOption = {normal: {backgroundColor: '',},tooltip: {show: true,trigger: 'item',axisPointer: {type: 'shadow',},backgroundColor: 'rgba(0, 0, 0, 0.6)',borderWidth: 1,borderColor: '#798CB2',textStyle: {fontSize: 24,color: '#fff',},},radar: {// shape: 'circle',radius: "60%", // 大小center: ["50%", "50%"], // 图的位置nameGap: 10, // 图中工艺等字距离图的距离name: { // 配置名称rich: { // 配置名称样式a: {color: '#fff',fontSize: 14,},b: {color: 'rgba(255, 255, 255, 0.6)',fontSize: 14,},},formatter: (value: string, indicator: any) => {return `{a|${value}}\n{b|(${indicator.count})}`;},},splitArea: {areaStyle: {color: ['transparent'],},},indicator: data.map((item) => ({text: item.text,max,num: item.num,})),},series: [{name: '标题名称',symbol: 'none',areaStyle: {color: 'rgba(109, 200, 236, 0.4)',},itemStyle: {color: 'rgba(109, 200, 236, 1)',},lineStyle: {color: 'rgba(109, 200, 236, 1)',width: 2,},type: 'radar',data: [data.map((item) => item.num)],},],};export default () => {const chartRef = useRef<HTMLDivElement>(null);const myChart = useRef<echarts.ECharts>();const initChart = () => {if (!myChart.current && chartRef?.current) {myChart.current = echarts.init(chartRef.current);myChart.current.setOption(option);}};useEffect(() => {initChart();}, []);return (<div style={{ width: 300, height: 300 }} ref={chartRef} />);};
注意
雷达图的 grid 不生效,可以使用 radar: { radius: "60%", center: ["50%", "50%"]} 调整大小和位置。

若有收获,就点个赞吧
0 人点赞
