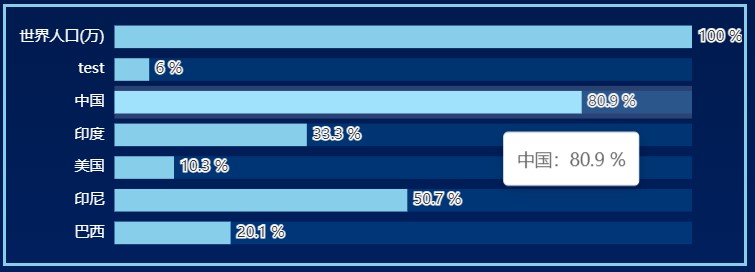
效果

代码
{ grid: { top: 10, right: 40, bottom: 10, left: 10, containLabel: true, }, tooltip: { trigger: 'axis', axisPointer: { type: 'shadow', }, formatter: '{b}:{c} %', }, xAxis: { type: 'value', max: 100, // 最大 100% axisLine: { show: false, }, splitLine: { show: false, }, axisTick: { show: false, }, axisLabel: { show: false, }, }, yAxis: { type: 'category', data: ['巴西', '印尼', '美国', '印度', '中国', 'test', '世界人口(万)'], axisLine: { show: false, }, splitLine: { show: false, }, axisTick: { show: false, }, axisLabel: { color: 'rgba(255, 255, 255, 1)', }, }, series: [ { type: 'bar', data: [20.1, 50.7, 10.3, 33.3, 80.9, 6.0, 100], showBackground: true, backgroundStyle: { color: 'rgba(0, 149, 237, 0.2)', }, itemStyle: { color: 'skyblue', }, label: { show: true, position: 'right', formatter: '{c} %', }, }, ],}


