本文作者:@猫神 viser-graph 地址:https://github.com/viserjs/viser/tree/master/packages viser-graph 官网demo:https://viserjs.gitee.io/demoHome.html
前言
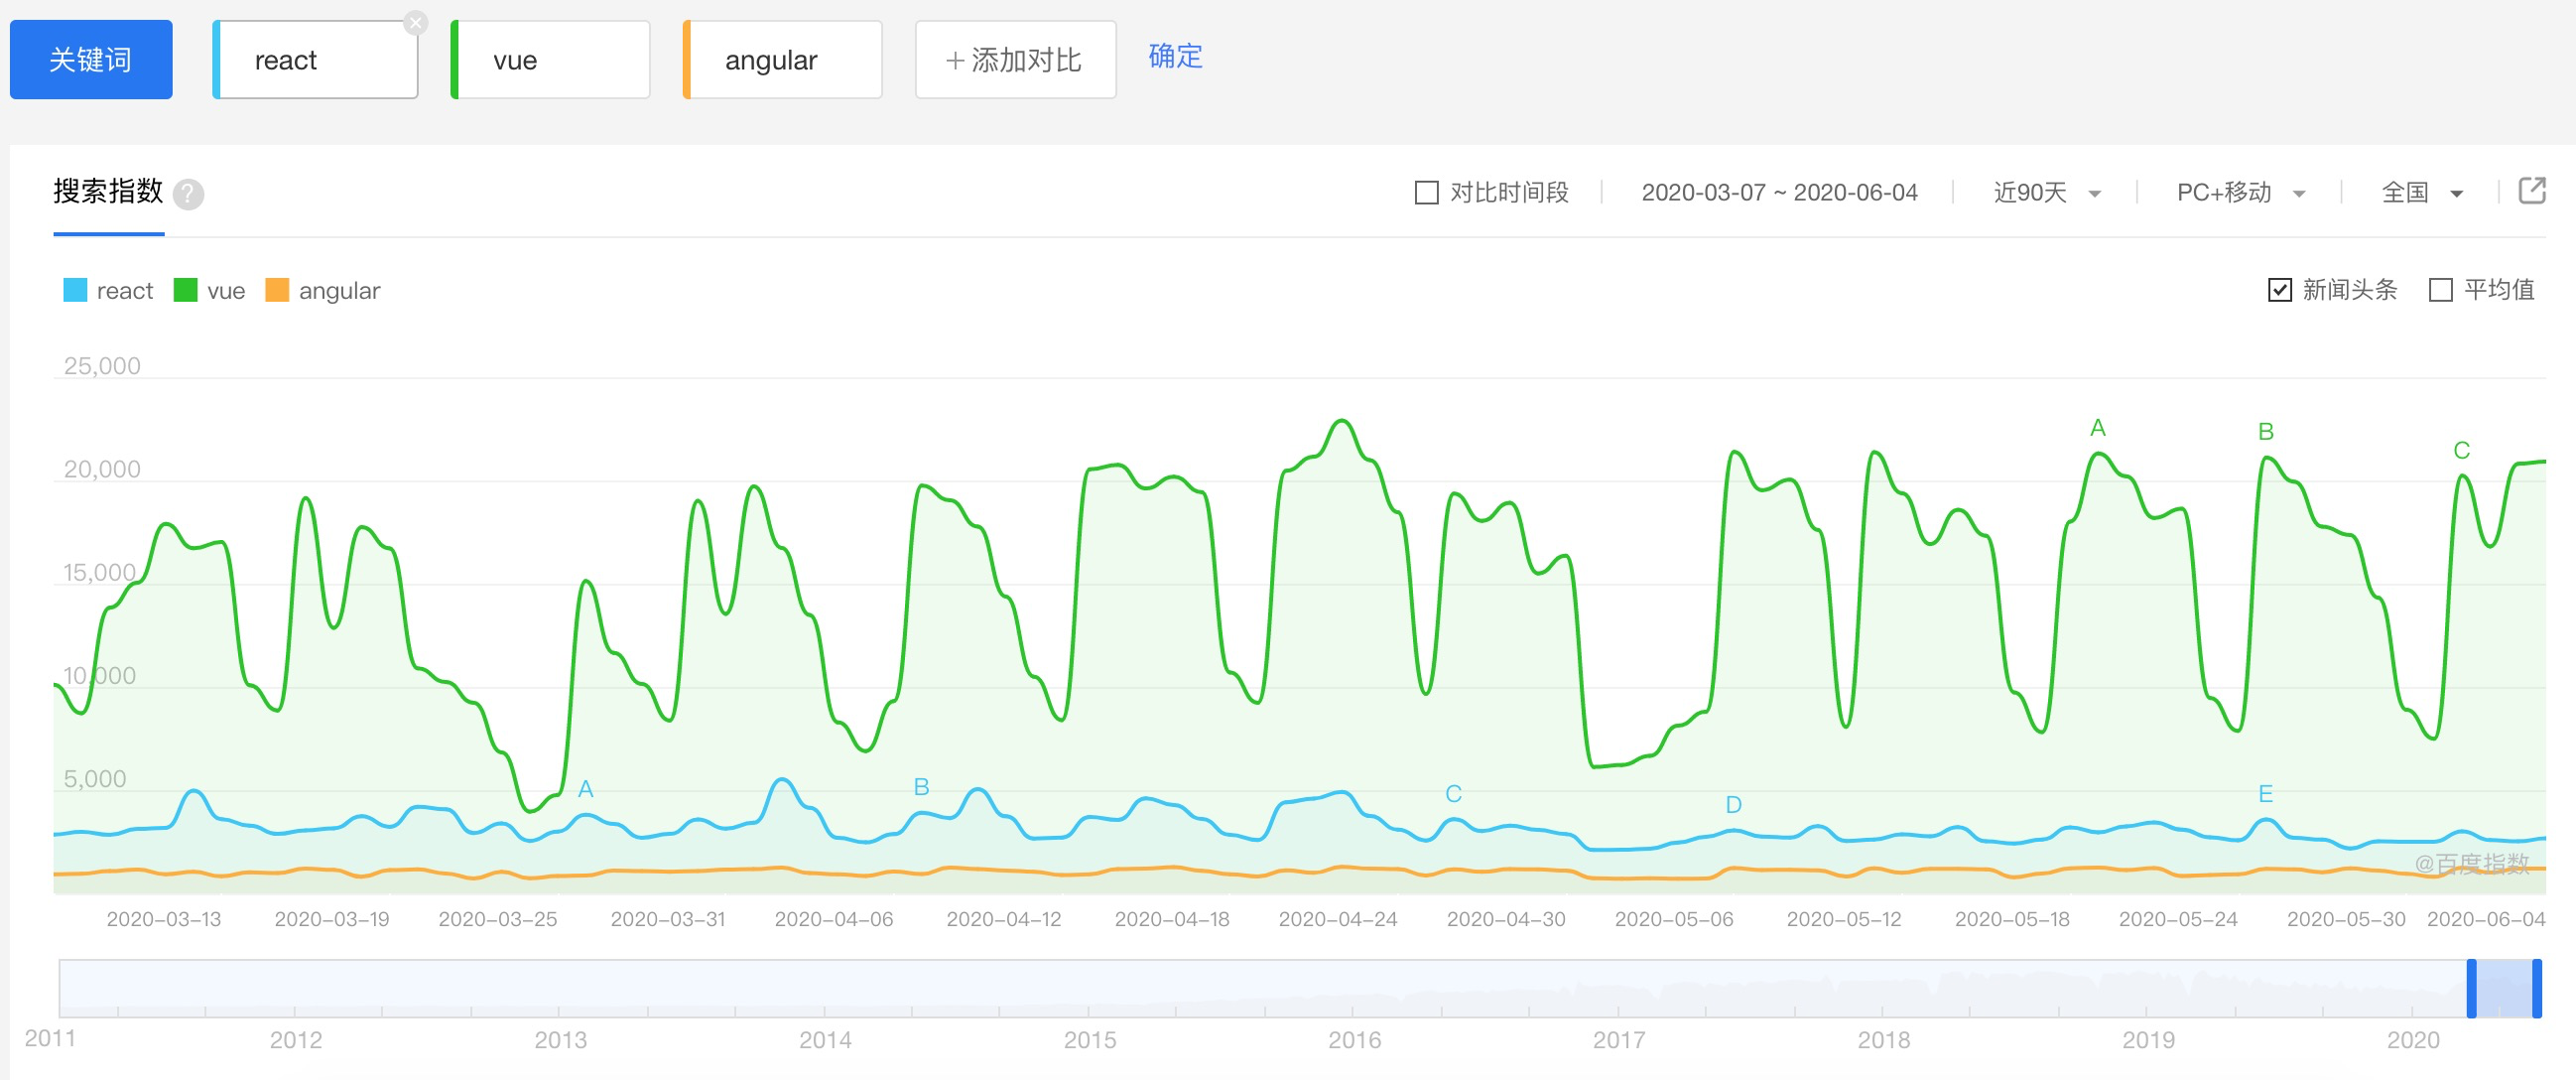
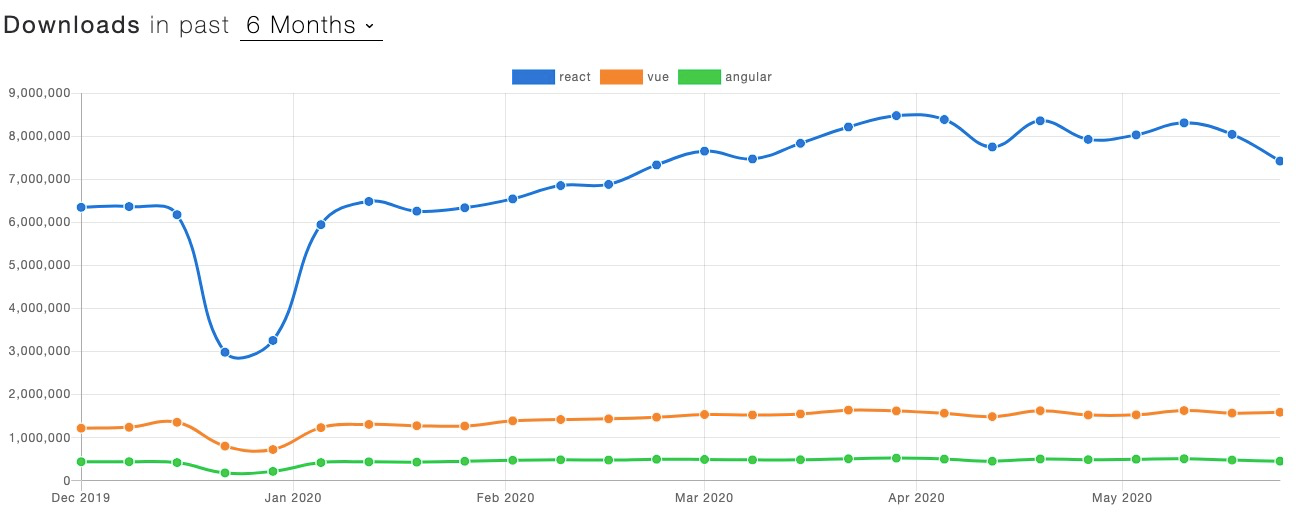
自2014年MVVM框架开始冒出苗头,到现如今react、angular、vue三驾马车并驾齐驱。查看谷歌趋势、百度指数、npm生态三大流量来源,可以看出来angular 已经逐渐落后,react 一骑绝尘国外断层式领先、生态最完善,vue渐渐在国内占据主要份额,但并没有哪一个框架能真正一统江湖。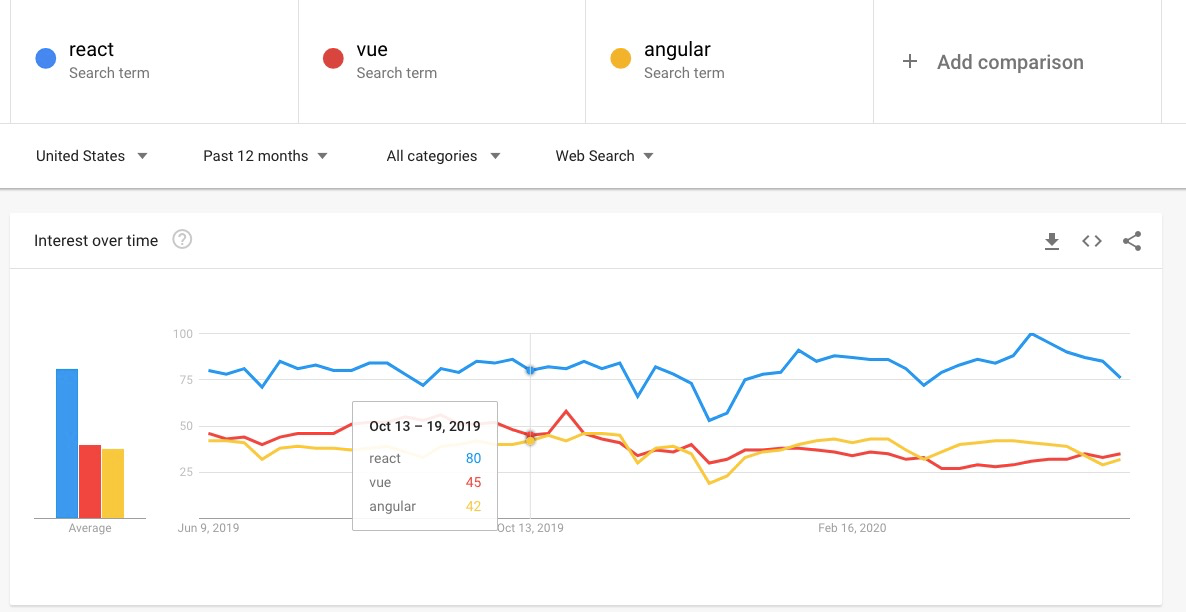
由此可见,我们框架使用者在图可视化开发时,我们面临几个问题:
- 如果没有基于框架封装的可视化库,需要采用函数式调用可视化库,放弃了MVVM框架的优势
- 如果切换框架,可能面临切换图可视化库,重新熟悉一套api
- 类似d3、g2 此类过程式语法开发,势必提升api 理解成本,提高开发门槛。
在这个背景下,viser-graph应运而生,提供一套api 完美解决3大框架开发者图可视化需求。 viser-graph底层基于g6(国内TOP1图可视化引擎),抽象出一套组件式图可视化开发模式。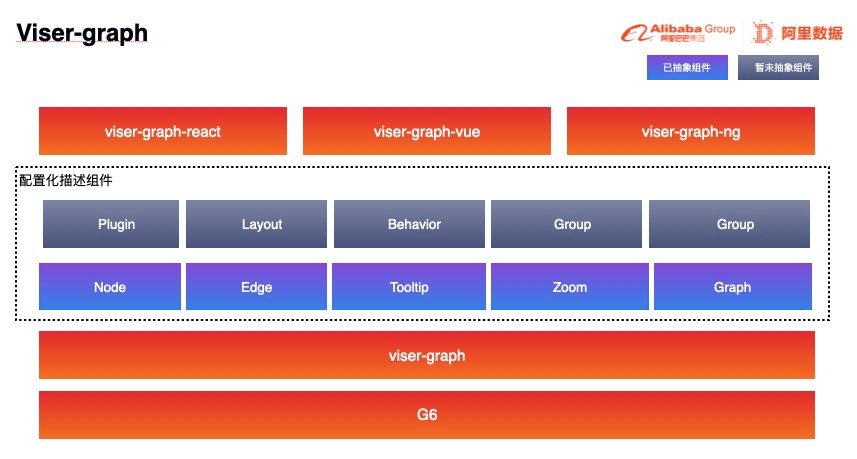
viser-graph 的能力是完全与g6 对标,只要g6 能实现的viser-graph 通通满足你,还会增加一些小点心,提高开发效率哦。例如内置常用的utils 方法:
- strLen 计算字符长度
- ellipsisString 字符串过长以…呈现
当然这些常用方法,也期望大家的共建,大家的输入才能让viser-graph 更好用。
解密
下面来说说viser-graph 怎么从json转化成一张图的吧,以下皆以react 框架的实现为例,我们首先需要明确每一层是做什么事情:
- viser-graph-react:将组件解析成完整的json
viser-graph: 将json 对应成 g6 的api,渲染成图
viser-graph-react
首先我们拆分基础组件
graph:画布最外层组件,包括数据的传入、容器的定义、布局的定义等。
- node:节点的定义,包括节点的format(样式、大小) 等,目前组件的属性都封装的比较简单,满足基本的诉求。
- edge:边的定义,包括边的的format(样式、大小) 等,满足基本的诉求。
- zoom:画布缩放,包括当前缩放比率、最大缩放比率、最小缩放比例等。
详细可见 案例, 定义了一颗紧凑树,包括graph、node、edge的定义。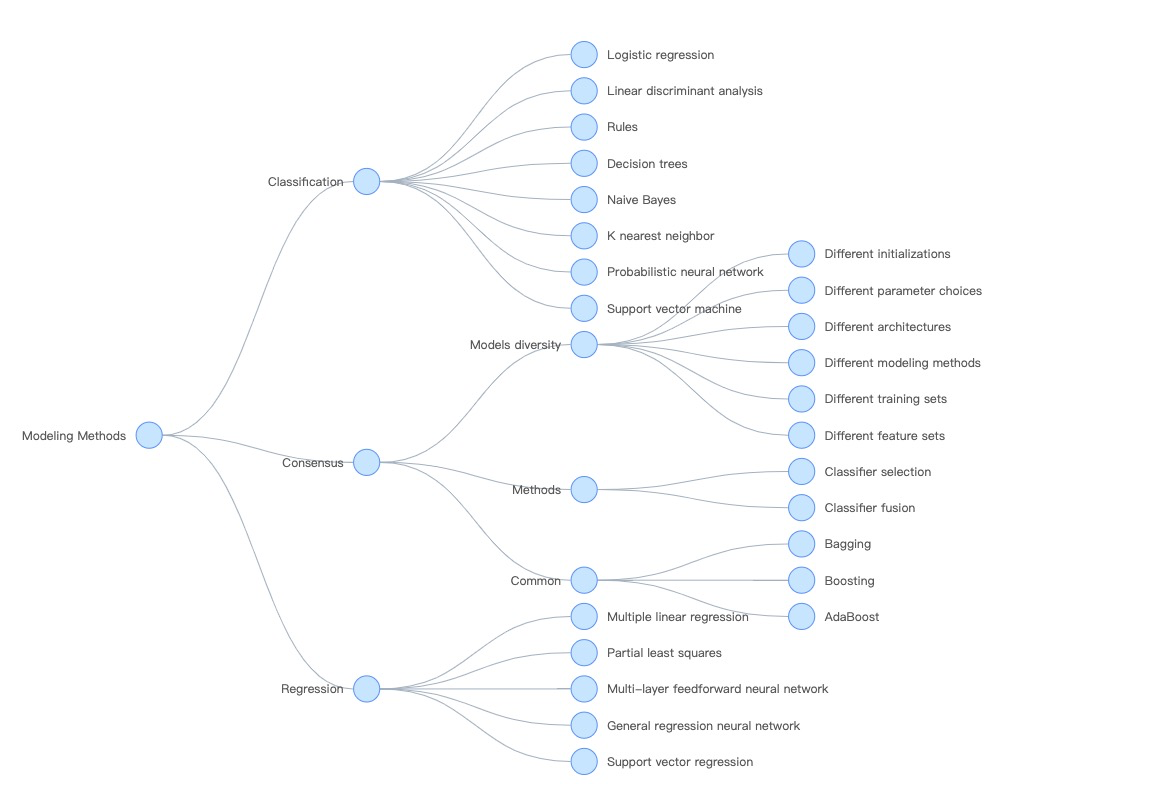
import * as React from 'react';import { Graph, Node, Edge } from 'viser-graph-react';const data = {id: "Modeling Methods",children: [{id: "Classification",children: [{ id: "Logistic regression" },{ id: "Linear discriminant analysis" },{ id: "Rules" },{ id: "Decision trees" },{ id: "Naive Bayes" },{ id: "K nearest neighbor" },{ id: "Probabilistic neural network" },{ id: "Support vector machine" }]},{id: "Consensus",children: [{id: "Models diversity",children: [{ id: "Different initializations" },{ id: "Different parameter choices" },{ id: "Different architectures" },{ id: "Different modeling methods" },{ id: "Different training sets" },{ id: "Different feature sets" }]},{id: "Methods",children: [{ id: "Classifier selection" },{ id: "Classifier fusion" }]},{id: "Common",children: [{ id: "Bagging" },{ id: "Boosting" },{ id: "AdaBoost" }]}]},{id: "Regression",children: [{ id: "Multiple linear regression" },{ id: "Partial least squares" },{ id: "Multi-layer feedforward neural network" },{ id: "General regression neural network" },{ id: "Support vector regression" }]}]};const graph = {data,container: 'mount',type: 'tree',width: 500,height: 500,pixelRatio: 2,renderer: 'svg',fitView: true,modes: {default: ['collapse-expand', 'drag-canvas']},defaultNode: {size: 26,anchorPoints: [[ 0, 0.5 ], [ 1, 0.5 ]],},layout: {type: 'compactBox',direction: 'LR',defalutPosition: [],getId(d) { return d.id; },getHeight() { return 16 },getWidth() { return 16 },getVGap() { return 10 },getHGap() { return 100 }}};const node = {formatter: node => {return {size: 26,style: {fill: '#C6E5FF',stroke: '#5B8FF9'},label: node.id,labelCfg: {offset: 10,position: node.children && node.children.length > 0 ? 'left' : 'right'}}}}const edge = {formatter: () => {return {shape: 'cubic-horizontal',color: '#A3B1BF',}},}export default class App extends React.Component {constructor(props) {super(props);}render() {return (<div><Graph {...graph}><Node {...node}/><Edge {...edge}/></Graph></div>);}}
viser-graph-react 递归解析组件,解析出子组件的json,然后通过 context 传递子组件json给最外层的graph,组装成完整的图json( 如下 ),然后再调用 viser-graph 进行渲染。
{data,graph: {container: 'mount',type: 'tree',width: 500,height: 500,pixelRatio: 2,renderer: 'svg',modes: {default: ['collapse-expand', 'drag-canvas']},fitView: true,layout: {type: 'compactBox',direction: 'LR',defalutPosition: [],getId(d) { return d.id; },getHeight() { return 16 },getWidth() { return 16 },getVGap() { return 10 },getHGap() { return 100 }}},node: {formatter: node => {return {size: 26,anchorPoints: [[0,0.5], [1,0.5]],style: {fill: '#C6E5FF',stroke: '#5B8FF9'},label: node.id,labelCfg: {offset: 10,position: node.children && node.children.length > 0 ? 'left' : 'right'}}}},edge: {formatter: () => {return {shape: 'cubic-horizontal',color: '#A3B1BF',}},},}
viser-graph
viser-graph的设计是将各子组件的json与g6的api 对应,调用g6 的api 进行绘制。可见如下:
// 文件:viser-graph/src/graph.tspublic render() {// 初始化G6 实例this.setGraph();// 设置节点属性this.setNode();// 设置边属性this.setEdge();// 设置数据this.setData();// 设置缩放this.setZoom();// TODO: 后续可进一步拆分 tooltip layout plugin 等,避免graph 属性过于堆积// 调用实例render方法进行渲染this.graph.render();// 渲染完成后进行事件绑定this.setEvent();}
viser-graph 这一层做的非常轻薄, 只是根据json 调用g6的api ,进行绘制。
其他 vue 、ng 框架也是类似,viser-graph-vue 、viser-graph-ng负责将组件解析成json,调用 viser-graph 进行最后的绘制。
无缝对接G6
除了我们封装的api 外,可能还有些场景需要直接操作g6 的api,那么我们怎么办?很简单,viser-graph-react 暴露了 G6 的入口,使用如下所示:
import * as React from 'react';// GlobalG6 入口import { Graph, Node, Edge, GlobalG6 } from 'viser-graph-react';// 直接调用 GlobalG6 进行注册节点GlobalG6.registerNode('file-node', {draw: function draw(cfg, group) {const keyShape = group.addShape('rect', {attrs: {x: cfg.x - 4,y: cfg.y - 12,fill: '#fff',stroke: null}});if (cfg.collapsed) {group.addShape('marker', {attrs: {symbol: 'triangle',x: cfg.x + 4,y: cfg.y - 2,r: 4,fill: '#666'}});} else if (cfg.children && cfg.children.length > 0) {group.addShape('marker', {attrs: {symbol: 'triangle-down',x: cfg.x + 4,y: cfg.y - 2,r: 4,fill: '#666'}});}const shape = group.addShape('text', {attrs: {x: cfg.x + 15,y: cfg.y + 4,text: cfg.name,fill: '#666',fontSize: 16,textAlign: 'left'}});const bbox = shape.getBBox();keyShape.attr({width: bbox.width + 20,height: bbox.height + 4});return keyShape;}});// 直接调用 GlobalG6 进行注册边GlobalG6.registerEdge('step-line', {getControlPoints: function getControlPoints(cfg) {const startPoint = cfg.startPoint;const endPoint = cfg.endPoint;return [{x: startPoint.x,y: endPoint.y}];}}, 'polyline');const data = {id: '1',name: 'src',children: [{id: '1-1',name: 'behavior',children: []}, {id: '1-3',name: 'graph',children: [{id: '1-3-1',name: 'controller',children: []}]}, {id: '1-5',name: 'item',children: []}, {id: '1-6',name: 'shape',children: [{id: '1-6-2',name: 'extend',children: []}]}, {id: '1-7',name: 'util',children: []}]};const graph = {data,container: 'mount',type: 'tree',width: 500,height: 500,pixelRatio: 2,renderer: 'svg',fitView: true,modes: {default: ['collapse-expand', 'drag-canvas']},defaultNode: {shape: 'file-node',},defaultEdge: {style: {stroke: '#A3B1BF'}},layout: {type: 'indented',isHorizontal: true,direction: 'LR',indent: 30,getHeight() { return 16 },getWidth() { return 16 },}};const node = {formatter: node => {return {shape: 'file-node',label: node.name}}}const edge = {formatter: () => {return {shape: 'step-line',style: {stroke: '#A3B1BF'}}},}export default class App extends React.Component {constructor(props) {super(props);}render() {return (<div><Graph {...graph}><Node {...node}/><Edge {...edge}/></Graph></div>);}}
通过透传G6 入口,完整提供g6 的能力,不再受限于viser-graph-react封装的局限性,给开发带来更多的可能性。
结语
热烈欢迎大家来使用viser-graph,更热烈欢迎一起来开发的同学,如果发现配置有缺失,可以直接提交PR哈,也是非常简单的。期望大家能使用viser-graph迈入图可视化开发的大门,正向输入业务上的通用场景,帮助viser-graph更好的服务大家。
链接

若有收获,就点个赞吧
0 人点赞
