AntV G6是蚂蚁金服出品的图可视化引擎。
官网地址:g6.antv.vision/zh
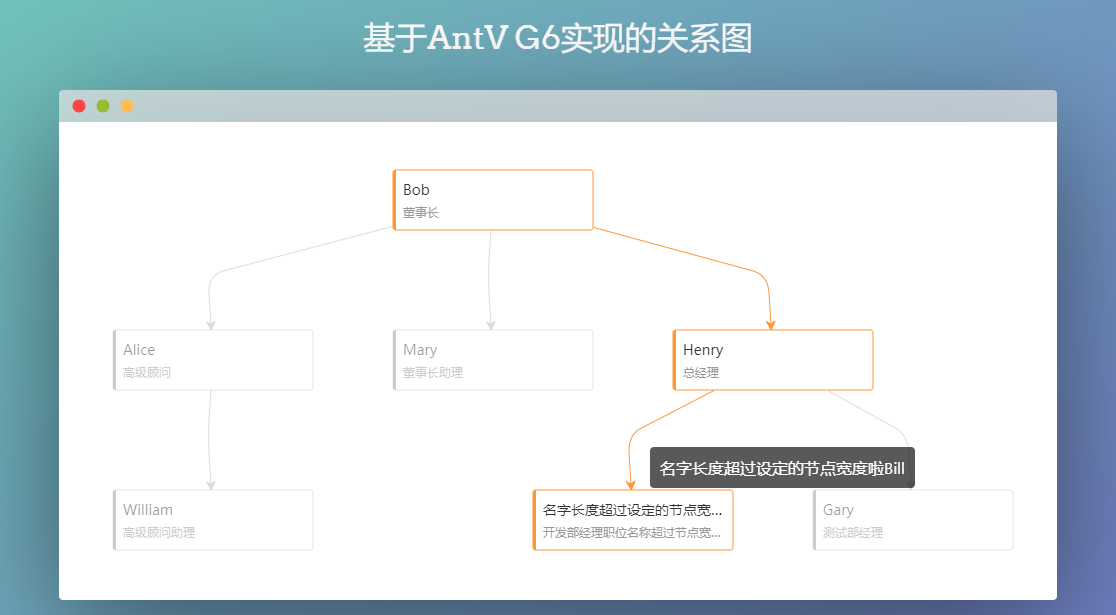
本文将基于React和AntV G6实现一个demo:鼠标经过节点时,可高亮其上下游的关系图。
准备工作
1、使用create-react-app脚手架创建React项目
$ create-react-app antv-demo
2、安装@antv/g6,本demo使用@antv/g6@3.4.8
$ npm i @antv/g6@3.4.8
3、使用
import G6 from '@antv/g6';
Start!GOGOGO
1、数据应由请求返回,简单起见,我们造一个recordLists
/** * 节点的唯一标识为ID,即数据中的upID(上游ID)和_selfID(本节点ID) */this.recordLists = [{"upID": "111","superior": "董事长","superiorName": "Bob","_selfID": "222","_self": "高级顾问","_selfName": "Alice"},{"upID": "111","superior": "董事长","superiorName": "Bob","_selfID": "333","_self": "董事长助理","_selfName": "Mary"},{"upID": "111","superior": "董事长","superiorName": "Bob","_selfID": "444","_self": "总经理","_selfName": "Henry"},{"upID": "222","superior": "高级顾问","superiorName": "upTenant222","_selfID": "555","_self": "高级顾问助理","_selfName": "William"}]
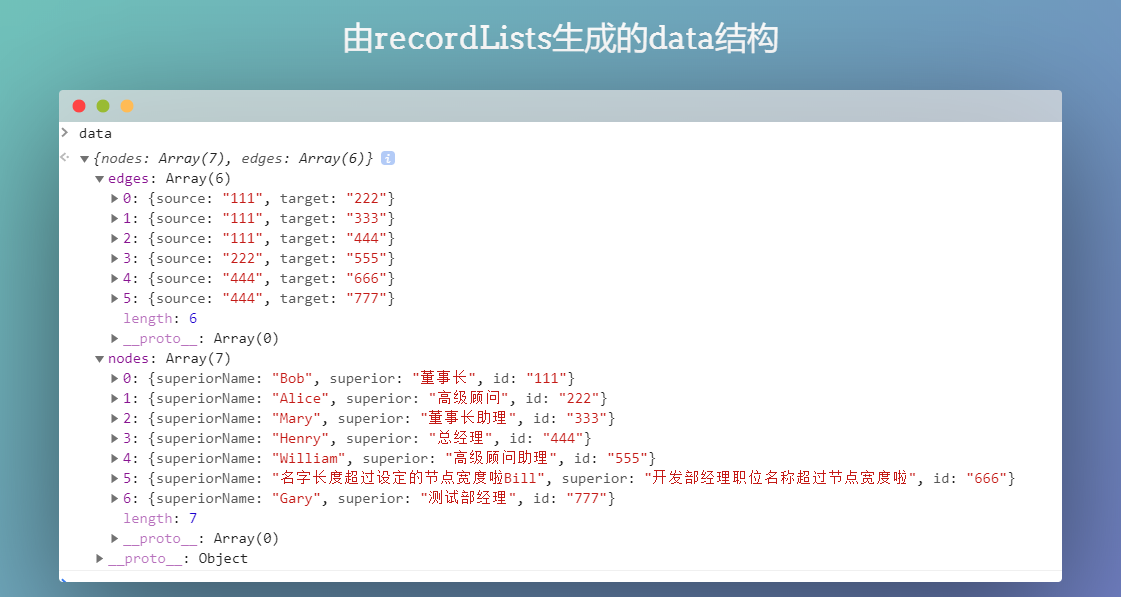
G6需要的数据data包括nodes和edges:
const data = {nodes: [],edges: []};
2、自定义节点
节点中需要显示职位及姓名,所以我们进行节点的自定义,继承基类single-shape。
fittingString 方法处理当文字长度超过节点宽度时,超过文本框的内容使用‘...’
G6.registerNode('relationNode',{drawShape: function drawShape(cfg, group) {const strokeColor = '#CDCDCD';const calcStrLen = str => {let len = 0;for (let i = 0; i < str.length; i++) {if (str.charCodeAt(i) > 0 && str.charCodeAt(i) < 128) {len++;} else {len += 2;}}return len;};const fittingString = (str, maxWidth, fontSize) => {const fontWidth = fontSize * 1.3; // 字号+边距maxWidth = maxWidth * 2; // 需要根据自己项目调整const width = calcStrLen(str) * fontWidth;const ellipsis = '…';if (width > maxWidth) {const actualLen = Math.floor((maxWidth - 10) / fontWidth);const result = str.substring(0, actualLen) + ellipsis;return result;}return str;};const rect = group.addShape('rect', {attrs: {x: -100 + 5,y: -25,width: 200,height: 60,radius: 3,stroke: strokeColor,fill: `l (0) 0:${strokeColor} ` + 0.015 + `:${strokeColor} ` + 0.015 + ':#fff',fillOpacity: 1,lineWidth: 1}});group.addShape('text', {attrs: {x: -95 + 10,y: 3,fill: '#333',text: fittingString(cfg.superiorName, 185, 14),fontSize: 14,fontWeight: 510,isName: true}})group.addShape('text', {attrs: {x: -95 + 10,y: 25,fill: '#999',text: fittingString(cfg.superior, 185, 12),fontSize: 12,fontWeight: 510,isPosition: true}})return rect;}}, 'single-shape');
3、图初始化
const graph = new G6.Graph({//挂载节点container: 'mountNode',width: this.props.width || window.innerWidth,height: this.props.height || window.innerHeight,layout: {type: 'dagre',ranksep: 40,nodesep: 80,controlPoints: true},modes: {default: ['drag-canvas',//可拖拽'zoom-canvas'//可缩放]},defaultNode: {//使用自定义节点type: 'relationNode',labelCfg: {style: {fill: '#666',fontSize: 14,fontWeight: 'bold'}}},defaultEdge: {type: 'polyline',style: {radius: 20,endArrow: {path: 'M 0,0 L 8,4 A 5,5,0,0,1,8,-4 Z',fill: '#ddd'},},},});
4、节点事件绑定
本demo使用的事件:
mouseenter:鼠标移入元素范围内触发,追寻上游和下游节点,并highlight,其余节点置灰;
mousemove:鼠标在元素内部移到时不断触发,若经过的区域为‘职级’或‘姓名’,则弹出tooltip;
mouseout:鼠标移出目标元素后触发,移除tooltip;
mouseleave:鼠标移出元素范围时触发,回到所有节点原始状态。
graph.on('node:mouseenter', ev => {const item = ev.item;const edgeItems = ev.item.getInEdges() || [];const sonEdgeItems = ev.item.getOutEdges() || [];findParents(edgeItems, item, item);//追寻上游节点findSons(sonEdgeItems, item, item);//追寻下游节点graph.setItemState(item, 'highlight', true);graph.update(item, {style: {stroke: '#FD9839',fill: 'l (0) 0:#FD9839 ' + 0.015 + ':#FD9839 ' + 0.015 + ':#fff',cursor: 'pointer',}})changeOthers();//其余节点置灰});graph.on('node:mousemove', (evt) => {const { item, target, x, y } = evt;const {attrs: { isName, isPosition },} = target;const model = item.getModel();const { superiorName, _selfName, superior, _self, id } = model;if (isName || isPosition) {const postion = graph.getClientByPoint(x, y);createTooltip(postion, isName ? superiorName || _selfName : superior || _self, id);} else {removeTooltip(id);}});graph.on('node:mouseout', (evt) => {const { item, target } = evt;const {attrs: { isName, isPosition },} = target;const model = item.getModel();const { id } = model;if (isName || isPosition) {removeTooltip(id);}});graph.on('node:mouseleave', ev => {const item = ev.item;clearStates();graph.setItemState(item, 'highlight', false);graph.update(item, {style: {stroke: '#CDCDCD',fill: 'l (0) 0:#CDCDCD ' + 0.015 + ':#CDCDCD ' + 0.015 + ':#fff',cursor: 'default',fillOpacity: 1}})})
完整 DEMO

若有收获,就点个赞吧
0 人点赞
