gprof
gprof能够让你知道你的代码哪些地方是比较耗时的,哪些函数是被调用次数很多的,并且能够让你一目了然的看到函数与函数之间的调用关系。
gprof是gcc/g++编译器支持的一种 性能诊断工具 。只要在编译时加上 -pg 选项,编译器就会在编译程序时在每个函数的开头加一个mcount函数调用,在每一个函数调用之前都会先调用这个mcount函数,在mcount中会保存函数的调用关系图和函数的调用时间和被调次数等信息。最终在程序退出时保存在gmon.out文件中,需要注意的是程序必须是正常退出或者通过exit调用退出,因为只要在 exit() 被调用时才会触发程序写gmon.out文件。
使用方法
Step1:将 -pg 作为编译选项,并添加在最后
Step2:运行程序并正常退出。
Step3:查看gmon.out文件 (gprof -b ./hello gmon.out)
#include <stdio.h>static void my_print (char *);static void my_print2 (const char *);main (){char my_string[] = "hello world!";my_print (my_string);my_print2 (my_string);my_print (my_string);}void count_sum(){int i,sum=0;for(i=0; i<10000000; i++)sum += i;}void my_print (char *string){count_sum();printf ("The string is %s ", string);}void my_print2 (const char *string){char *string2;int size, i,sum =0;count_sum();size = strlen(string);string2 = (char *) malloc (size + 1);for (i = 0; i < size; i++) string2[size -1 - i] = string;string2[size] = '\0';for(i=0; i<50000000; i++)sum += i;printf ("The string printed backward is %s ", string2);}
$gcc -pg -o hello hello.c
$./hello
$gprof hello
## Result part 1
Flat profile:
Each sample counts as 0.01 seconds.
% cumulative self  self  total
time seconds seconds calls us/call us/call name
69.23 0.09 0.09 1 90000.00 103333.33 my_print2
30.77 0.13 0.04 3 13333.33 13333.33 count_sum
0.00 0.13 0.00 2 0.00 13333.33 my_print
每行代表一个函数的信息
报告的标题是由两行组成,上下相组合形成完整的字段
% time: 表示该函数占整个程序的执行时间的百分比 (不含其调用函数的执行时间)
cumulative seconds: 该函数总的执行时间。(包括函数调用其他函数所花费的时间)
self seconds: 执行函数所花费的时间。(调用其他函数的花费不会被计算在内,仅一次执行)
self calls: 该函数被调用起来的次数
self us/call: 调用此函数所花费的时间
total us/call: 调用此函数所花费的总体时间
name: 函数名
part2
Call graph (explanation follows)
granularity: each sample hit covers 2 byte(s) for 3.95% of 0.25 seconds
index %time  self  children    called     name
                                                 <spontaneous>
[1]    100.0    0.00    0.25                 main [1]
                    0.16    0.03       1/1           my_print2 [2]
                    0.00    0.06       2/2           my_print [4]
-----------------------------------------------
                   0.16    0.03       1/1           main [1]
[2]     76.0    0.16    0.03       1         my_print2 [2]
                   0.03    0.00       1/3           count_sum [3]
-----------------------------------------------
                   0.03    0.00       1/3           my_print2 [2]
                   0.06    0.00       2/3           my_print [4]
[3]     36.0    0.09    0.00       3         count_sum [3]
-----------------------------------------------
                   0.00    0.06       2/2           main [1]
[4]     24.0    0.00    0.06       2         my_print [4]
                   0.06    0.00       2/3           count_sum [3]
-----------------------------------------------
- 对于这个表(函数调用图),这个表描述了程序的函数调用关系,根据调用时间的大小对函数以及它的孩子们进行排序。
- 对于这个表中的每一条记录(共4条记录),每条记录包含若干行。
- 对于每一条记录中的行
- 每一条记录中有一行(在最左面一列)被标上了index号,这一行的name列的函数就代表了本记录的当前函数;
- 每条记录内代表本记录函数的行之上的所有行,其name列的函数都是直接父函数(调用当前记录的函数的函数);
- 每条记录内代表本记录函数的行之下的所有行,其name列的函数都是直接子函数(被当前记录的函数调用的函数)。
- 每一列,对于每一条记录来说的含义如下:
- index
代表表中每一条记录的唯一的数字(键),标在该记录当前的函数所在行,根据数字大小顺序依次排列;
另外,每一个name列处的函数名字后面也紧跟着一个index号,代表该name的函数是属于哪个index值记录的当前函数。 - % time
代表记录中当前行函数及其所有子孙(待理解?)孩子们所消耗的时间占程序总时间的百分比,由于有些函数被排除或者其他原因可能总和不是100%. - self
对于记录中当前函数行来说,代表执行本函数所消耗的时间(不包含它的所有子函数)。
对于记录中当前行上面行(父函数)来说,代表本函数返回到父函数花费了(父函数)多久的时间(不包括本函数的子函数所消耗的时间)。
对于记录中当前行下面行(子函数)来说,代表子函数返回到本函数花费了(本函数)多久的时间(不包括子函数的子函数所消耗的时间)。 - children
对于记录中当前函数行来说,代表本函数的所有子孙(待理解?)函数返回到本函数所消耗(本函数)的时间。
对于记录中当前行上面行(父函数)来说,代表本函数所有子孙(待理解?)返回到父函数,子孙们(待理解?)消耗(父函数)的时间。
对于记录中当前行下面行(子函数)来说,代表子函数所有子孙(待理解?)返回到本函数,那些子孙(待理解?)消耗(本函数)的时间。 - called
对于记录中当前函数行来说,代表本函数被调用的次数,如果是递归函数则是非递归部分次数跟一个’+’号接递归调用次数。
对于记录中当前行上面行(父函数)来说,’/‘左面代表该父函数调用该函数次数,’/‘右面代表该函数总共被调用次数。
对于记录中当前行下面行(子函数)来说,’/‘左面代表该函数调用该子函数次数,’/‘右面代表该子函数总共被调用次数。 - name
对于记录中当前函数行来说,代表当前函数名加上其所属记录的index号,若该函数是某调用环一员,则环号放在函数名和index号之间。
对于记录中当前行上面行(父函数)来说,代表父函数名加其记录的index号,若父函数是某调用环一员,则环号放在父函数和index号之间。如果函数的父函数无法确定,那么在name字段打印一个`’字符,并且所有其它字段为空(例如第一行)。
对于记录中当前行下面行(子函数)来说,代表子函数名加其记录的index号,若子函数是某调用环一员,则环号放在子函数和index号之间。
- index
Gperftools
性能测试工具
#include <google/profiler.h>
#include <iostream>
using namespace std;
void func1() {
    int i = 0;
    while (i < 100000) {
        ++i;
    }
}
void func2() {
    int i = 0;
    while (i < 200000) {
        ++i;
    }
}
void func3() {
    for (int i = 0; i < 1000; ++i) {
        func1();
        func2();
    }
}
int main(){
    ProfilerStart("my.prof"); // 指定所生成的profile文件名
    func3();
    ProfilerStop(); // 结束profiling
    ProfilerStop();
    return 0;
}
g++ -o demo demo.cpp -lprofiler -lunwind
pprof --text ./demo my.prof > output.txt
pprof --pdf ./demo my.prof > output.pdf
查看分析结果,程序是122个时间样本,其中,func1()是40个时间样本,约为400毫秒;func2()是82个时间样本,约为820毫秒。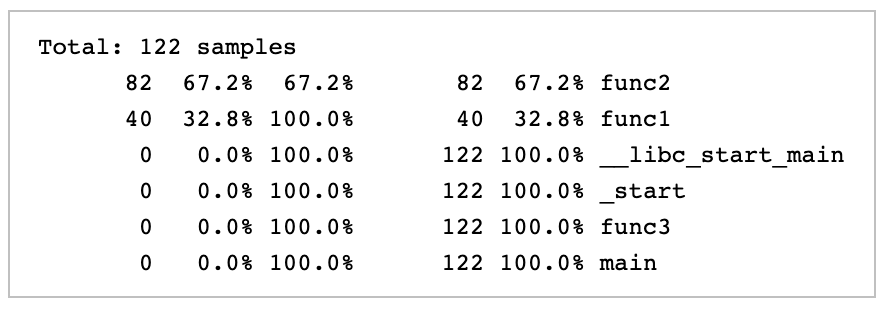
Reference
https://zhuanlan.zhihu.com/p/150527364
https://blog.csdn.net/10km/article/details/83820080
https://www.cnblogs.com/caosiyang/archive/2013/01/25/2876244.html
https://github.com/gperftools/gperftools/blob/master/benchmark/malloc_bench.cc

若有收获,就点个赞吧
0 人点赞
