在golang中用来做监控分析的库包,一般用都是pprof库包… pprof可以在两个地方引入:
其实net/http/pprof中只是使用runtime/pprof包来进行封装了一下,并在http端口上暴露出来。 runtime/pprof可以用来产生dump文件,再使用go tool pprof来分析这运行日志.
使用net/http/pprof可以做到直接看到当前web服务的状态,包括CPU占用情况和内存使用情况等。
这次重点说些pprof web显示的模式,我自己主要是关注heap,profile两个数据源。
关于golang运行环境heap的信息、内存mem等:http://localhost:7777/debug/pprof/heap
关于profile、CPU计算百分比等:http://localhost:7777/debug/pprof/profile
上面简单介绍了pprof的监控接口,但怎么查看这些数据? 有这么几个查看方式.
交互模式, 可以通过用help查看pprof各种命令。 每次运行后拿到的数据是固定的,不会动态更新该数据。
如果你不想使用交互模式,当然这每次都是新数据:
网页查看模式: http://localhost:7777/debug/pprof/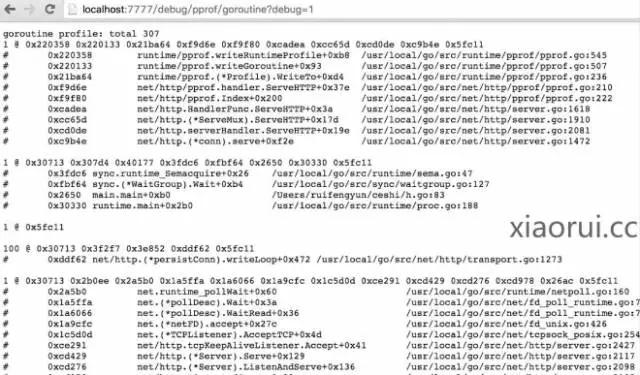
下面是我随便写的一段伪业务代码. 大家可以长时间运行这段代码,会发现内存在缓慢的增长中.
#xiaorui.ccpackage mainimport ("flag""fmt""io/ioutil""log""net/http"_ "net/http/pprof""sync""time")func counter() {list := []int{1}c := 1for i := 0; i < 10000000; i++ {httpGet()c = i + 1 + 2 + 3 + 4 - 5list = append(list, c)}fmt.Println(c)fmt.Println(list[0])}func work(wg *sync.WaitGroup) {for {counter()time.Sleep(1 * time.Second)}wg.Done()}func httpGet() int {queue := []string{"start..."}resp, err := http.Get("http://www.163.com")if err != nil {// handle error}//defer resp.Body.Close()body, err := ioutil.ReadAll(resp.Body)if err != nil {// handle error}queue = append(queue, string(body))return len(queue)}func main() {flag.Parse()//这里实现了远程获取pprof数据的接口go func() {log.Println(http.ListenAndServe("localhost:7777", nil))}()var wg sync.WaitGroupwg.Add(10)for i := 0; i < 100; i++ {go work(&wg)}wg.Wait()time.Sleep(3 * time.Second)}
下面是pprof统计的heaq信息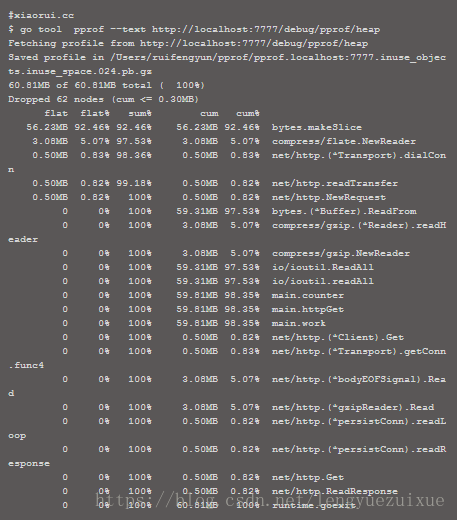
另外需要说的一点,pprof可以生成一个svg的矢量图,可以通过这svg图确认代码的流程及调用情况. svg是使用graphviz生成的,mac下直接brew install graphviz就能安装,centos下,yum -y install graphviz .
下面是pprof help的使用文档.
#xiaorui.cc$ go tool pprof http://localhost:6060/debug/pprof/heapFetching profile from http://localhost:6060/debug/pprof/heapSaved profile in /Users/ruifengyun/pprof/pprof.localhost:6060.inuse_objects.inuse_space.032.pb.gzEntering interactive mode (type "help" for commands)(pprof) helpCommands:cmd [n] [--cum] [focus_regex]* [-ignore_regex]*Produce a text report with the top n entries.Include samples matching focus_regex, and exclude ignore_regex.Add --cum to sort using cumulative data.Available commands:callgrind Outputs a graph in callgrind formatdisasm Output annotated assembly for functions matching regexp or addressdot Outputs a graph in DOT formateog Visualize graph through eogevince Visualize graph through evincegif Outputs a graph image in GIF formatgv Visualize graph through gvlist Output annotated source for functions matching regexppdf Outputs a graph in PDF formatpeek Output callers/callees of functions matching regexppng Outputs a graph image in PNG formatproto Outputs the profile in compressed protobuf formatps Outputs a graph in PS formatraw Outputs a text representation of the raw profilesvg Outputs a graph in SVG formattags Outputs all tags in the profiletext Outputs top entries in text formtop Outputs top entries in text formtree Outputs a text rendering of call graphweb Visualize graph through web browserweblist Output annotated source in HTML for functions matching regexp or addresspeek func_regexDisplay callers and callees of functions matching func_regex.dot [n] [focus_regex]* [-ignore_regex]* [>file]Produce an annotated callgraph with the top n entries.Include samples matching focus_regex, and exclude ignore_regex.For other outputs, replace dot with:- Graphic formats: dot, svg, pdf, ps, gif, png (use > to name output file)- Graph viewer: gv, web, evince, eogcallgrind [n] [focus_regex]* [-ignore_regex]* [>file]Produce a file in callgrind-compatible format.Include samples matching focus_regex, and exclude ignore_regex.weblist func_regex [-ignore_regex]*Show annotated source with interspersed assembly in a web browser.list func_regex [-ignore_regex]*Print source for routines matching func_regex, and exclude ignore_regex.disasm func_regex [-ignore_regex]*Disassemble routines matching func_regex, and exclude ignore_regex.tags tag_regex [-ignore_regex]*List tags with key:value matching tag_regex and exclude ignore_regex.quit/exit/^DExit pprof.option=valueThe following options can be set individually:cum/flat: Sort entries based on cumulative or flat datacall_tree: Build context-sensitive call treesnodecount: Max number of entries to displaynodefraction: Min frequency ratio of nodes to displayedgefraction: Min frequency ratio of edges to displayfocus/ignore: Regexp to include/exclude samples by name/filetagfocus/tagignore: Regexp or value range to filter samples by tageg "1mb", "1mb:2mb", ":64kb"functions: Level of aggregation for sample datafiles:lines:addresses:unit: Measurement unit to use on reportsSample value selection by index:sample_index: Index of sample value to displaymean: Average sample value over first valueSample value selection by name:alloc_space for heap profilesalloc_objectsinuse_spaceinuse_objectstotal_delay for contention profilesmean_delaycontentions: Clear focus/ignore/hide/tagfocus/tagignore(pprof)
根据pprof的统计信息我们可以找到CPU过度计算及内存泄露的大概的点。 现在越来越觉得Golang gc有些让人摸不清头脑. 看来有必要深入学习Golang gc垃圾回收原理.


若有收获,就点个赞吧
0 人点赞
