1. 性能分析工具
graphviz windows安装
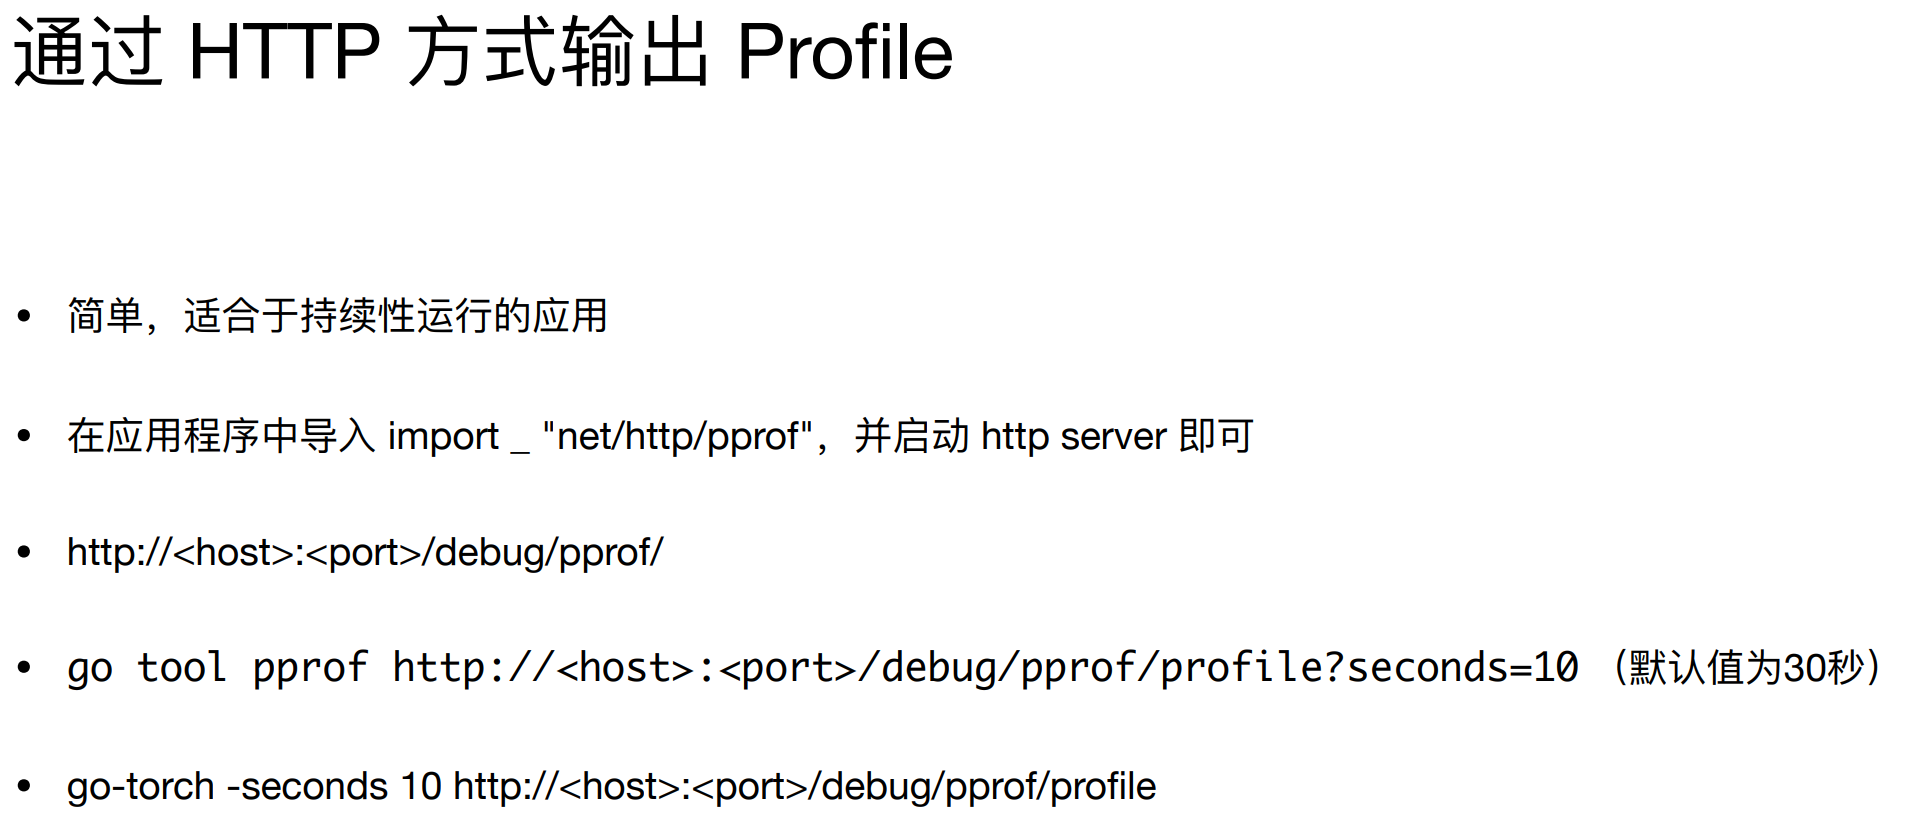
graphviz-install-5.0.0-win64.zip 安装完成后,需要把文件夹中的文件拷贝到自己本地的GOPATH目录下。(我的:D:\GoPackage) go get github.com/uber/go-torch


go tool pprof .\cpu.prof
Type: cpuTime: Aug 10, 2022 at 7:48pm (CST)Duration: 1.32s, Total samples = 750ms (56.65%)Entering interactive mode (type "help" for commands, "o" for options)
go tool pprof prof .\cpu.prof
prof: open prof: The system cannot find the file specified.Fetched 1 source profiles out of 2Type: cpuTime: Aug 10, 2022 at 7:48pm (CST)Duration: 1.32s, Total samples = 750ms (56.65%)Entering interactive mode (type "help" for commands, "o" for options)
top
# flat 函数执行时间及所占比例Showing top 10 nodes out of 13flat flat% sum% cum cum%410ms 54.67% 54.67% 490ms 65.33% math/rand.(*Rand).Int31n200ms 26.67% 81.33% 720ms 96.00% main.fillMatrix60ms 8.00% 89.33% 60ms 8.00% math/rand.(*rngSource).Uint64 (inline)30ms 4.00% 93.33% 520ms 69.33% math/rand.(*Rand).Intn20ms 2.67% 96.00% 20ms 2.67% main.calculate (inline)10ms 1.33% 97.33% 80ms 10.67% math/rand.(*Rand).Int31 (inline)10ms 1.33% 98.67% 70ms 9.33% math/rand.(*rngSource).Int6310ms 1.33% 100% 10ms 1.33% runtime/pprof.(*profMap).lookup0 0% 100% 740ms 98.67% main.main0 0% 100% 70ms 9.33% math/rand.(*Rand).Int63 (inline)
list fillMatrix
Total: 750msROUTINE ======================== main.fillMatrix in D:\JetbrainsCode\Learn_Go\go-learning\src\ch40\tools\file\prof.go200ms 720ms (flat, cum) 96.00% of Total. . 15:). . 16:. . 17:func fillMatrix(m *[row][col]int) {. . 18: s := rand.New(rand.NewSource(time.Now().UnixNano())). . 19:10ms 10ms 20: for i := 0; i < row; i++ {20ms 20ms 21: for j := 0; j < col; j++ {170ms 690ms 22: m[i][j] = s.Intn(100000). . 23: }. . 24: }. . 25:}. . 26:. . 27:func calculate(m *[row][col]int) {
svg 生成svg图片

go tool pprof prof .\mem.prof top list main.main
Total: 4.22MBROUTINE ======================== main.main in D:\JetbrainsCode\Learn_Go\go-learning\src\ch40\tools\file\prof.go0 1.72MB (flat, cum) 40.76% of Total. . 39: if err != nil {. . 40: log.Fatal("could not create CPU profile: ", err). . 41: }. . 42:. . 43: // 获取系统信息. 1.72MB 44: if err := pprof.StartCPUProfile(f); err != nil { //监控cpu. . 45: log.Fatal("could not start CPU profile: ", err). . 46: }. . 47: defer pprof.StopCPUProfile(). . 48:. . 49: // 主逻辑区,进行一些简单的代码运算

go-torch 试了一个多小时,还是不行,略过…

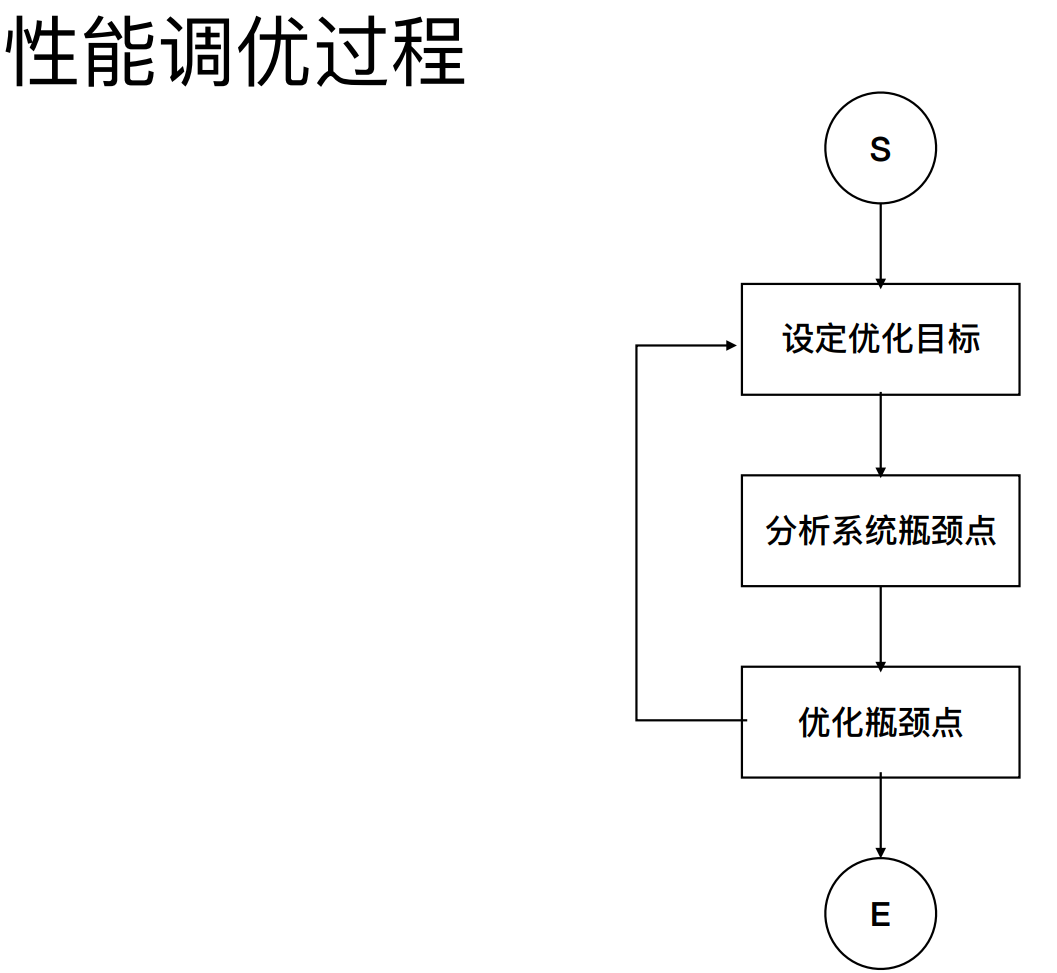
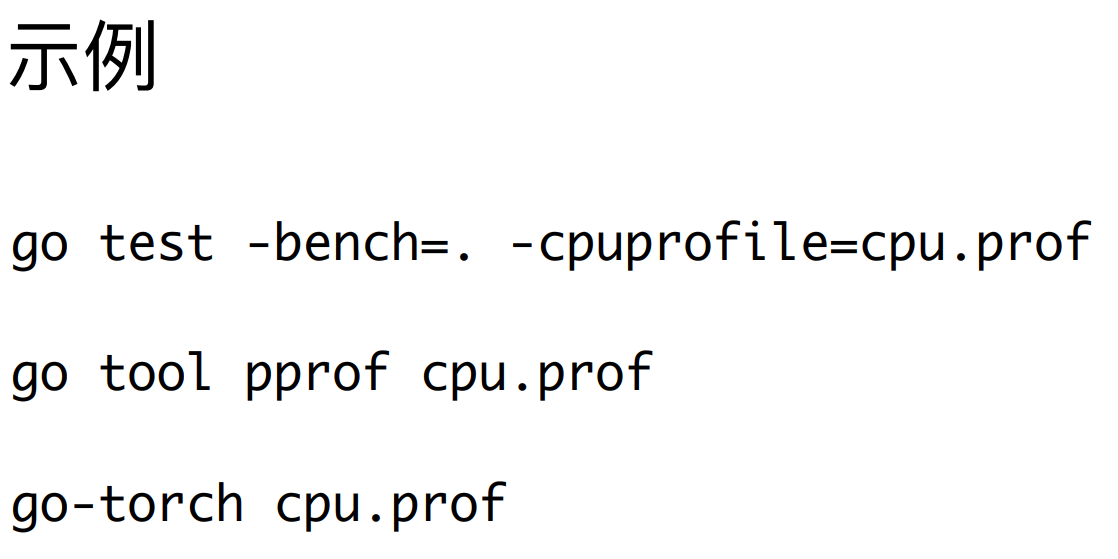
2. 性能调优示例
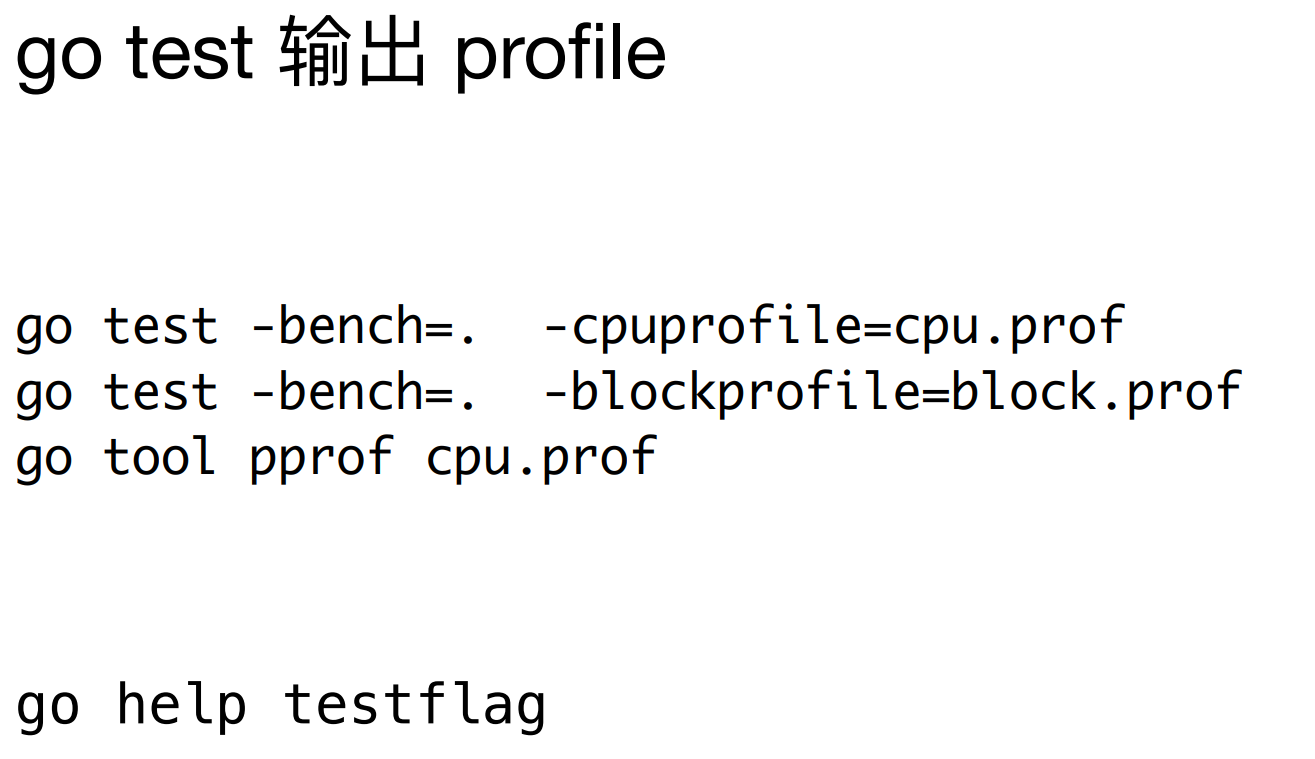
go test -bench=”.” -cpuprofile=”cpu.prof”
goos: windowsgoarch: amd64pkg: go-learning/src/ch41cpu: Intel(R) Core(TM) i5-8265U CPU @ 1.60GHzBenchmarkProcessRequest-8 183476 6594 ns/opBenchmarkProcessRequestOld-8 59528 19808 ns/opPASSok go-learning/src/ch41 2.912s
go tool pprof .\cpu.prof
Type: cpuTime: Aug 11, 2022 at 11:13am (CST)Duration: 2.85s, Total samples = 2.15s (75.50%)Entering interactive mode (type "help" for commands, "o" for options)
top
Showing nodes accounting for 900ms, 41.86% of 2150ms totalDropped 67 nodes (cum <= 10.75ms)Showing top 10 nodes out of 131flat flat% sum% cum cum%130ms 6.05% 6.05% 240ms 11.16% github.com/mailru/easyjson/jlexer.(*Lexer).FetchToken110ms 5.12% 11.16% 350ms 16.28% runtime.concatstrings110ms 5.12% 16.28% 190ms 8.84% strconv.ParseInt100ms 4.65% 20.93% 100ms 4.65% runtime.memmove90ms 4.19% 25.12% 280ms 13.02% runtime.mallocgc80ms 3.72% 28.84% 640ms 29.77% go-learning/src/ch41.easyjson6a975c40DecodeGoLearningSrcCh41180ms 3.72% 32.56% 80ms 3.72% strconv.ParseUint70ms 3.26% 35.81% 70ms 3.26% runtime.stdcall270ms 3.26% 39.07% 70ms 3.26% runtime.stdcall360ms 2.79% 41.86% 120ms 5.58% encoding/json.checkValid
top -cum
Showing nodes accounting for 0.09s, 4.19% of 2.15s totalDropped 67 nodes (cum <= 0.01s)Showing top 10 nodes out of 131flat flat% sum% cum cum%0 0% 0% 1.59s 73.95% testing.(*B).launch0 0% 0% 1.59s 73.95% testing.(*B).runN0 0% 0% 0.88s 40.93% go-learning/src/ch41.BenchmarkProcessRequestOld0 0% 0% 0.88s 40.93% go-learning/src/ch41.processRequestOld0 0% 0% 0.71s 33.02% go-learning/src/ch41.BenchmarkProcessRequest0.01s 0.47% 0.47% 0.71s 33.02% go-learning/src/ch41.processRequest0 0% 0.47% 0.64s 29.77% go-learning/src/ch41.(*Request).UnmarshalJSON (partial-inline)0.08s 3.72% 4.19% 0.64s 29.77% go-learning/src/ch41.easyjson6a975c40DecodeGoLearningSrcCh4110 0% 4.19% 0.51s 23.72% runtime.systemstack0 0% 4.19% 0.38s 17.67% encoding/json.Unmarshal
list processRequest
Total: 2.15sROUTINE ======================== go-learning/src/ch41.processRequest in D:\JetbrainsCode\Learn_Go\go-learning\src\ch41\optmization.go10ms 710ms (flat, cum) 33.02% of Total. . 21:. . 22:func processRequest(reqs []string) []string {. . 23: reps := []string{}. . 24: for _, req := range reqs {. . 25: reqObj := &Request{}. 470ms 26: reqObj.UnmarshalJSON([]byte(req)). . 27: // json.Unmarshal([]byte(req), reqObj). . 28:. . 29: var buf strings.Builder10ms 10ms 30: for _, e := range reqObj.PayLoad {. 100ms 31: buf.WriteString(strconv.Itoa(e)). 10ms 32: buf.WriteString(","). . 33: }. . 34: repObj := &Response{reqObj.TransactionID, buf.String()}. 100ms 35: repJson, err := repObj.MarshalJSON(). . 36: //repJson, err := json.Marshal(&repObj). . 37: if err != nil {. . 38: panic(err). . 39: }. 20ms 40: reps = append(reps, string(repJson)). . 41: }. . 42: return reps. . 43:}. . 44:. . 45:func processRequestOld(reqs []string) []string {. 380ms 49: json.Unmarshal([]byte(req), reqObj). . 50: ret := "". . 51: for _, e := range reqObj.PayLoad {. 370ms 52: ret += strconv.Itoa(e) + ",". . 53: }. . 54: repObj := &Response{reqObj.TransactionID, ret}. 130ms 55: repJson, err := json.Marshal(&repObj). . 56: if err != nil {. . 57: panic(err). . 58: }. . 59: reps = append(reps, string(repJson)). . 60: }
easyjson -all structs.go go test -bench=”.” -memprofile=”mem.prof”
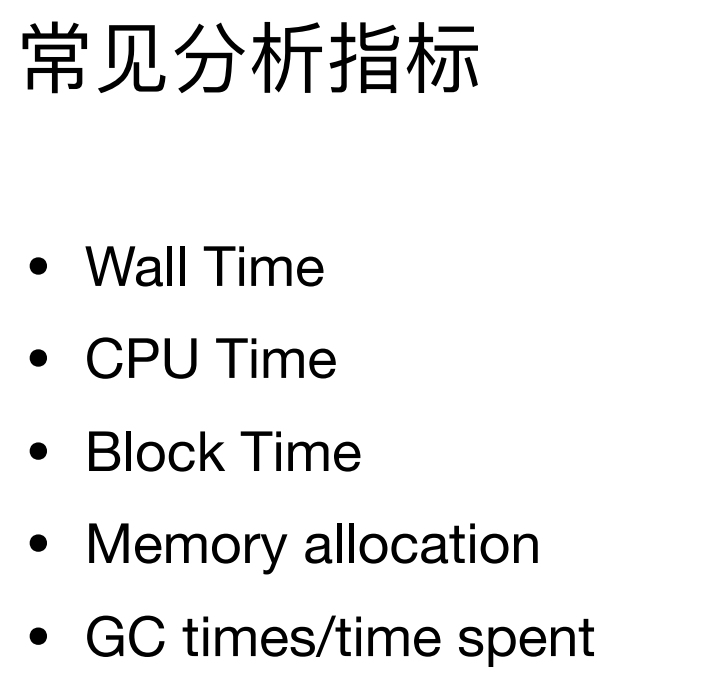
Wall Time 挂钟时间, 你的程序运行的绝对时间和某个函数运行的绝对时间,其中有可能有阻塞。调用外部系统,等待外部响应,这些会影响你的绝对时间 CPU Time CPU消耗时间,包括内存分配,GC次数,GC的耗时
Block Time Memory allocation GC times/time spent
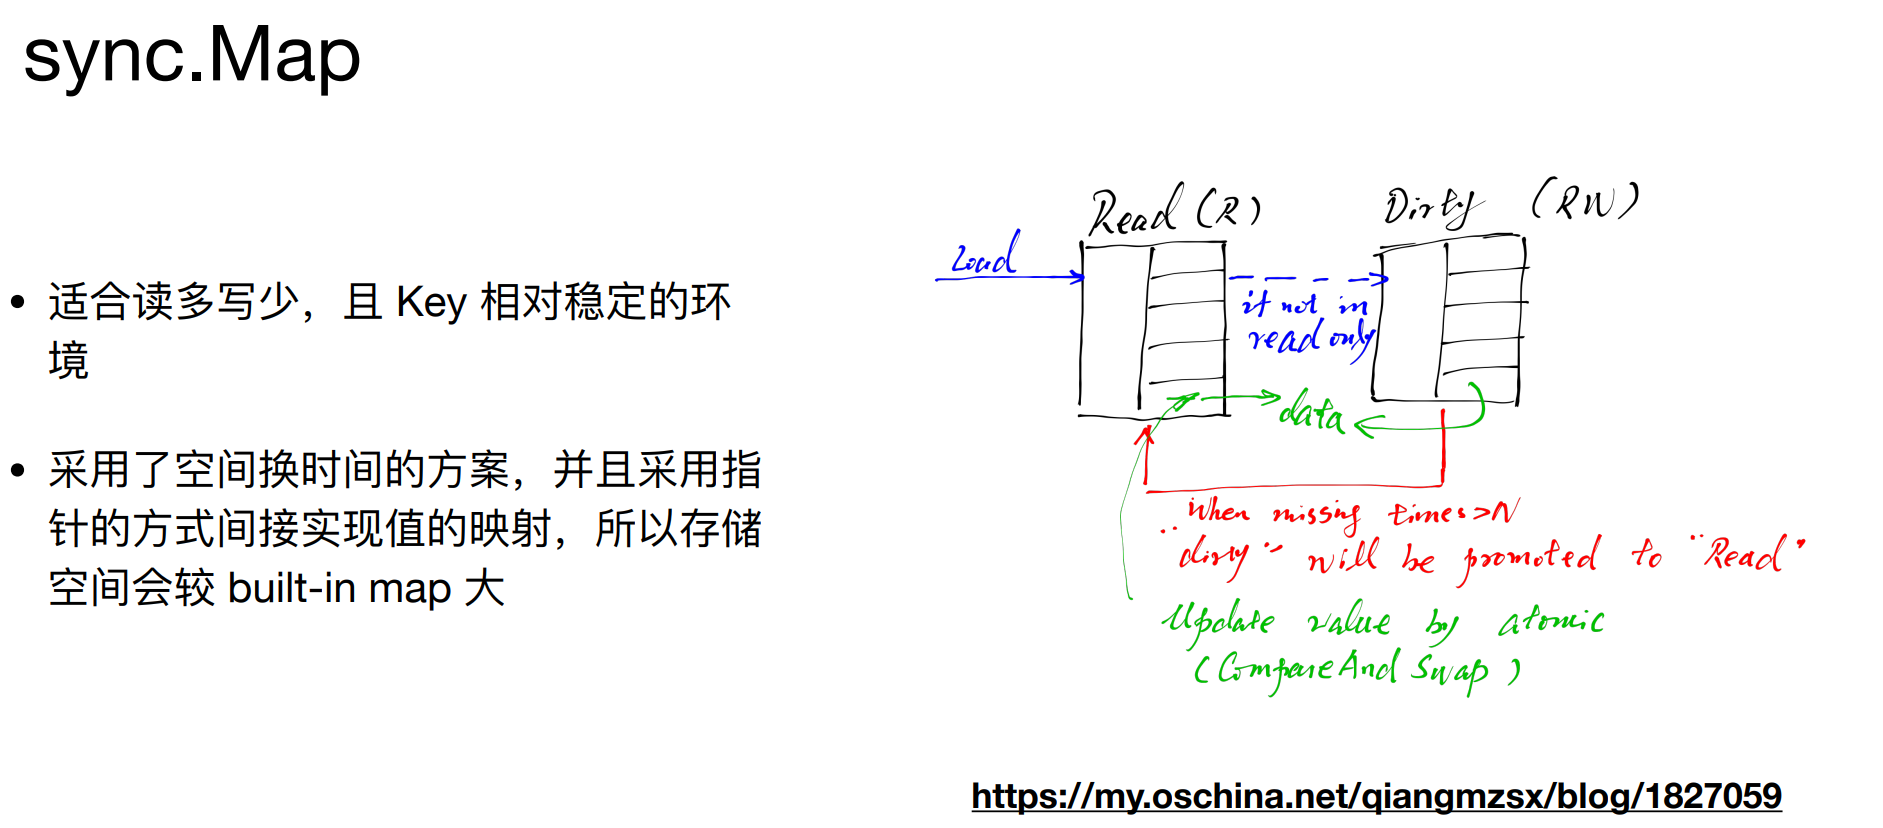
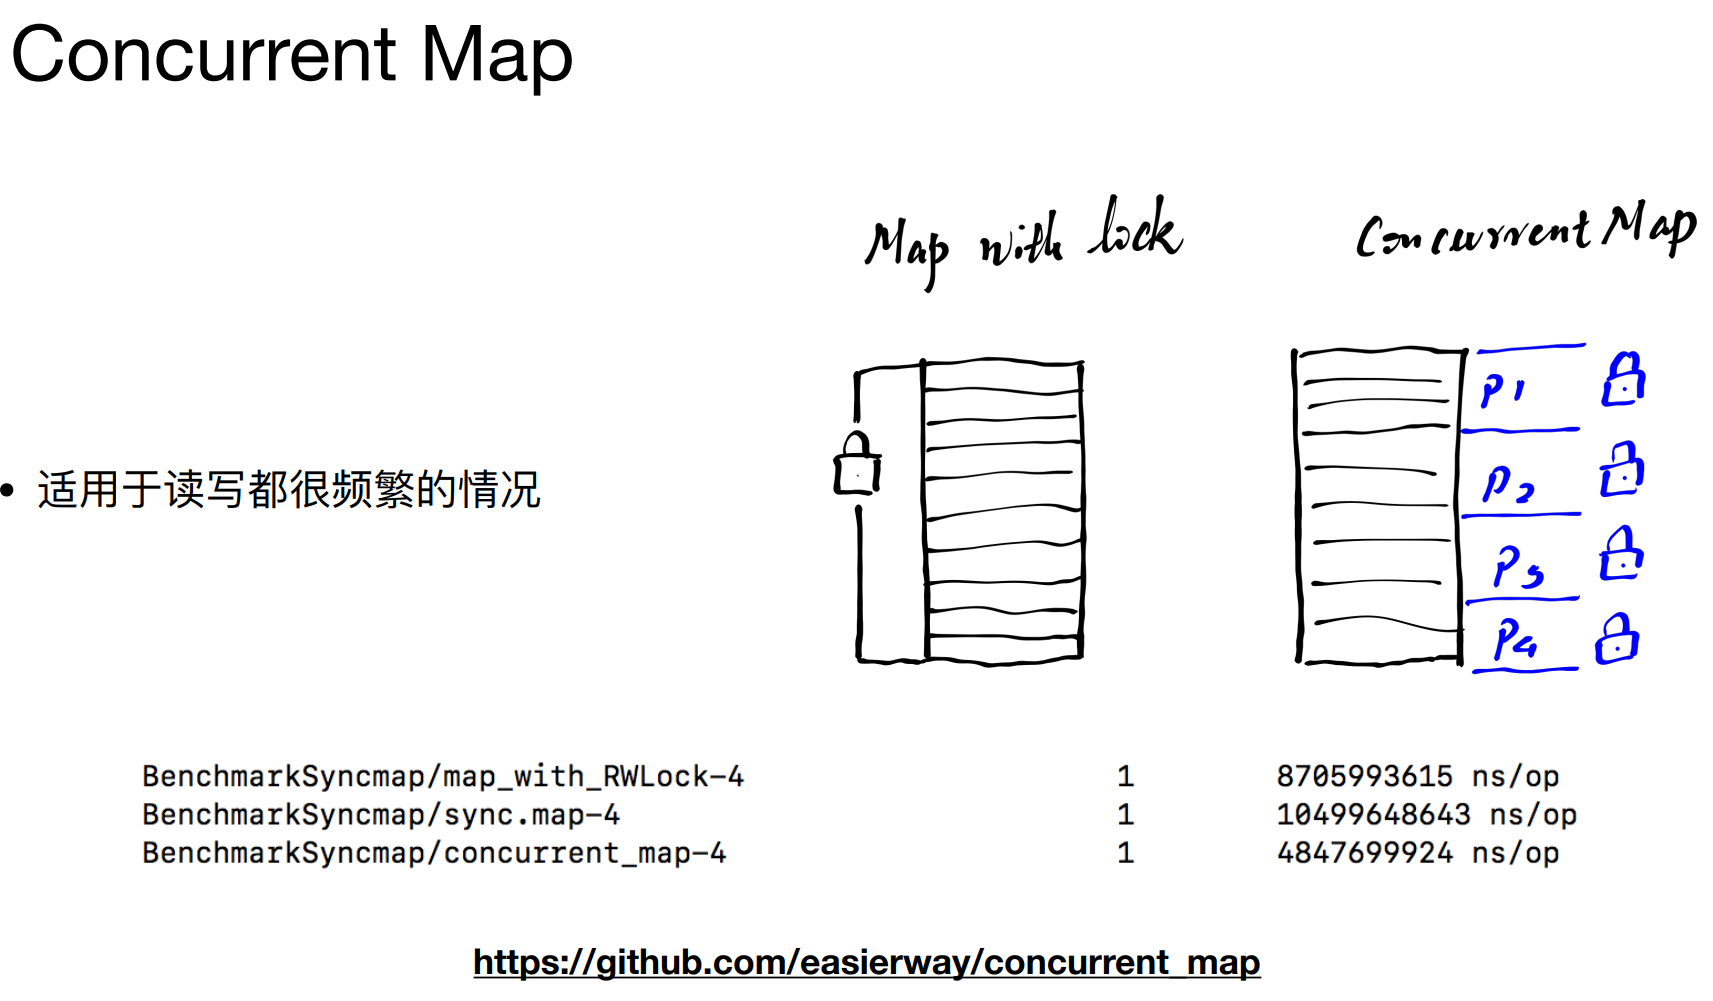
3. 别让性能被锁住
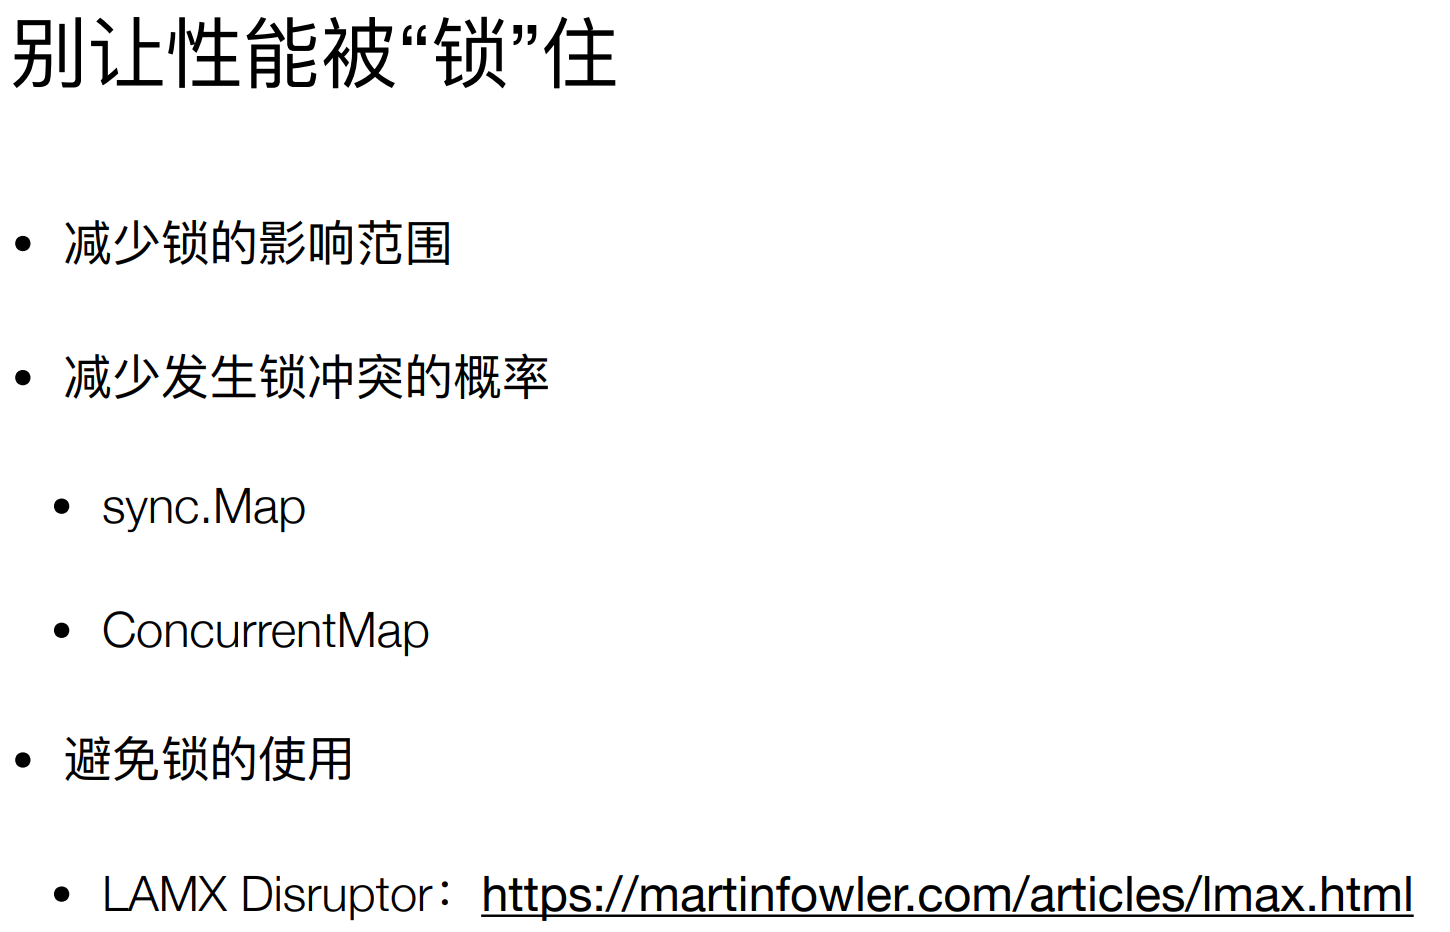
Disruptor
4. GC友好的代码

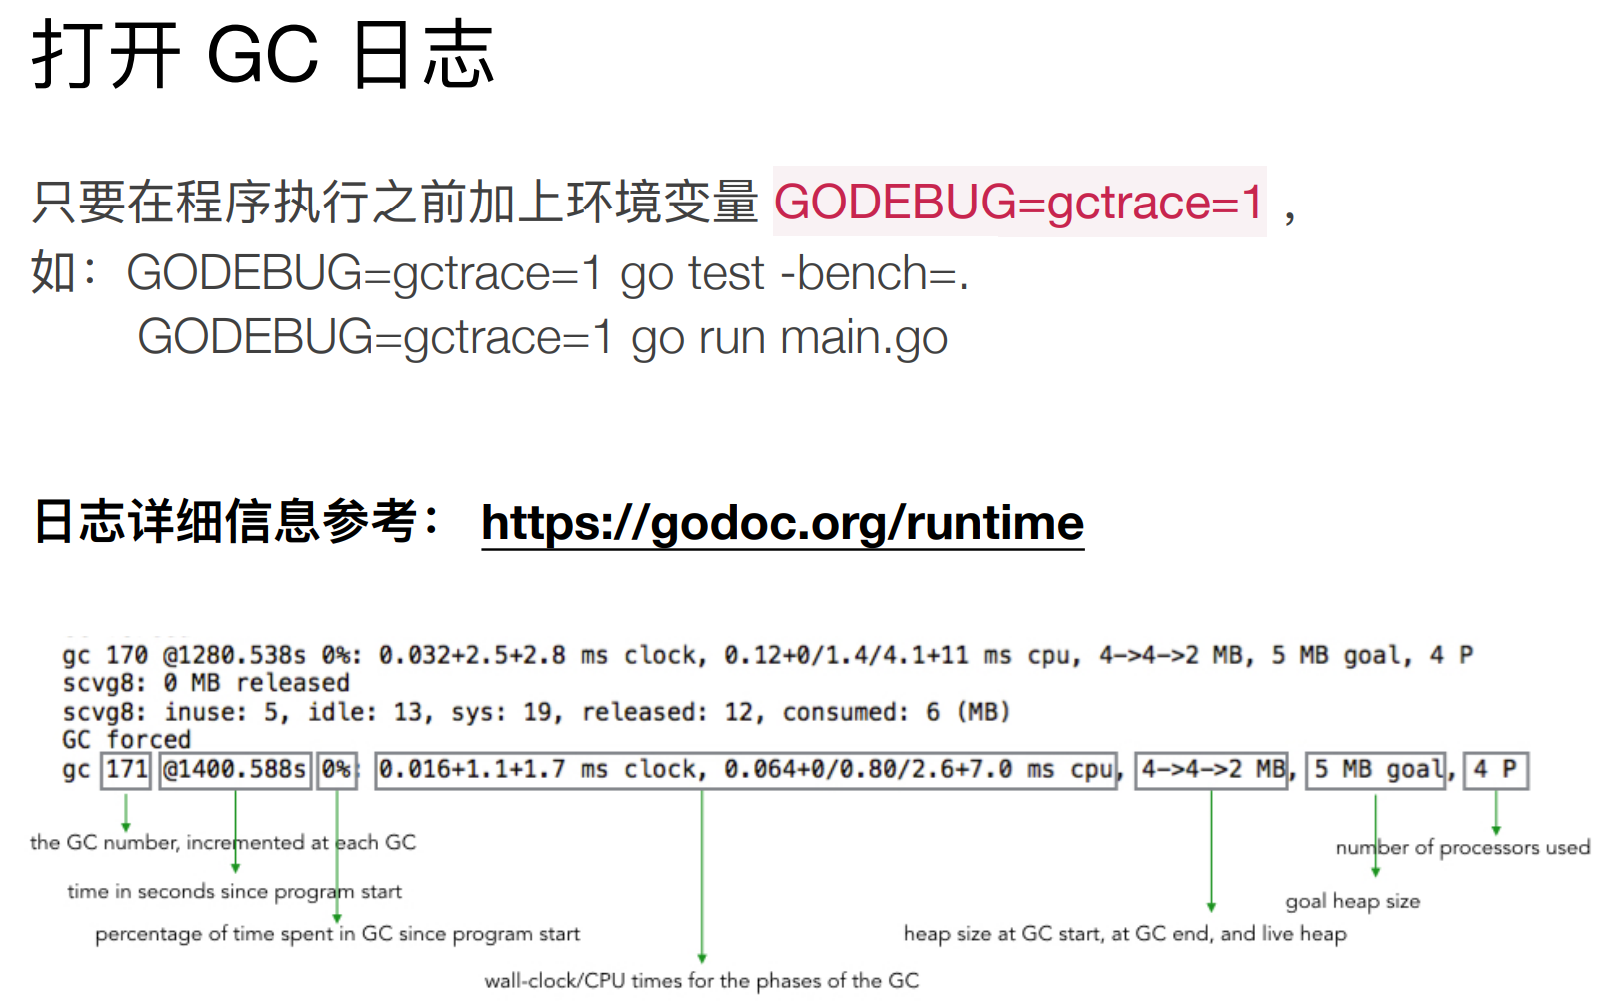
GODEBUG=gctrace=1 go test -bench=”BenchmarkPassingArrayWithValue” 无法使用 go test -bench=”BenchmarkPassingArrayWithValue” “-trace=trace_val.out”
goos: windowsgoarch: amd64pkg: go-learning/src/ch43/gc_friendly/passing_refcpu: Intel(R) Core(TM) i5-8265U CPU @ 1.60GHzBenchmarkPassingArrayWithValue-8 85 12794193 ns/opPASSok go-learning/src/ch43/gc_friendly/passing_ref 1.216s
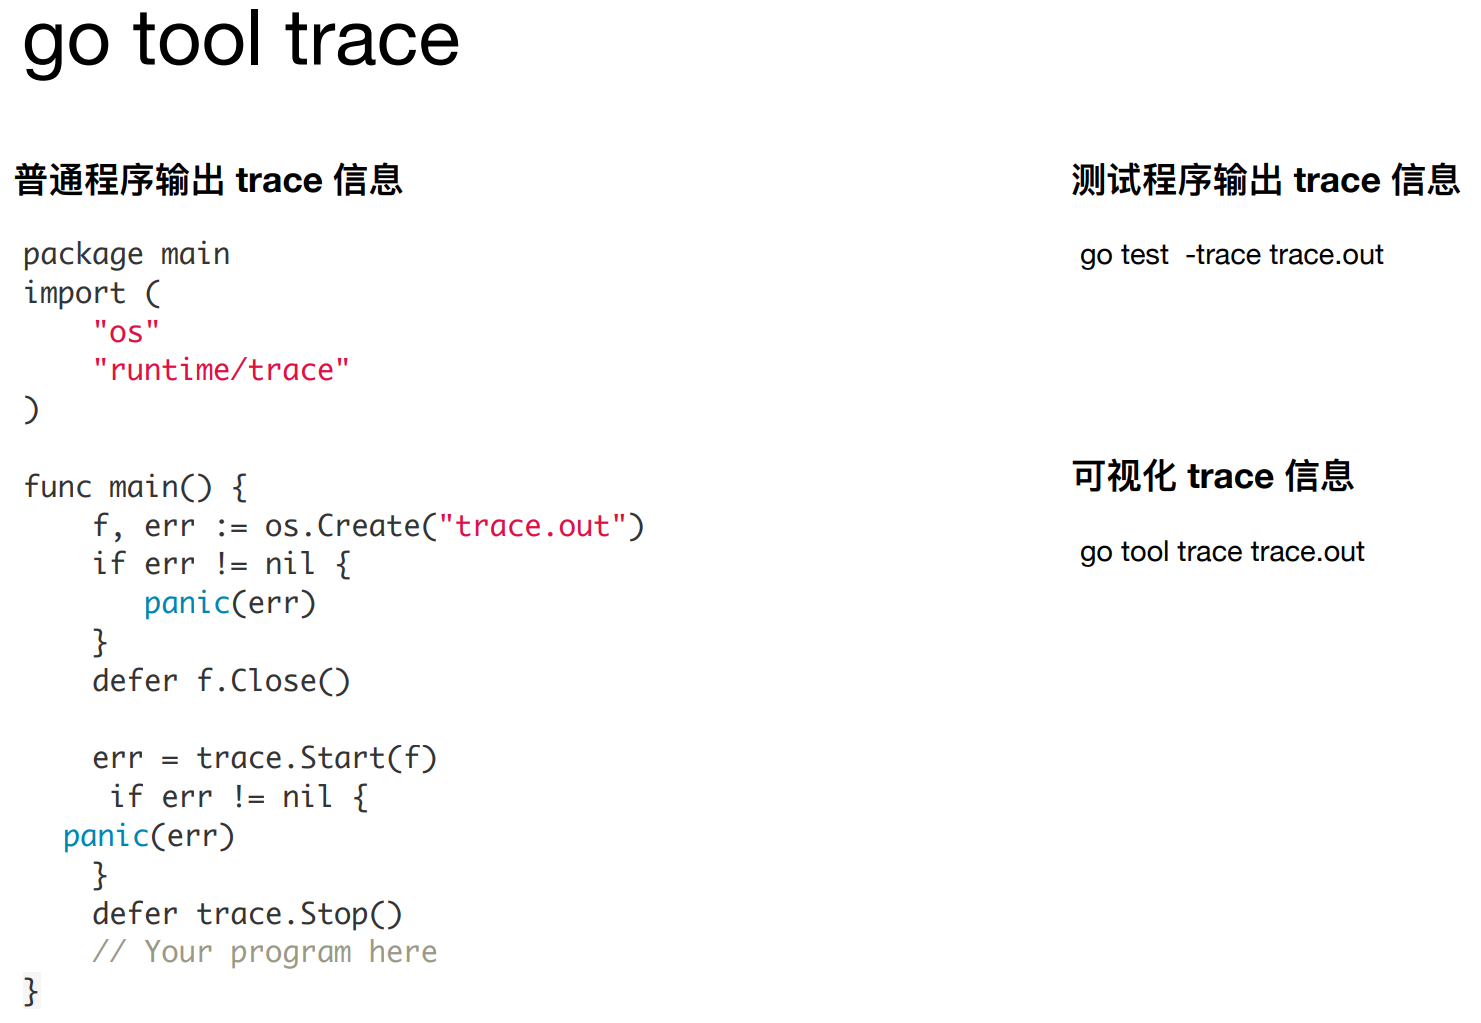
go test -bench=”BenchmarkPassingArrayWithValue” “-trace=trace_ref.out”
goos: windowsgoarch: amd64pkg: go-learning/src/ch43/gc_friendly/passing_refcpu: Intel(R) Core(TM) i5-8265U CPU @ 1.60GHzBenchmarkPassingArrayWithValue-8 85 13425085 ns/opPASSok go-learning/src/ch43/gc_friendly/passing_ref 1.311s
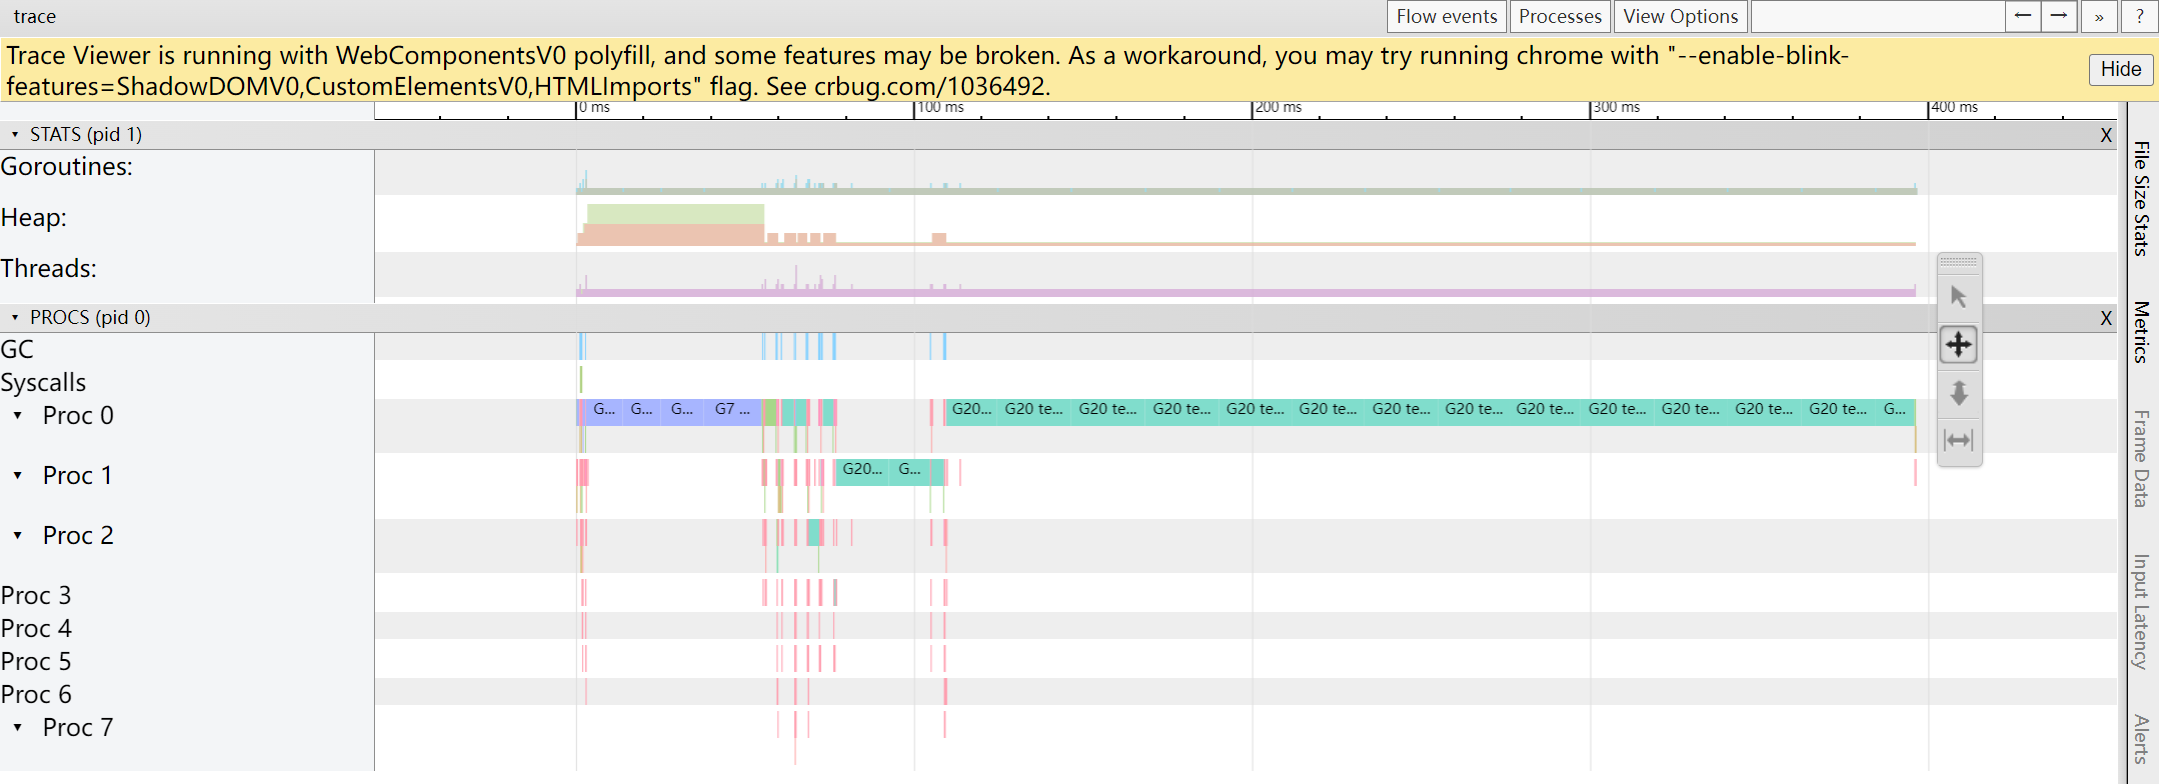
go tool trace .\trace_ref.out
2022/08/11 12:24:34 Parsing trace...2022/08/11 12:24:34 Splitting trace...2022/08/11 12:24:34 Opening browser. Trace viewer is listening on http://127.0.0.1:7042此时会跳出一个网页页面


若有收获,就点个赞吧
0 人点赞
