重采样及频率转换
- 重采样(resampling)指的是将时间序列从一个频率转换到另一个频率的处理过程。是对原样本重新处理的一个方法,是一个对常规时间序列数据重新采样和频率转换的便捷的方法。
- 将高频率数据聚合到低频率称为降采样(downsampling)
- 而将低频率数据转换到高频率则称为升采样(upsampling)
主要参数说明。
rule : DateOffset, Timedelta or str
表示重采样频率,例如‘M’、‘5min’,Second(15)
how : str
用于产生聚合值的函数名或数组函数,例如’mean’、’ohlc’、’np.max’等,默认是’mean’,其他常用的值由:’first’、’last’、’median’、’max’、’min’
axis : {0 or ‘index’, 1 or ‘columns’}, default 0
默认是纵轴,横轴设置axis=1
fillmethod : _str, default None
升采样时如何插值,比如ffill、bfill等
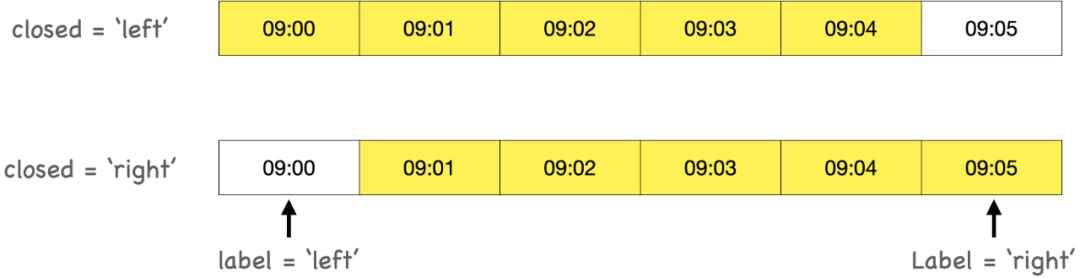
closed : {‘right’, ‘left’}, default None
在降采样时,各时间段的哪一段是闭合的,’right’或’left’,默认’right’
label : {‘right’, ‘left’}, default None
在降采样时,如何设置聚合值的标签,例如,9:30-9:35会被标记成9:30还是9:35,默认9:35
convention : {‘start’, ‘end’, ‘s’, ‘e’}, default ‘start’
当重采样时期时,将低频率转换到高频率所采用的约定(’start’或’end’)。默认’end’
kind : {‘timestamp’, ‘period’}, optional, default None
聚合到时期(’period’)或时间戳(’timestamp’),默认聚合到时间序列的索引类型
loffset : timedelta, default None
面元标签的时间校正值,比如’-1s’或Second(-1)用于将聚合标签调早1秒
limit : int, default None
在向前或向后填充时,允许填充的最大时期数
>>> rng = pd.date_range('2000-01-01', periods=100, freq='D')>>> ts = pd.Series(np.random.randn(len(rng)), index=rng)>>> ts2000-01-01 -0.1844152000-01-02 -0.0780492000-01-03 1.5501582000-01-04 0.2064982000-01-05 0.184059...2000-04-05 -0.5742072000-04-06 -1.7195872000-04-07 0.1406732000-04-08 -1.2341462000-04-09 -0.835341Freq: D, Length: 100, dtype: float64
pandas对象都带有一个**resample**方法,它是各种频率转换工作的主力函数。**resample**有一个类似于**groupby**的API,调用**resample**可以分组数据,然后会调用一个聚合函数:
>>> ts.resample('M').mean()2000-01-31 0.0534762000-02-29 -0.2507082000-03-31 -0.0540462000-04-30 -0.479965Freq: M, dtype: float64>>> ts.resample('M', kind='period').mean()2000-01 0.0534762000-02 -0.2507082000-03 -0.0540462000-04 -0.479965Freq: M, dtype: float64
降采样
在用resample对数据进行降采样时,需要考虑两样东西:
- 各区间哪边是闭合的。
- 如何标记各个聚合面元,用区间的开头还是末尾。
# 首先创造一个9:00到9:05分到时期区间>>> rng = pd.date_range('2020-01-01 9:00:00', periods=6, freq='T')>>> ts = pd.Series(np.arange(6), index=rng)>>> ts2020-01-01 09:00:00 02020-01-01 09:01:00 12020-01-01 09:02:00 22020-01-01 09:03:00 32020-01-01 09:04:00 42020-01-01 09:05:00 5Freq: T, dtype: int64# 通过时间重采用五分钟聚合>>> ts.resample('5min').sum()>>> ts.resample('5min', closed = 'left').sum()>>> ts.resample('5min', closed = 'left',label = 'left').sum() # 默认2020-01-01 09:00:00 102020-01-01 09:05:00 5Freq: 5T, dtype: int64# closed='right', label='left' 右闭合。但标签需要取最左边即09:00:00>>> ts.resample('5min', closed = 'right').sum()>>> ts.resample('5min', closed = 'right', label = 'left').sum()2020-01-01 08:55:00 02020-01-01 09:00:00 15Freq: 5T, dtype: int64>>> ts.resample('5min', closed = 'right', label = 'right').sum()2020-01-01 09:00:00 02020-01-01 09:05:00 15Freq: 5T, dtype: int64>>> ts.resample('5min', closed = 'left',label = 'right').sum()2020-01-01 09:05:00 102020-01-01 09:10:00 5Freq: 5T, dtype: int64
比如从右边界减去一秒以便更容易明白该时间戳到底表示的是哪个区间。只需通过loffset设置一个字符串或日期偏移量即可实现这个目的。
>>> ts.resample('5min', closed = 'right', label = 'right').sum()2020-01-01 09:00:00 02020-01-01 09:05:00 15Freq: 5T, dtype: int64>>> ts.resample('5min', closed='right',label='right', loffset='1s').sum()2020-01-01 09:00:01 02020-01-01 09:05:01 15dtype: int64>>> ts.resample('5min', closed='left',label='right', loffset='-1s').sum()2020-01-01 09:04:59 102020-01-01 09:09:59 5dtype: int64>>> ts2020-01-01 09:00:00 02020-01-01 09:01:00 12020-01-01 09:02:00 22020-01-01 09:03:00 32020-01-01 09:04:00 42020-01-01 09:05:00 5Freq: T, dtype: int64
OHLC重采样
open high low close
# ts.resample('5min',how = 'ohlc')ts.resample('5min').ohlc()
| open | high | low | close | |
|---|---|---|---|---|
| 2020-01-01 09:00:00 | 0 | 4 | 0 | 4 |
| 2020-01-01 09:05:00 | 5 | 5 | 5 | 5 |
升采样和插值
时间戳 重采样
In
frame = pd.DataFrame(np.random.randn(2, 4),index=pd.date_range('1/1/2000', periods=2, freq='W-WED'),columns=['Colorado', 'Texas', 'New York', 'Ohio'])frame
Out
| Colorado | Texas | New York | Ohio | |
|---|---|---|---|---|
| 2000-01-05 | 0.899396 | 0.300839 | -0.108393 | -1.199599 |
| 2000-01-12 | -0.809829 | 0.127997 | -0.535350 | 0.230481 |
In
df_daily = frame.asfreq('D') # asfreq方法转换成高频,不经过聚df_daily
Out
| Colorado | Texas | New York | Ohio | |
|---|---|---|---|---|
| 2000-01-05 | 0.899396 | 0.300839 | -0.108393 | -1.199599 |
| 2000-01-06 | NaN | NaN | NaN | NaN |
| 2000-01-07 | NaN | NaN | NaN | NaN |
| 2000-01-08 | NaN | NaN | NaN | NaN |
| 2000-01-09 | NaN | NaN | NaN | NaN |
| 2000-01-10 | NaN | NaN | NaN | NaN |
| 2000-01-11 | NaN | NaN | NaN | NaN |
| 2000-01-12 | -0.809829 | 0.127997 | -0.535350 | 0.230481 |
In
df_daily = frame.resample('D').asfreq() # asfreq方法转换成高频,不经过聚df_daily
Out
| Colorado | Texas | New York | Ohio | |
|---|---|---|---|---|
| 2000-01-05 | 0.899396 | 0.300839 | -0.108393 | -1.199599 |
| 2000-01-06 | NaN | NaN | NaN | NaN |
| 2000-01-07 | NaN | NaN | NaN | NaN |
| 2000-01-08 | NaN | NaN | NaN | NaN |
| 2000-01-09 | NaN | NaN | NaN | NaN |
| 2000-01-10 | NaN | NaN | NaN | NaN |
| 2000-01-11 | NaN | NaN | NaN | NaN |
| 2000-01-12 | -0.809829 | 0.127997 | -0.535350 | 0.230481 |
**resampling**的填充和插值方式跟**fillna**和**reindex**的一样
In
frame.resample('D').ffill()
Out
| Colorado | Texas | New York | Ohio | |
|---|---|---|---|---|
| 2000-01-05 | 0.899396 | 0.300839 | -0.108393 | -1.199599 |
| 2000-01-06 | 0.899396 | 0.300839 | -0.108393 | -1.199599 |
| 2000-01-07 | 0.899396 | 0.300839 | -0.108393 | -1.199599 |
| 2000-01-08 | 0.899396 | 0.300839 | -0.108393 | -1.199599 |
| 2000-01-09 | 0.899396 | 0.300839 | -0.108393 | -1.199599 |
| 2000-01-10 | 0.899396 | 0.300839 | -0.108393 | -1.199599 |
| 2000-01-11 | 0.899396 | 0.300839 | -0.108393 | -1.199599 |
| 2000-01-12 | -0.809829 | 0.127997 | -0.535350 | 0.230481 |
In
frame.resample('D').ffill(limit = 2) # 可以只填充指定的时期数(目的是限制前面的观测值的持续使用距离):
Out
| Colorado | Texas | New York | Ohio | |
|---|---|---|---|---|
| 2000-01-05 | 0.899396 | 0.300839 | -0.108393 | -1.199599 |
| 2000-01-06 | 0.899396 | 0.300839 | -0.108393 | -1.199599 |
| 2000-01-07 | 0.899396 | 0.300839 | -0.108393 | -1.199599 |
| 2000-01-08 | NaN | NaN | NaN | NaN |
| 2000-01-09 | NaN | NaN | NaN | NaN |
| 2000-01-10 | NaN | NaN | NaN | NaN |
| 2000-01-11 | NaN | NaN | NaN | NaN |
| 2000-01-12 | -0.809829 | 0.127997 | -0.535350 | 0.230481 |
时期 重采样
由于时期指的是时间区间,所以升采样和降采样的规则就比较严格:
- 在降采样中,目标频率必须是源频率的子时期(subperiod)。
- 在升采样中,目标频率必须是源频率的超时期(superperiod)。
In
frame = pd.DataFrame(np.random.randn(24, 4),index=pd.period_range('1-2000', '12-2001',freq='M'),columns=['Colorado', 'Texas', 'New York', 'Ohio'])frame.head()
Out
| Colorado | Texas | New York | Ohio | |
|---|---|---|---|---|
| 2000-01 | -0.913994 | 0.735676 | -1.497775 | 1.959656 |
| 2000-02 | 0.128110 | -0.029472 | 0.146246 | 0.686848 |
| 2000-03 | 2.293743 | 2.841931 | 0.260844 | -0.177066 |
| 2000-04 | -0.878366 | 0.715225 | 0.791772 | 0.775475 |
| 2000-05 | -0.234892 | 1.247728 | -0.611274 | 0.778219 |
降采样
In
annual_frame = frame.resample('A-DEC').mean()annual_frame
Out
| Colorado | Texas | New York | Ohio | |
|---|---|---|---|---|
| 2000 | 0.035481 | 0.434428 | -0.152062 | 0.246267 |
| 2001 | 0.204250 | -0.264691 | -0.074159 | 0.182459 |
升采样
升采样要稍微麻烦一些,因为必须决定在新频率中各区间的哪端用于放置原来的值,就像asfreq方法那样。convention参数默认为'start',也可设置为'end'
In
q_frame = annual_frame.resample('Q-DEC').ffill()q_frame
Out
| Colorado | Texas | New York | Ohio | |
|---|---|---|---|---|
| 2000Q1 | 0.035481 | 0.434428 | -0.152062 | 0.246267 |
| 2000Q2 | 0.035481 | 0.434428 | -0.152062 | 0.246267 |
| 2000Q3 | 0.035481 | 0.434428 | -0.152062 | 0.246267 |
| 2000Q4 | 0.035481 | 0.434428 | -0.152062 | 0.246267 |
| 2001Q1 | 0.204250 | -0.264691 | -0.074159 | 0.182459 |
| 2001Q2 | 0.204250 | -0.264691 | -0.074159 | 0.182459 |
| 2001Q3 | 0.204250 | -0.264691 | -0.074159 | 0.182459 |
| 2001Q4 | 0.204250 | -0.264691 | -0.074159 | 0.182459 |
In
annual_frameq_frame = annual_frame.resample('Q-DEC', convention = 'end').ffill()q_frame
Out1
| Colorado | Texas | New York | Ohio | |
|---|---|---|---|---|
| 2000 | 0.035481 | 0.434428 | -0.152062 | 0.246267 |
| 2001 | 0.204250 | -0.264691 | -0.074159 | 0.182459 |
Out2
| Colorado | Texas | New York | Ohio | |
|---|---|---|---|---|
| 2000Q4 | 0.035481 | 0.434428 | -0.152062 | 0.246267 |
| 2001Q1 | 0.035481 | 0.434428 | -0.152062 | 0.246267 |
| 2001Q2 | 0.035481 | 0.434428 | -0.152062 | 0.246267 |
| 2001Q3 | 0.035481 | 0.434428 | -0.152062 | 0.246267 |
| 2001Q4 | 0.204250 | -0.264691 | -0.074159 | 0.182459 |

若有收获,就点个赞吧
0 人点赞
