时间序列
首先导入需要用到的包
import pandas as pdimport numpy as np
| 时间类型 | Python中的类型 |
|---|---|
| 时间戳 | timestamp |
| 时间间隔 | timedelta |
| 时期 | period |
pd.Period()构造时期
时期(period)表示的是时间区间,比如数日、数月、数季、数年等。
>>> import pandas as pd# Period类所表示的就是这种数据类型,其构造函数需要用到一个字符串或整数>>> p = pd.Period('2010',freq = 'A-DEC')>>> p# 这个Period对象表示的是从2010年1月1日到2010年12月31日之间的整段时间Period('2010', 'A-DEC')# 只需对Period对象加上或减去一个整数即可达到根据其频率进行位移的>>> p + 5Period('2015', 'A-DEC')>>> p - 4Period('2006', 'A-DEC')# 如果两个Period对象拥有相同频率,则它们的差就是它们之间的单位数量>>> pd.Period('2015',freq='A-DEC') - p5
pd.period_range()构造时期范围
period_range函数可用于创建规则的时期范围:
>>> rng = pd.period_range('2012-1-1','2012-6-30',freq = 'M')>>> rngPeriodIndex(['2012-01', '2012-02', '2012-03', '2012-04', '2012-05', '2012-06'], dtype='period[M]', freq='M')# PeriodIndex类保存了一组Period,它可以在任何pandas数据结构中被用作轴索引>>> ped = pd.Series(np.random.randn(len(rng)), index = rng)>>> ped2012-01 -2.4119632012-02 0.8931002012-03 1.4382092012-04 0.1937472012-05 -1.4695312012-06 0.943145Freq: M, dtype: float64>>> ped.indexPeriodIndex(['2012-01', '2012-02', '2012-03', '2012-04', '2012-05', '2012-06'], dtype='period[M]', freq='M')
使用PeriodIndex类将一个字符串数组转换为一段时期
# PeriodIndex类的构造函数允许直接使用一组字符串表示一段时期>>> values =['2010Q1','2010Q2','2010Q3']>>> index = pd.PeriodIndex(values,freq = 'Q-DEC')>>> indexPeriodIndex(['2010Q1', '2010Q2', '2010Q3'], dtype='period[Q-DEC]', freq='Q-DEC')
时间的频率转换
Period和PeriodIndex对象都可以通过其asfreq方法被转换成别的频率
一个年度时期,希望将其转换为当年年初或年末的一个月度时期
>>> p = pd.Period('2012',freq = 'A-DEC')>>> pPeriod('2012', 'A-DEC')>>> p.asfreq('M',how = 'start')Period('2012-01', 'M')>>> p.asfreq('Q','End')Period('2012Q4', 'Q-DEC')
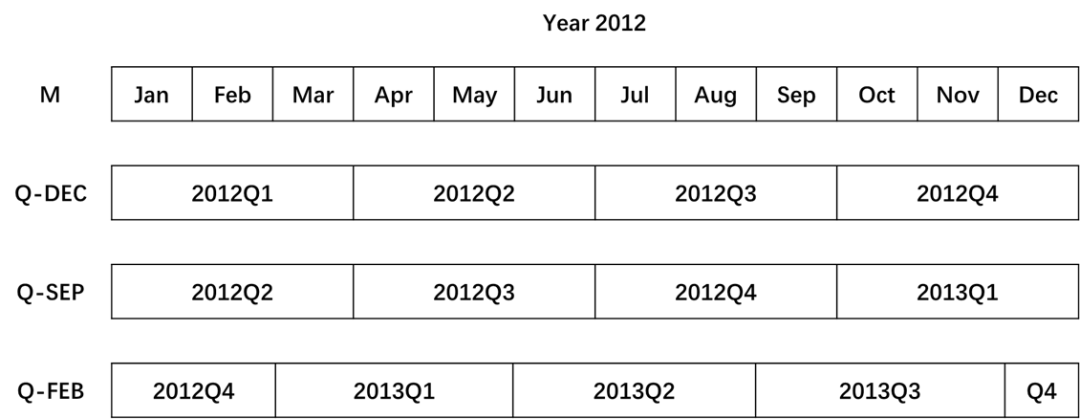
可以将Period('2012','A-DEC')看做一个被划分为多个月度时期的时间段中的游标。下图对此进行了说明在将高频率转换为低频率时,超时期(superperiod)是由子时期(subperiod)所属的位置决定的。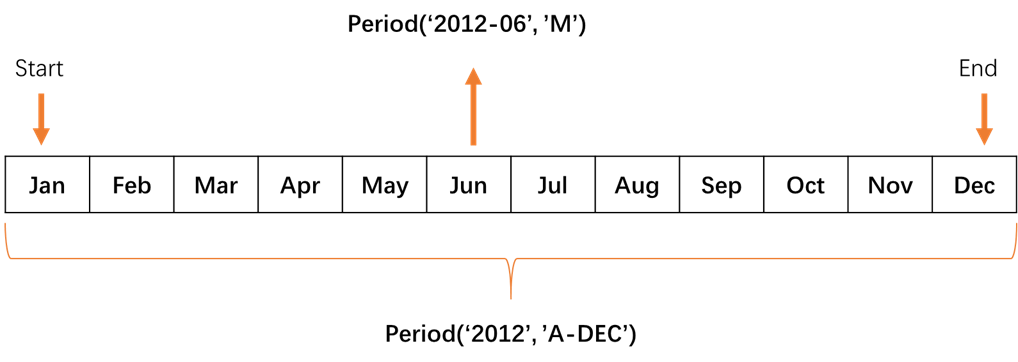
在A-JUN频率中,月份”2007年8月”实际上是属于周期”2008年”的:
>>> p = pd.Period('Aug-2007', freq = 'M')>>> pPeriod('2007-08', 'M')>>> p.asfreq('A-JUN')Period('2008', 'A-JUN')
完整的PeriodIndex或TimeSeries的频率转换方式相同
>>> rng = pd.period_range('2001','2008', freq = 'A-DEC')>>> ts = pd.Series(np.random.randn(len(rng)), index = rng)>>> ts2001 0.8595002002 -1.2132562003 -0.5910232004 -0.3933172005 1.0159042006 0.2783102007 1.8601362008 0.119815Freq: A-DEC, dtype: float64
根据年度时期的第一个月,每年的时期被取代为每月的时期。
ts.asfreq('M',how = 'start')2001-01 0.8595002002-01 -1.2132562003-01 -0.5910232004-01 -0.3933172005-01 1.0159042006-01 0.2783102007-01 1.8601362008-01 0.119815Freq: M, dtype: float64
每年的最后一个工作日,可以使用”B”频率,并指明想要该时期的末尾
ts.asfreq('B',how = 'end')2001-12-31 0.8595002002-12-31 -1.2132562003-12-31 -0.5910232004-12-31 -0.3933172005-12-30 1.0159042006-12-29 0.2783102007-12-31 1.8601362008-12-31 0.119815Freq: B, dtype: float64
按季度计算的时期频率
季度型数据
许多季度型数据都会涉及”财年末”,通常是一年12个月的最后一个日历日或工作日。时期”2012Q4”根据财年末的不同会有不同含义。
>>> p = pd.Period('2012Q4',freq = 'Q-FEB') # Q-FEB是指2月末的工作日是财政年末>>> pPeriod('2012Q4', 'Q-FEB')>>> p.asfreq('D','start')Period('2011-12-01', 'D')>>> p.asfreq('D','end')Period('2012-02-29', 'D')>>> from pandas.tseries.offsets import Hour>>> pm4 = (p.asfreq('B','end') - 1).asfreq('T','start') + 16 * Hour()>>> pm4Period('2012-02-28 16:00', 'T')
季度型范围
>>> rng = pd.period_range('2012Q1','2012Q4',freq = 'Q-DEC')>>> rs = pd.Series(np.random.randn(len(rng)), index = rng)>>> rs2012Q1 3.2716312012Q2 0.0301442012Q3 0.7789392012Q4 -0.785795Freq: Q-DEC, dtype: float64>>> rng_new = (rs.index.asfreq('B','end') - 1).asfreq('T','start') + 16 * Hour()>>> rng_newPeriodIndex(['2012-03-29 16:00', '2012-06-28 16:00','2012-09-27 16:00', '2012-12-28 16:00'],dtype='period[T]', freq='T')>>> rs1 = rs.copy()>>> rs.indexPeriodIndex(['2012Q1', '2012Q2', '2012Q3', '2012Q4'], dtype='period[Q-DEC]', freq='Q-DEC')
将period 转换为 timestamp
>>> rs1.index = rng_new>>> rs12012-03-29 16:00 3.2716312012-06-28 16:00 0.0301442012-09-27 16:00 0.7789392012-12-28 16:00 -0.785795Freq: T, dtype: float64>>> rs.index = rng_new.to_timestamp()>>> rs2012-03-29 16:00:00 3.2716312012-06-28 16:00:00 0.0301442012-09-27 16:00:00 0.7789392012-12-28 16:00:00 -0.785795dtype: float64>>> rs.indexDatetimeIndex(['2012-03-29 16:00:00', '2012-06-28 16:00:00','2012-09-27 16:00:00', '2012-12-28 16:00:00'],dtype='datetime64[ns]', freq=None)>>> rs1.indexPeriodIndex(['2012-03-29 16:00', '2012-06-28 16:00','2012-09-27 16:00', '2012-12-28 16:00'],dtype='period[T]', freq='T')
Timestamp与Period互转
将Timestamp转换为Period(及其反向过程)
通过使用to_period方法,可以将由时间戳索引的Series和DataFrame对象转换为以时期索引。
>>> rng = pd.date_range('2000-1-1',periods = 3, freq = 'M')>>> ts = pd.Series(np.random.randn(len(rng)), index = rng)>>> ts2000-01-31 0.1853832000-02-29 -0.3042692000-03-31 1.447754Freq: M, dtype: float64>>> pts = ts.to_period()>>> pts2000-01 0.1853832000-02 -0.3042692000-03 1.447754Freq: M, dtype: float64>>> rng = pd.date_range('2000-1-29',periods = 6, freq = 'D')>>> ts2 = pd.Series(np.random.randn(len(rng)), index = rng)>>> ts22000-01-29 -1.2462422000-01-30 2.2717542000-01-31 0.9358332000-02-01 -0.5272192000-02-02 -0.3855042000-02-03 0.504284Freq: D, dtype: float64
新PeriodIndex的频率默认是从时间戳推断而来的,也可以指定任何别的频率
>>> ts2.to_period('M') # 结果中允许存在重复时期2000-01 -1.2462422000-01 2.2717542000-01 0.9358332000-02 -0.5272192000-02 -0.3855042000-02 0.504284Freq: M, dtype: float64
要转换回时间戳,使用to_timestamp即可。
>>> pts = ts2.to_period()>>> ts3 = pts.to_timestamp(how = 'end')>>> ts32000-01-29 23:59:59.999999999 -1.2462422000-01-30 23:59:59.999999999 2.2717542000-01-31 23:59:59.999999999 0.9358332000-02-01 23:59:59.999999999 -0.5272192000-02-02 23:59:59.999999999 -0.3855042000-02-03 23:59:59.999999999 0.504284Freq: D, dtype: float64
通过数组创建PeriodIndex
某些数据集中时间信息是分开在多个列存放的,可以通过PeriodIndex的参数将这些列组合在一起。
>>> year = [2017, 2017, 2017, 2017,2018, 2018, 2018, 2018]>>> quarter = [1,2,3,4,1,2,3,4]>>> index = pd.PeriodIndex(year=year,quarter=quarter,freq='Q-DEC')>>> indexPeriodIndex(['2017Q1', '2017Q2', '2017Q3','2017Q4', '2018Q1', '2018Q2','2018Q3', '2018Q4'],dtype='period[Q-DEC]', freq='Q-DEC')

若有收获,就点个赞吧
0 人点赞
