R-ggChernoff包绘制表情符号
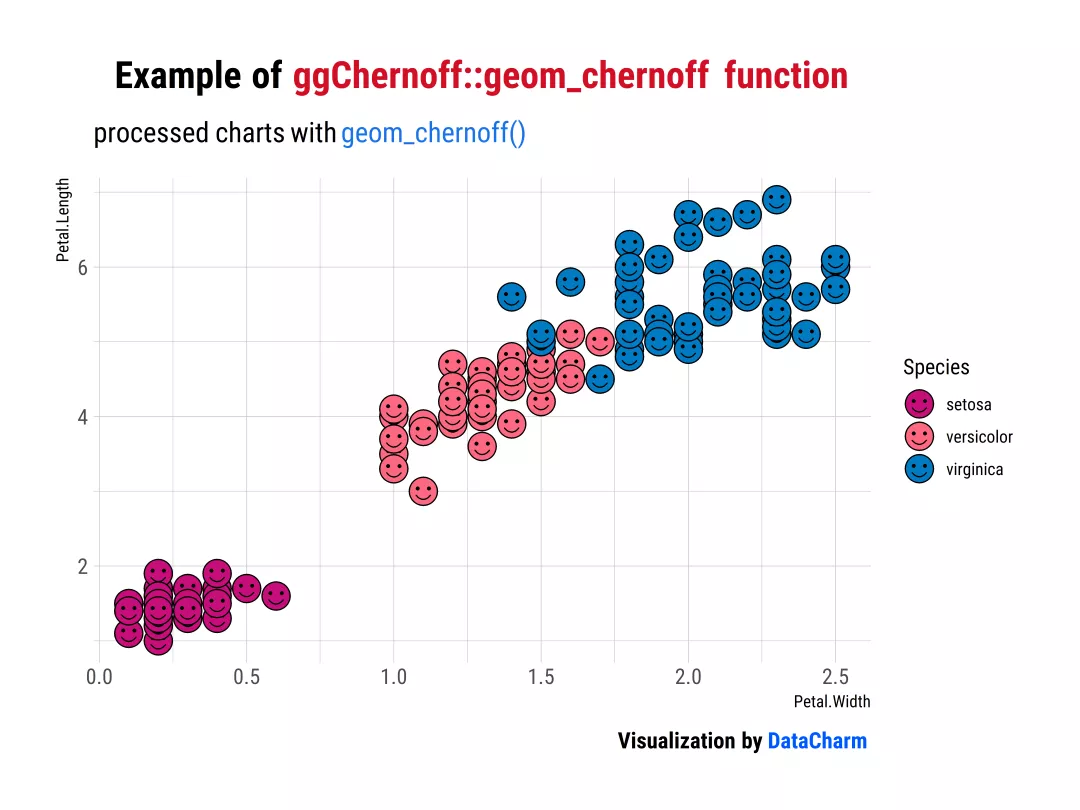
R-ggChernoff包作为ggplot2的拓展包,其提供的geom_chernoff()绘图函数与geom_point()函数语法类似,只不过,其绘制的为带笑脸的表情符号,而不是常规的点。这种笑脸表情符号制作过程依据如下:脸部特征会根据连续值的相对大小变换成微笑或者皱眉。默认情况下,平均值将生成笔直的脸😑,而较高的值将产生笑脸😊,而较低的值将产生皱眉😢。如果没有映射到相应变量,默认将全部都是笑脸。更多详细内容可参考R-ggChernoff包官网
接下来,将通过几个例子进行该包的解释:
「样例一」:
library(ggChernoff)library(tidyverse)library(ggtext)library(hrbrthemes)library(LaCroixColoR)geom_chernoff_plot01 <- ggplot() +geom_chernoff(data = iris,aes(Petal.Width, Petal.Length, fill = Species),size=5) +scale_fill_manual(values = lacroix_palette(type = "paired"))+labs(title = "Example of <span style='color:#D20F26'>ggChernoff::geom_chernoff function</span>",subtitle = "processed charts with <span style='color:#1A73E8'>geom_chernoff()</span>",caption = "Visualization by <span style='color:#0057FF'>DataCharm</span>") +hrbrthemes::theme_ipsum(base_family = "Roboto Condensed") +theme(plot.title = element_markdown(hjust = 0.5,vjust = .5,color = "black",size = 20, margin = margin(t = 1, b = 12)),plot.subtitle = element_markdown(hjust = 0,vjust = .5,size=15),plot.caption = element_markdown(face = 'bold',size = 12))
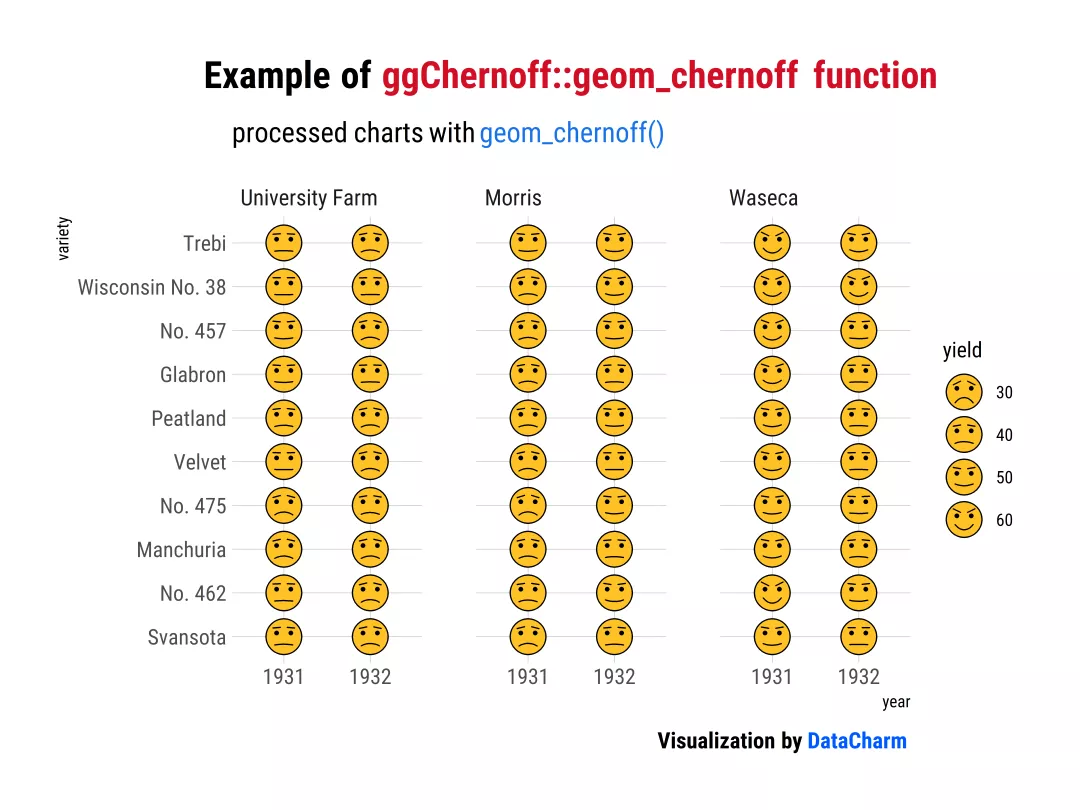
「样例二」:
test_data <- lattice::barley %>% filter(site==c("University Farm","Waseca","Morris"))geom_chernoff_plot02 <- ggplot() +geom_chernoff(data=test_data,aes(x = year, y = variety, smile = yield, brow = yield),fill = 'goldenrod1',size=8) +scale_x_discrete(limits = c('1931', '1932')) +#分面处理facet_wrap(~ site) +labs(title = "Example of <span style='color:#D20F26'>ggChernoff::geom_chernoff function</span>",subtitle = "processed charts with <span style='color:#1A73E8'>geom_chernoff()</span>",caption = "Visualization by <span style='color:#0057FF'>DataCharm</span>") +hrbrthemes::theme_ipsum(base_family = "Roboto Condensed") +theme(plot.title = element_markdown(hjust = 0.5,vjust = .5,color = "black",size = 20, margin = margin(t = 1, b = 12)),plot.subtitle = element_markdown(hjust = 0,vjust = .5,size=15),plot.caption = element_markdown(face = 'bold',size = 12))
Example02 of ggChernoff
以上两个例子很好的解释了geom_chernoff() 绘图函数的绘图原理(其实就是将数值映射到smile、brow等参数上),大家可根据自己的数据进行合理的数值映射即可。接下来,小编再介绍另一个绘制符号字体的R包。
R-emojifont包绘制表情符号
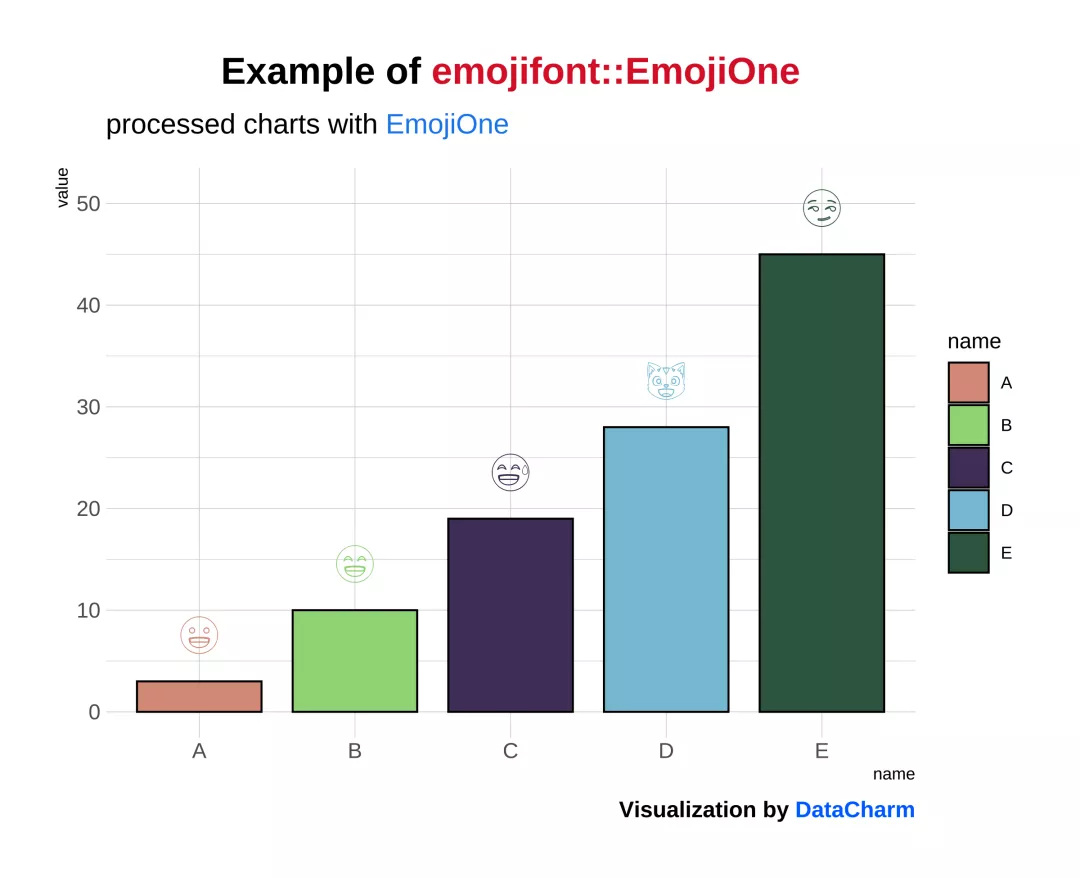
R-emojifont包不同于上面介绍的R包,其支持的符号字体(emoji font)也更加丰富,主要包括:Emoji characters(表情符号字符) 和 Font Awesome。更多信息可参考R-emojifont包官网
接下来,通过几个例子进行简单描述:
「样例一」:
data <- data.frame(name=c("A","B","C","D","E") ,value=c(3,10,19,28,45),label = c(emoji('smiley'), emoji('smile'),emoji('sweat_smile'),emoji('smiley_cat'),emoji('smirk')))Barplot <- ggplot(data, aes(x=name, y=value,label=label,fill=name)) +geom_bar(stat = "identity",color="black",width = .8) +geom_text(aes(y=value+6,color=name),family="EmojiOne",size=8) +hrbrthemes::scale_color_ipsum()+hrbrthemes::scale_fill_ipsum()+labs(title = "Example of <span style='color:#D20F26'>emojifont::EmojiOne</span>",subtitle = "processed charts with <span style='color:#1A73E8'>EmojiOne</span>",caption = "Visualization by <span style='color:#0057FF'>DataCharm</span>") +hrbrthemes::theme_ipsum(base_family = "Roboto Condensed")+theme(plot.title = element_markdown(hjust = 0.5,vjust = .5,color = "black",size = 20, margin = margin(t = 1, b = 12)),plot.subtitle = element_markdown(hjust = 0,vjust = .5,size=15),plot.caption = element_markdown(face = 'bold',size = 12))
Example01 of emojifont
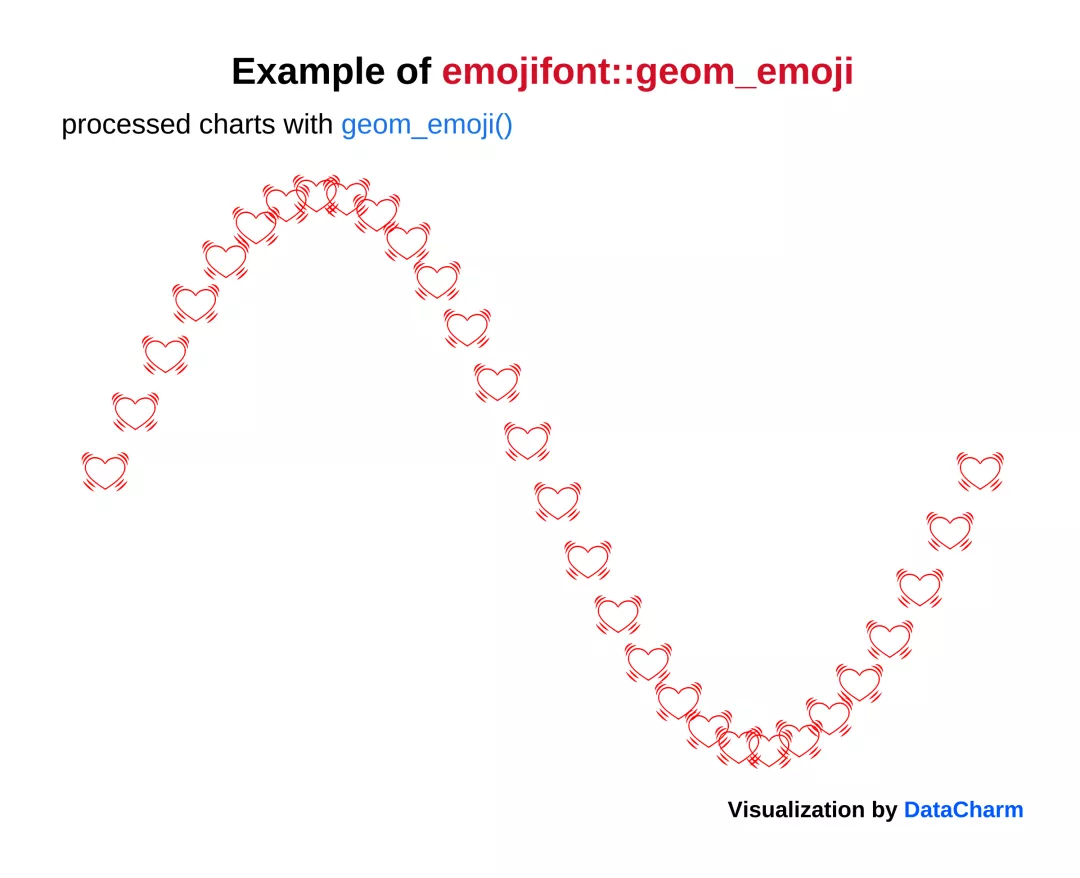
这里可以看出,在每个柱形图的上方添加了对于的表情符合,当然,还可以单独使用表情符号进行绘制:
「样例二」:
##plot2x = seq(0, 2*pi, length=30)y = sin(x)ggplot() + geom_emoji('heartbeat', x=x, y=y,size=10,color = "red") +labs(title = "Example of <span style='color:#D20F26'>emojifont::geom_emoji</span>",subtitle = "processed charts with <span style='color:#1A73E8'>geom_emoji()</span>",caption = "Visualization by <span style='color:#0057FF'>DataCharm</span>") +hrbrthemes::theme_ipsum(base_family = "Roboto Condensed")+#theme_ft_rc(base_family = "Roboto Condensed") +theme(plot.title = element_markdown(hjust = 0.5,vjust = .5,color = "black",size = 20, margin = margin(t = 1, b = 12)),plot.subtitle = element_markdown(hjust = 0,vjust = .5,size=15),plot.caption = element_markdown(face = 'bold',size = 12),# 去除刻度线和网格线axis.text.x = element_blank(),axis.text.y = element_blank(),axis.title.x = element_blank(),axis.title.y = element_blank(),panel.grid.major = element_blank(),panel.grid.minor = element_blank())
「样例三」:
df<-read_excel("test_data.xlsx")##数据处理df <- df %>% mutate(emoji_label = if_else(gender == "Male",fontawesome("fa-mars-double"),fontawesome("fa-venus-double")))example <- ggplot(data = df,aes(decade, category, color = as.numeric(prop), label = emoji_label)) +geom_tile(fill = "grey25", color = "grey20", size = 1) +geom_text(family = 'fontawesome-webfont', size = 6) +facet_grid(. ~ gender) +scale_color_scico(palette = "buda", name = NULL, na.value = "grey25",guide = guide_colorbar(direction = "horizontal",barheight = unit(3, units = "mm"),barwidth = unit(150, units = "mm"),draw.ulim = FALSE, title.position = 'bottom',title.hjust = 0.5, label.hjust = 0.5)) +labs(title = "Example of emojifont library",subtitle = "processed charts with geom_text()")+theme(strip.text = element_blank(),rect = element_rect(fill = "grey20", colour = "grey20", size = 0.4,color = "grey20",linetype = 1),plot.background = element_rect(color = "grey20"),panel.background = element_rect(fill = NA, colour = NA),panel.border = element_rect(colour = "grey85", fill = NA, color = "grey20",size = rel(1)),panel.grid = element_blank(),plot.title = element_text(size = 15, hjust = 0.5, vjust = 1, face = "bold",colour = "white"),plot.subtitle = element_text(size = 12, hjust = 0.5, vjust = 1,colour = "white"),axis.text = element_text(size = 9,colour = "grey85"),legend.position = "bottom",legend.text = element_text(colour = "white"),axis.ticks = element_blank(),axis.title = element_blank()axis.text = element_text(size=10))
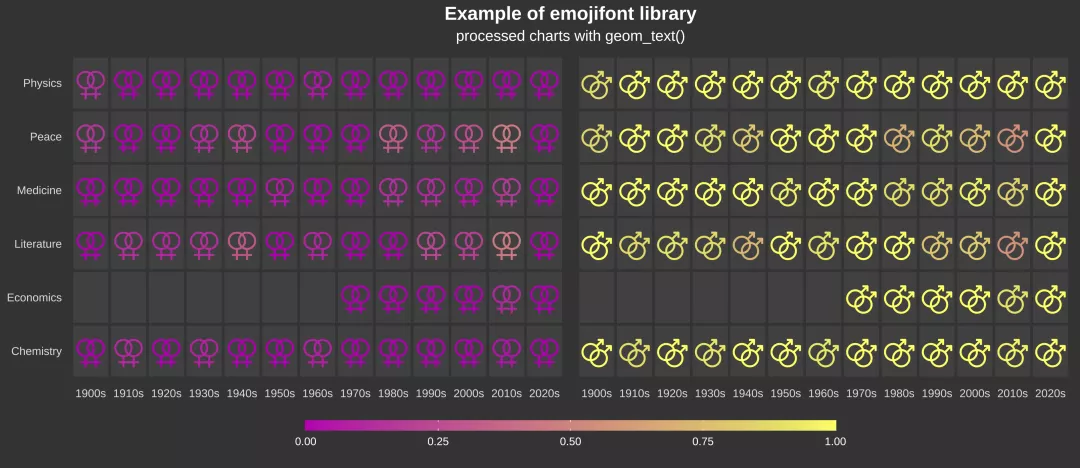
Example03 of emojifont

若有收获,就点个赞吧
0 人点赞
