tags: [笔记, Matplotlib, contourf()]
categories: [笔记, Matplotlib, contourf()]
语法
contourf([X, Y,] Z, [levels], **kwargs)
功能
contour()和contourf()分别绘制等高线和填充等高线。除非另有说明,两个版本的函数签名和返回值是相同的。
参数
X, Y: **array-like, optional
Z中值的坐标。X和Y必须是与Z相同形状的2D数据(例如,通过numpy.meshgrid创建),或者它们必须是1-D,这样len(X) == M是Z中的列数,len(Y) == N是Z中的行数。
如果没有给出,则假设它们是整数索引,即X = range(M), Y = range(N)。
Z: (N, M) array-like
绘制等高线的高度值。
levels: int or array-like, optional**
确定轮廓线/区域的数量和位置。如果为int n,则使用MaxNLocator,它会尝试在vmin和vmax之间自动选择不超过n + 1个等高线levels。
如果是类数组,则在指定的levels上绘制等高线。这些值必须按递增顺序排列。
返回
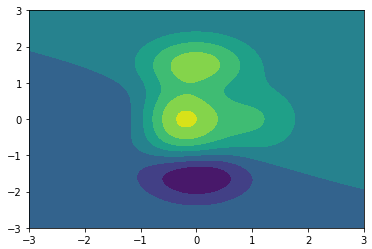
例1 基础用法
import numpy as npimport pandas as pdimport matplotlib.pyplot as plt# 计算x,y坐标对应的高度值def f(x, y):return (1-x/2+x**3+y**5) * np.exp(-x**2-y**2)# 生成x,y的数据x = np.linspace(-3, 3, 251)y = np.linspace(-3, 3, 201)# 把x,y数据生成mesh网格状的数据,因为等高线的显示是在网格的基础上添加上高度值X, Y = np.meshgrid(x, y)f(X,Y).shape# 填充等高线plt.contourf(X, Y, f(X, Y))# 显示图表plt.show()
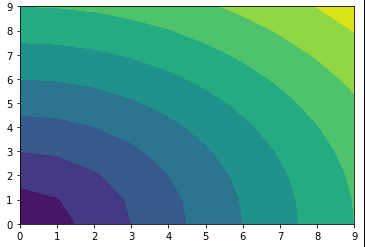
例2 levels的用法
当为整数的时候, 如levels=3, 他会将数值分成三份, 设置为10就是分为10份, 可以看下面的例子.
import numpy as npimport matplotlib.pyplot as pltx, y = np.meshgrid(np.arange(10),np.arange(10))z = np.sqrt(x**2 + y**2)cs = plt.contourf(x,y,z,levels=10)plt.show()
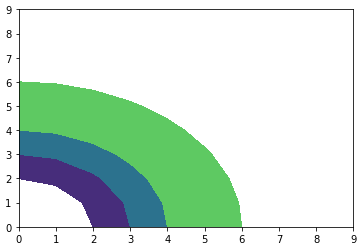
当然levels后面也是可以跟lists, 注意lists中的数字必须从小到大. 这个数字表示的是a0-a1是一部分, a1-a2是一部分. 比如levels=[2,3,4,6], 就表示2<x<3, 3<x<4, 4<x<5, 5<x<6, 最终的结果如下图所示.
import numpy as npimport matplotlib.pyplot as pltx, y = np.meshgrid(np.arange(10),np.arange(10))z = np.sqrt(x**2 + y**2)cs = plt.contourf(x,y,z,levels=[2,3,4,6])plt.show()
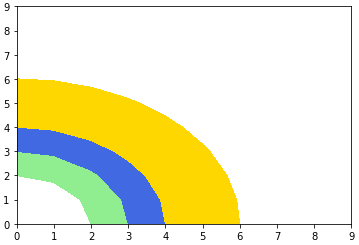
例3 自定义颜色 color参数
自定义颜色需要配合levels来进行使用, 比如我们指定了levels对应着三个范围, 我们就可以对这三个范围依次设置颜色, 如下所示.
x, y = np.meshgrid(np.arange(10),np.arange(10))z = np.sqrt(x**2 + y**2)cs = plt.contourf(x,y,z,levels=[2,3,4,6], colors=['lightgreen', 'royalblue', 'gold'])plt.show()
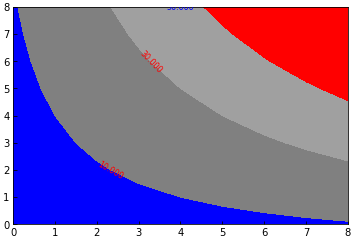
x = np.arange(1, 10)xy = x.reshape(-1, 1)yh = x * ycs = plt.contourf(h, levels=[10, 30, 50], colors=['#808080', '#A0A0A0', '#C0C0C0'], extend='both')cs.cmap.set_over('red')cs.cmap.set_under('blue')cs.changed()# 避免图片显示不完全# plt.tight_layout()# Label a contour plot.显示出等高线的值,以及指定颜色plt.clabel(cs,fontsize=8,colors=['red','red','blue'])plt.show
array([1, 2, 3, 4, 5, 6, 7, 8, 9])array([[1],[2],[3],[4],[5],[6],[7],[8],[9]])<a list of 3 text.Text objects>

若有收获,就点个赞吧
0 人点赞
