📕数据主动获取所以需要数据源可以被访问到
- 内外网的问题
1. 安装参考
2. 实际试验
2.1 错误:./xxxxx: cannot execute binary file
CPU是Intel的但你安装的是amd的,所以装不上,下载x86的包即可
2.2 自启文件
#设置开机启动#[root@localhost ~]# touch /usr/lib/systemd/system/prometheus.service#[root@localhost ~]# chown prometheus:prometheus /usr/lib/systemd/system/prometheus.service#[root@localhost ~]# vim /usr/lib/systemd/system/prometheus.service## 文件内容 ##[Unit]Description=PrometheusDocumentation=https://prometheus.io/After=network.target[Service]# Type设置为notify时,服务会不断重启Type=simpleUser=prometheus# --storage.tsdb.path是可选项,默认数据目录在运行目录的./dada目录中ExecStart=/usr/local/monitoring/prometheus/prometheus --config.file=/usr/local/monitoring/prometheus/prometheus.yml --storage.tsdb.path=/home/software/prometheus-dataRestart=on-failure[Install]WantedBy=multi-user.target## 文件内容 ###重启服务#systemctl restart prometheus#启动服务#systemctl start prometheus#停止服务#systemctl stop prometheus#开机启动服务#systemctl enable prometheus#停止开机启动#systemctl disable prometheus#查看状态#systemctl status prometheus
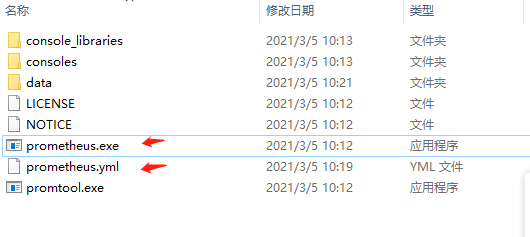
2.3 prometheus.yml
prometheus 文件夹内
# my global configglobal:scrape_interval: 15s # Set the scrape interval to every 15 seconds. Default is every 1 minute.evaluation_interval: 15s # Evaluate rules every 15 seconds. The default is every 1 minute.# scrape_timeout is set to the global default (10s).# Alertmanager configurationalerting:alertmanagers:- static_configs:- targets:# - alertmanager:9093# Load rules once and periodically evaluate them according to the global 'evaluation_interval'.rule_files:# - "first_rules.yml"# - "second_rules.yml"# A scrape configuration containing exactly one endpoint to scrape:# Here it's Prometheus itself.scrape_configs:# The job name is added as a label `job=<job_name>` to any timeseries scraped from this config.- job_name: 'prometheus'# metrics_path defaults to '/metrics'# scheme defaults to 'http'.static_configs:- targets: ['localhost:9090']labels:instance: prometheus- job_name: 'huaweiyun'scrape_interval: 10sstatic_configs:- targets: ['localhost:9100']labels:instance: huaweiyun- job_name: 'job'scrape_interval: 10s# 访问路径metrics_path: '/basic-job/actuator/prometheus'static_configs:# ip端口,可以多个- targets: ['localhost:8819']labels:instance: job
2.4 访问测试
访问 127.0.0.1:9090 : 成功如下,如果失败 请检查启动是否成功,如果ymal配置有误会提示多少行(使用 解压目录下使用 ./prometheus 启动命令查看错误提示,自启报错好像没有错误日志打印)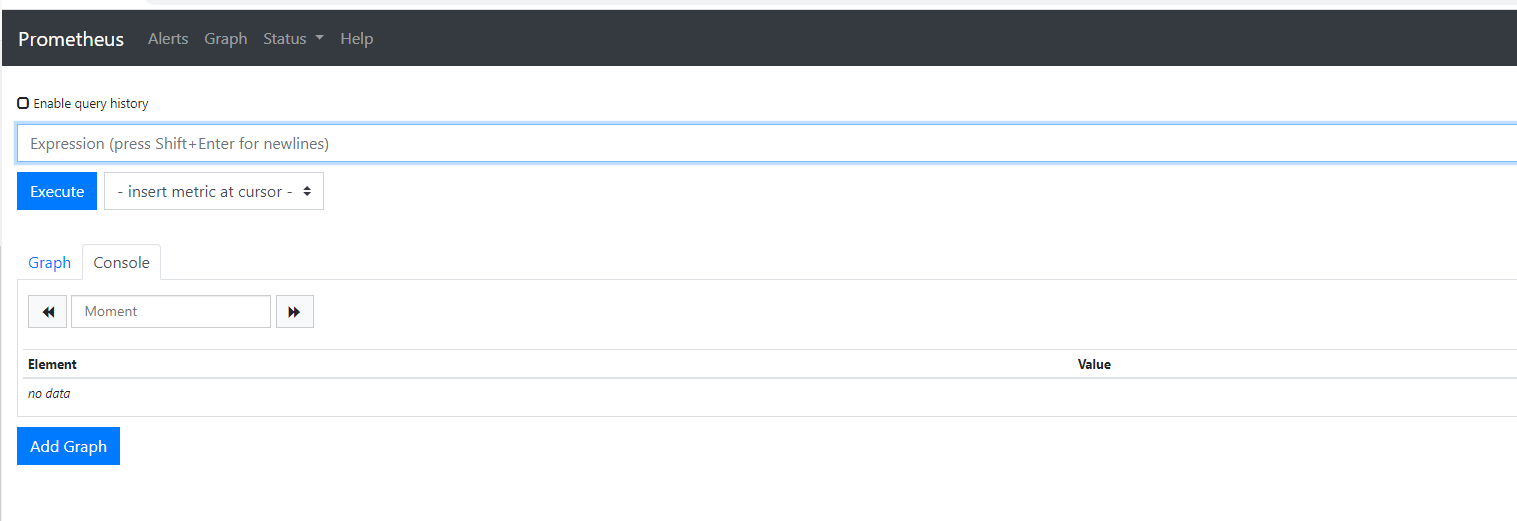
3. windows 相同操作
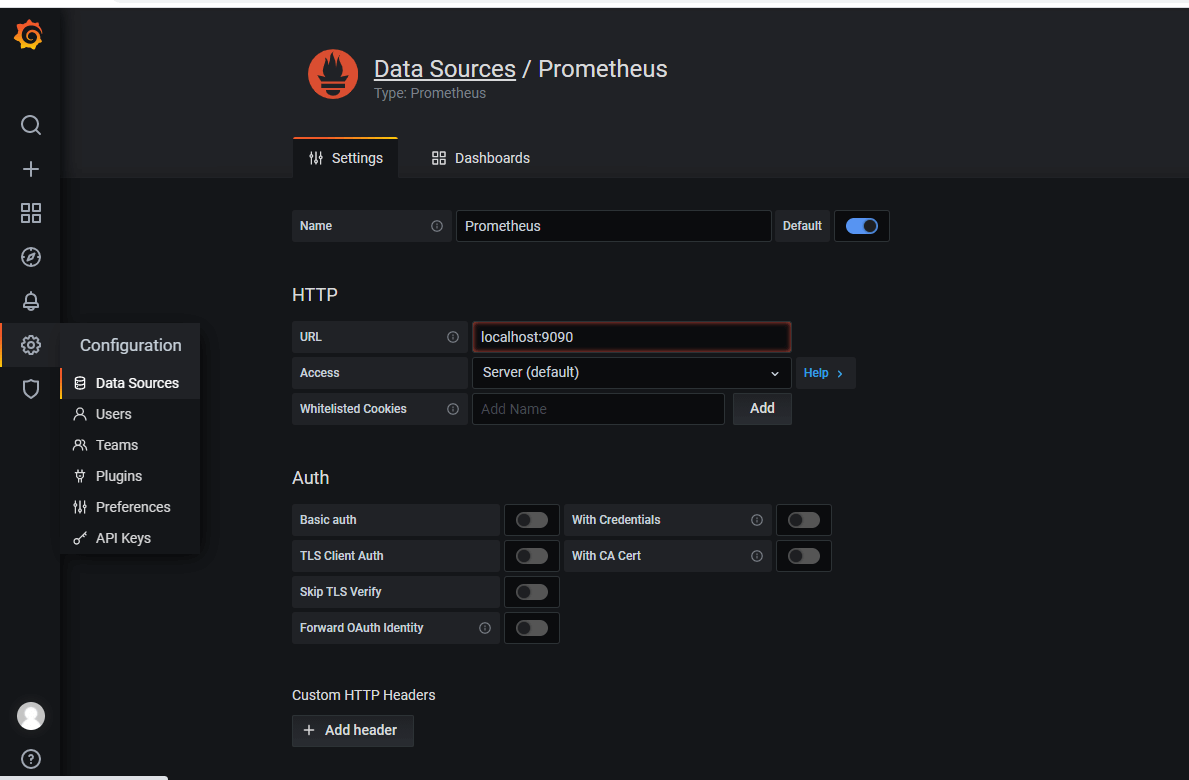
4. grafana 添加 Prometheus 源

若有收获,就点个赞吧
0 人点赞
