Goswami, C.P., Nakshatri, H. PROGgeneV2: enhancements on the existing database. BMC Cancer 14, 970 (2014). https://doi.org/10.1186/1471-2407-14-970
传送门:http://genomics.jefferson.edu/proggene/
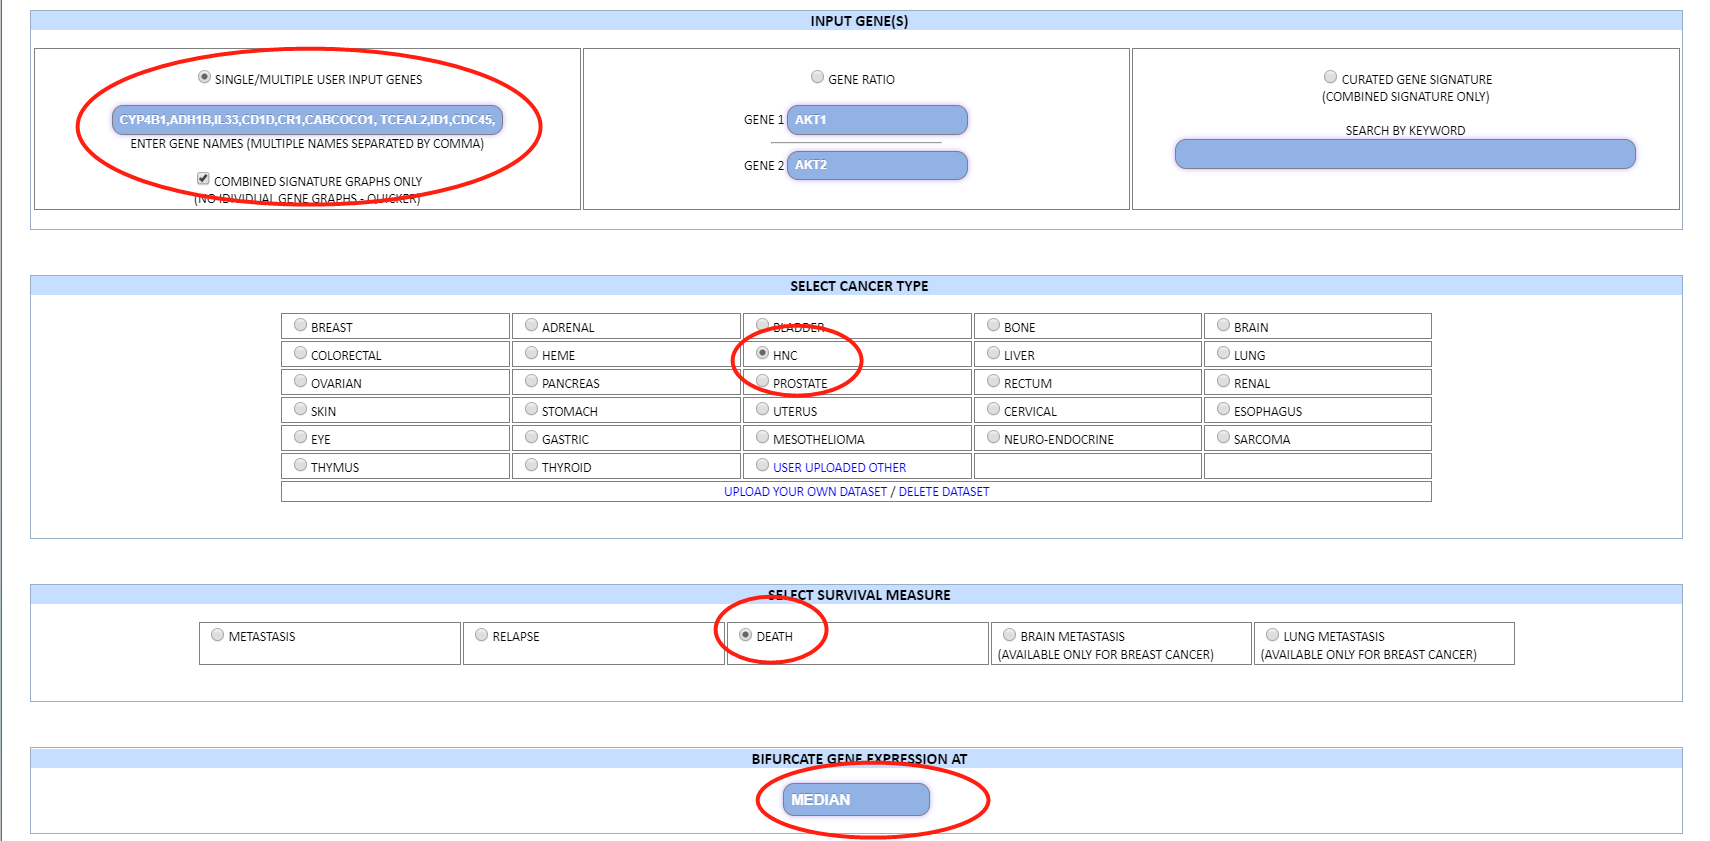
亮点在于,直接输入多个基因symbol,再选择癌症类型、数据集、survival measure、分组指标即可出图
example
输入一 13个基因的 signature
sigs <- expr[c("CYP4B1","ADH1B","IL33","CD1D","CR1","CABCOCO1","TCEAL2","ID1","CDC45","ANLN","CDCA2","PRC1","TOP2A"),]
input
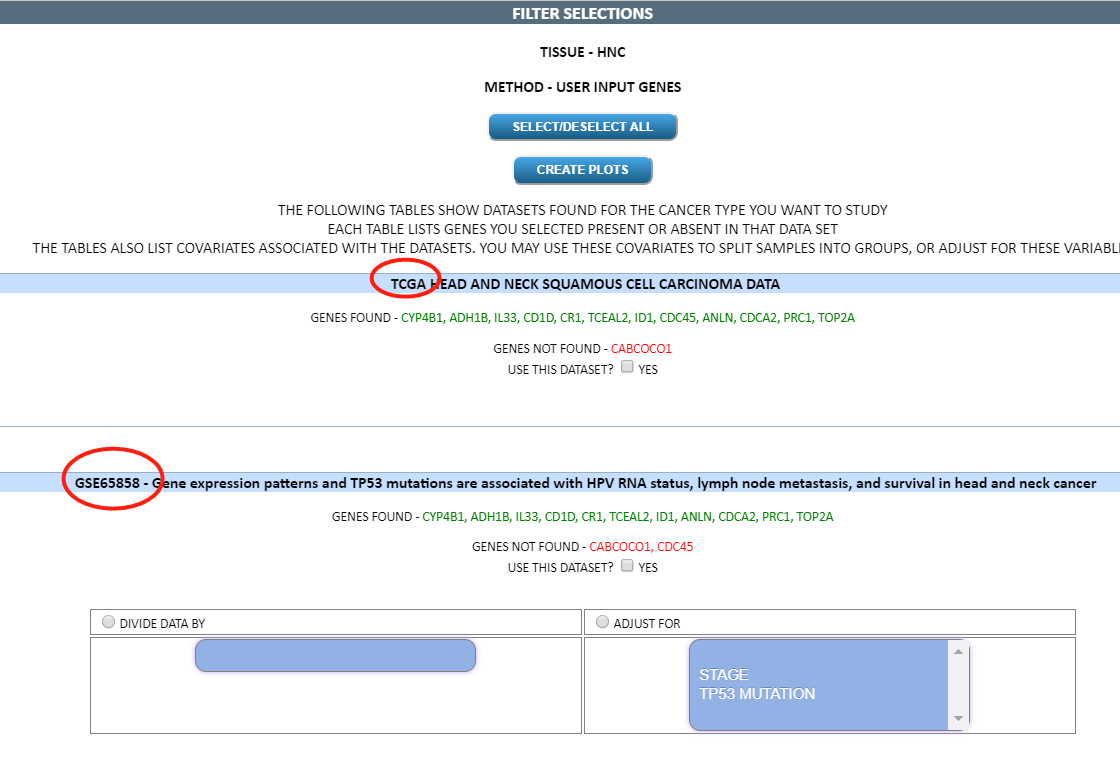
 dataset
基于所输入的基因和癌症类型,自动匹配数据集供用户选择.
选择 TCGA
出图
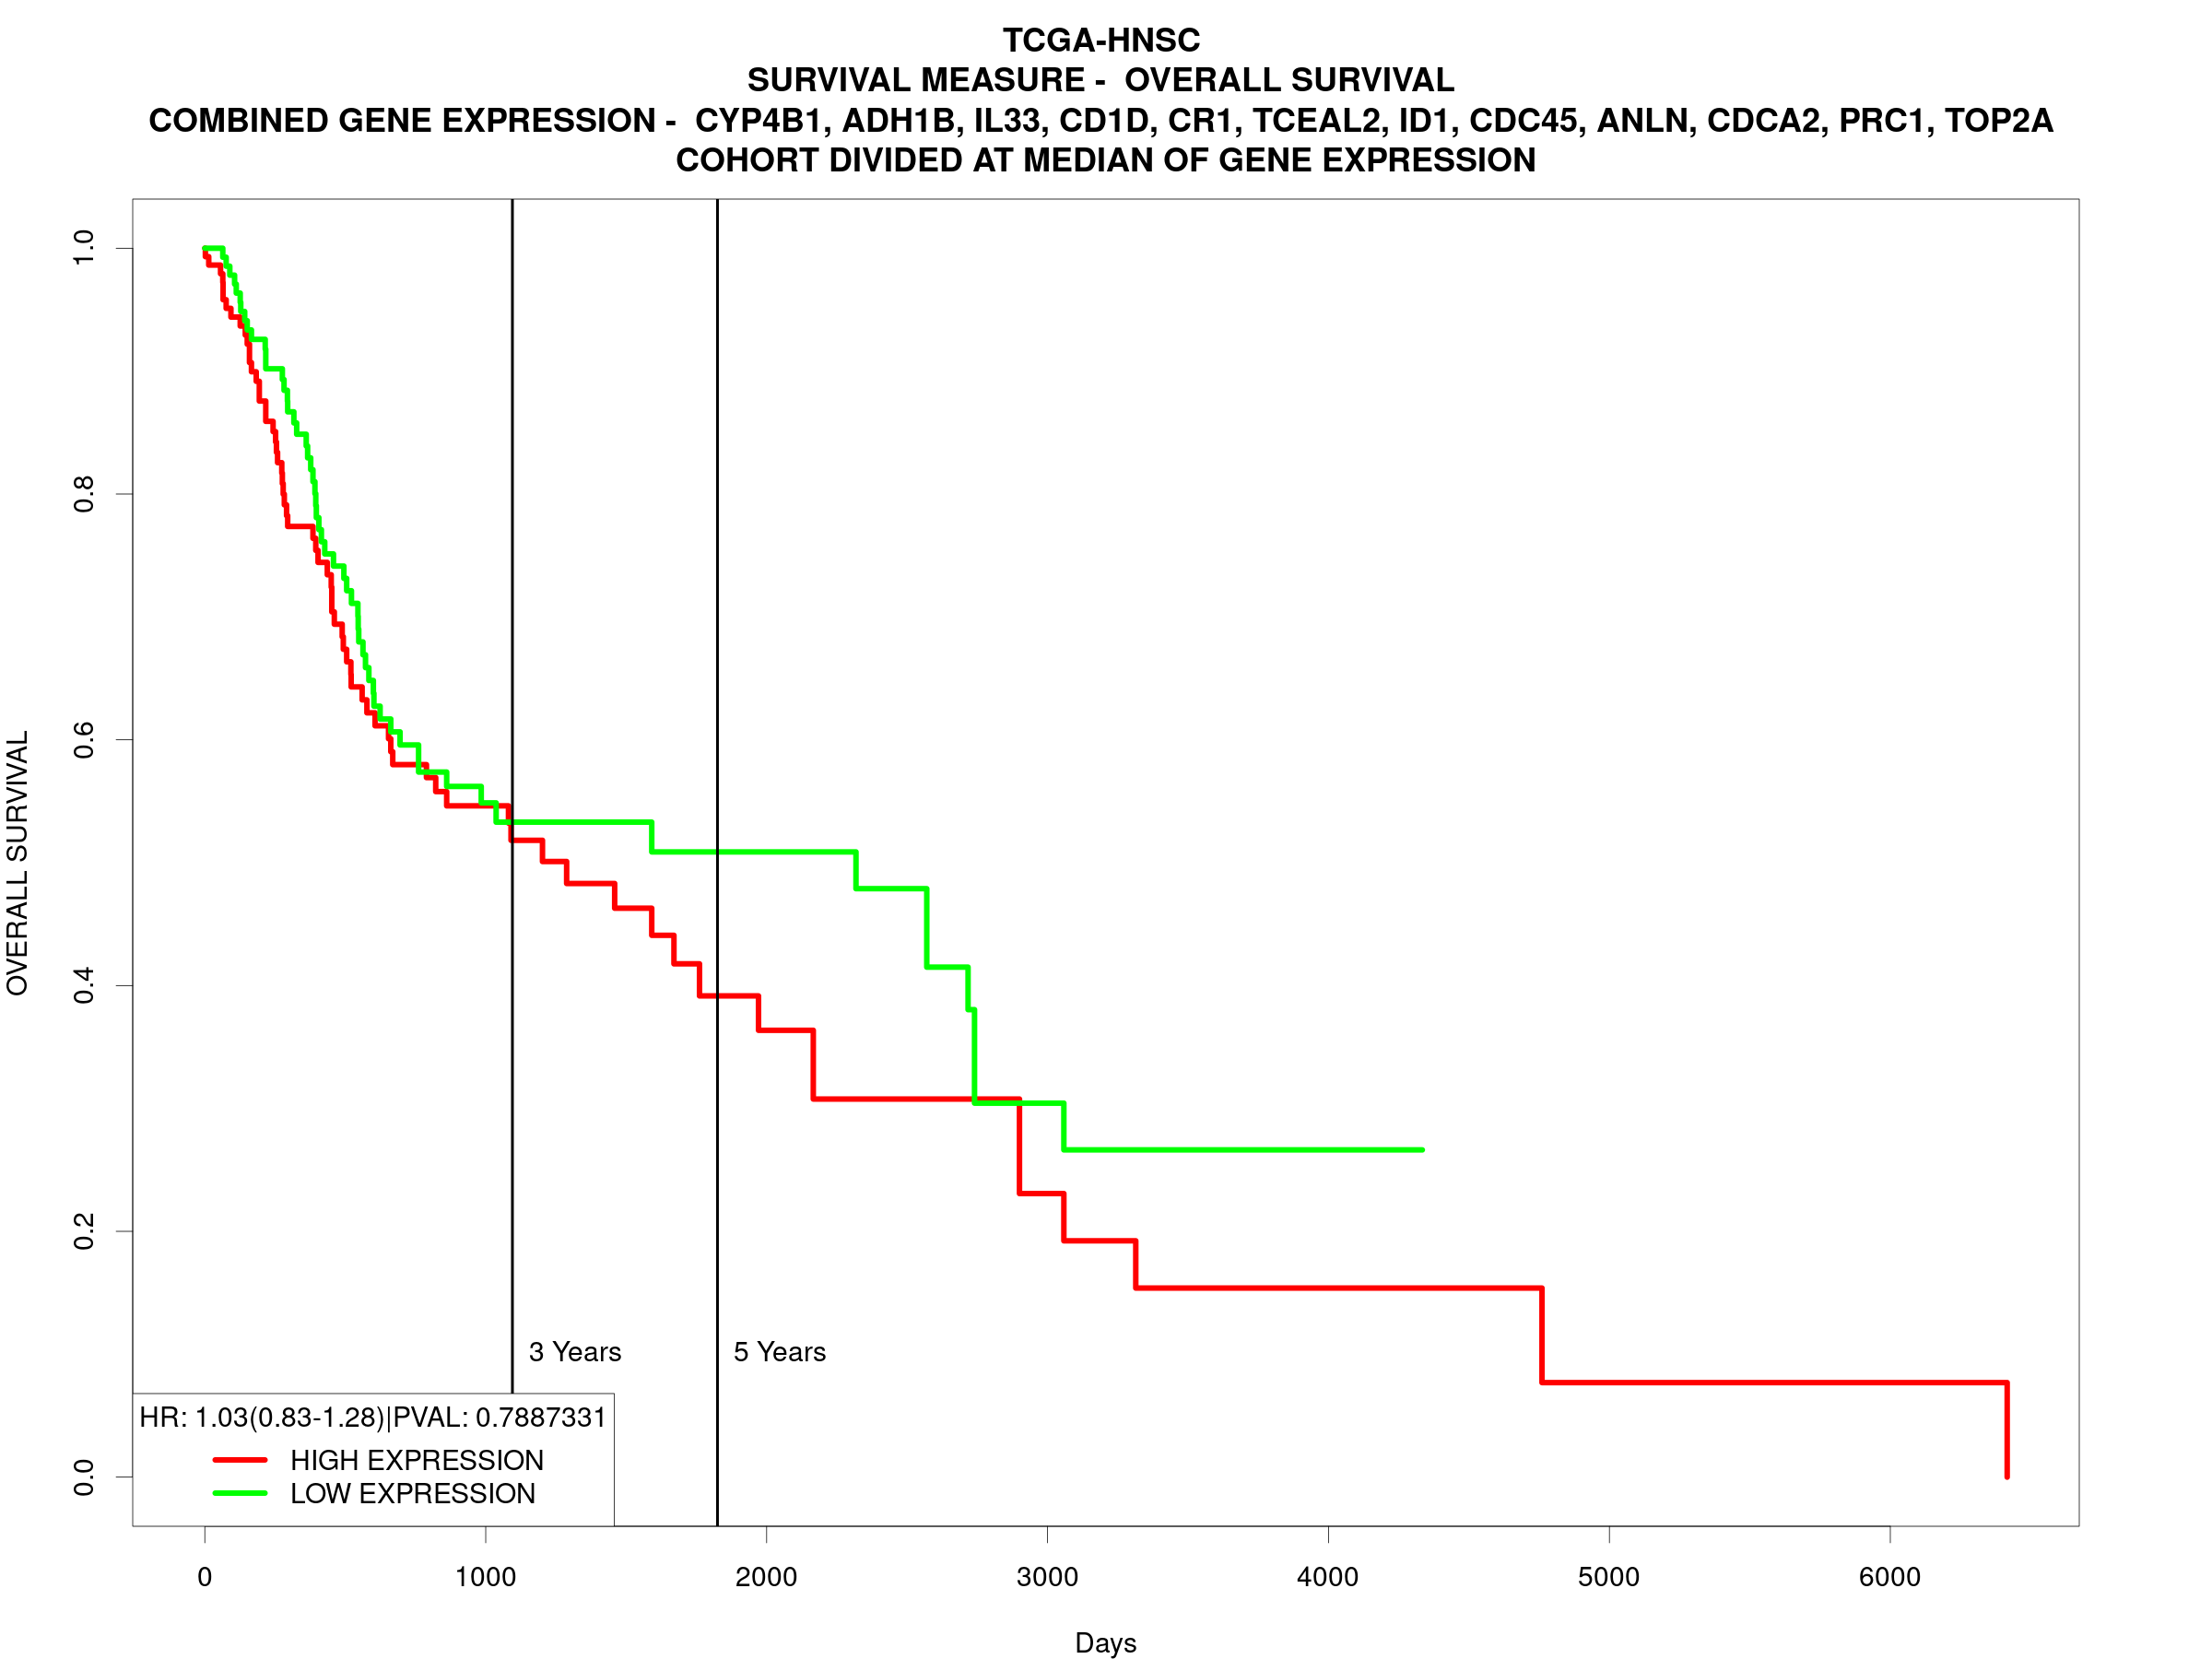
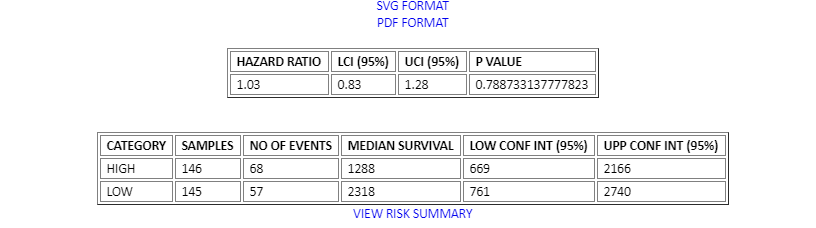
附带一些值
workflow
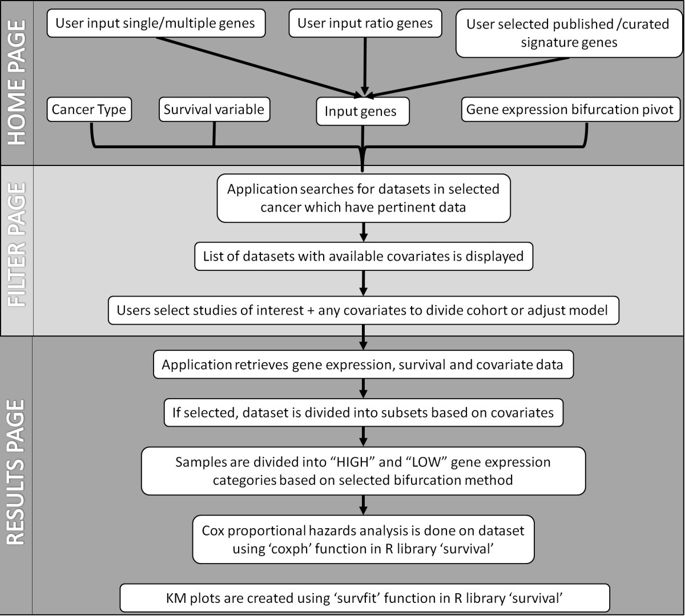
所用方法
PROGgeneV2 is written in PHP5 with a MySQL database backend which stores gene expression data, covariates data and metadata for catalogued studies in form of relational database tables.
统计学方法为:Cox proportional hazards analysis
Survival analysis is done using backend R script which employs R library ‘survival’ to perform Cox proportional hazards analysis (function ‘coxph’) and to plot prognostic plots (function ‘survfit’).
当选定为 signature 生存分析:
Based on input in home page and filter page the R script computes a final gene expression variable. Final gene expression could be a ratio of expression of two genes if the analysis method is gene ratio, or mean of gene expression of multiple genes if the analysis method is gene signature or if users input their own set of genes and wish to plot a combined prognostic plot for all genes instead of single gene, or gene expression of single gene if users selected to perform survival analysis on individual genes separately.
所以是,直接对每个病人的signature基因取平均值,以这个方法整合后再cox?
_
KM plot
For creation of Kaplan Meier (KM) plots, gene expression variable is bifurcated based on median, mean, 25 percentile or 75 percentile as selected by users in home page, and samples are categorized into having ‘HIGH’ or ‘LOW’ gene expression categories. KM plots are then created using ‘survfit’ function in library ‘survival’.

若有收获,就点个赞吧
0 人点赞
