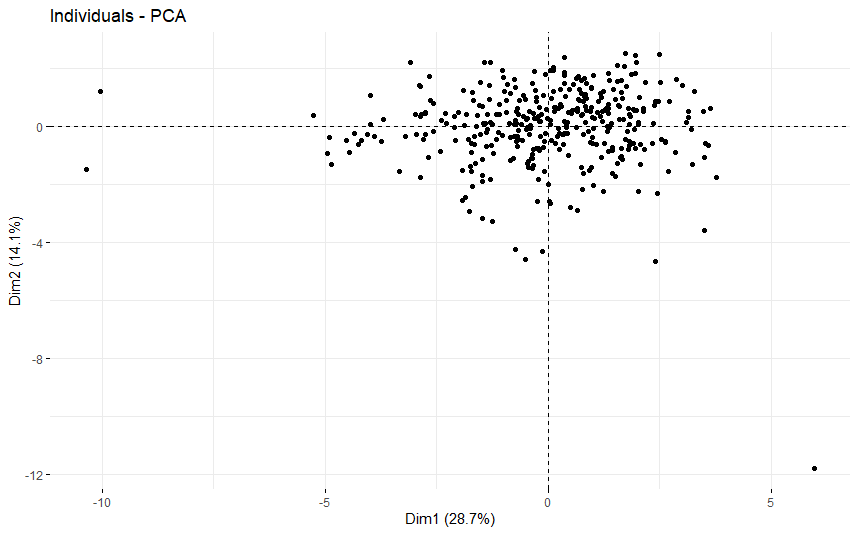
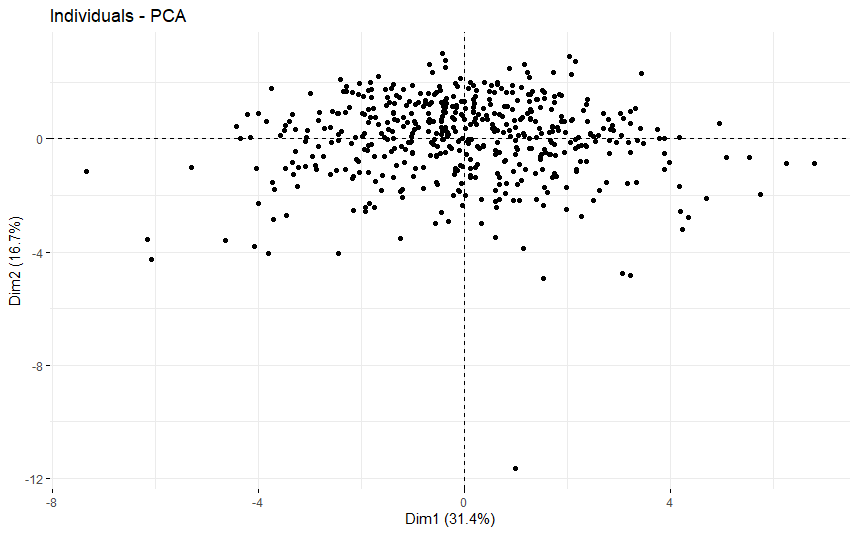
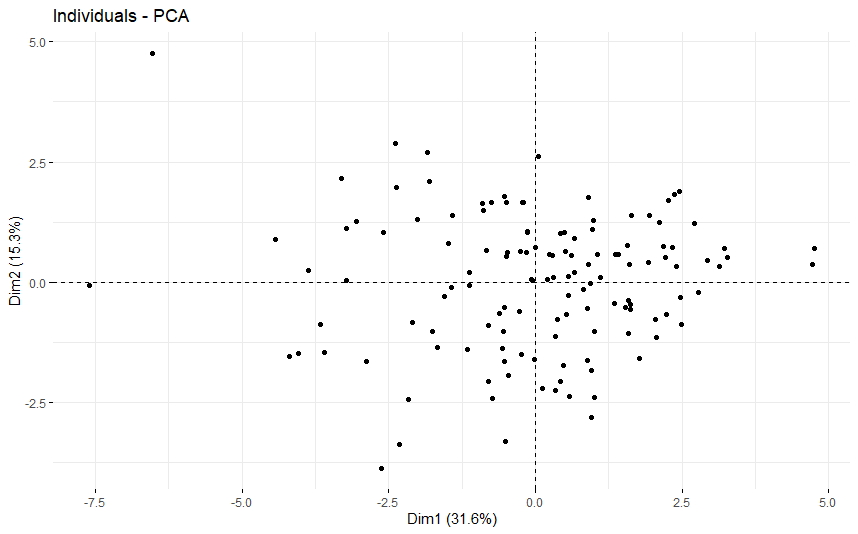
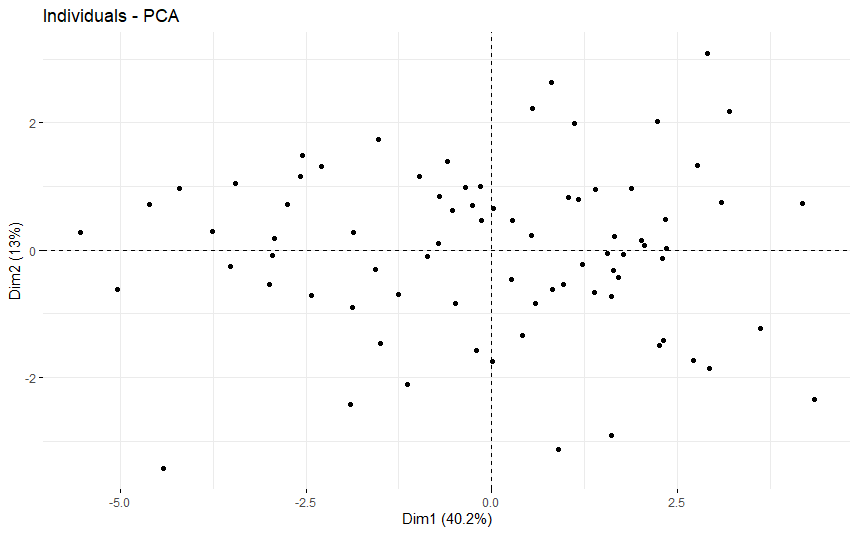
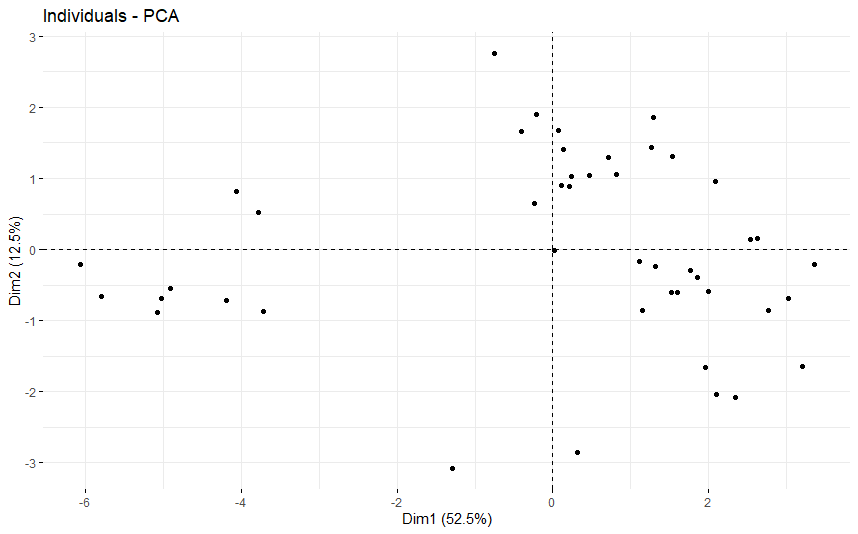
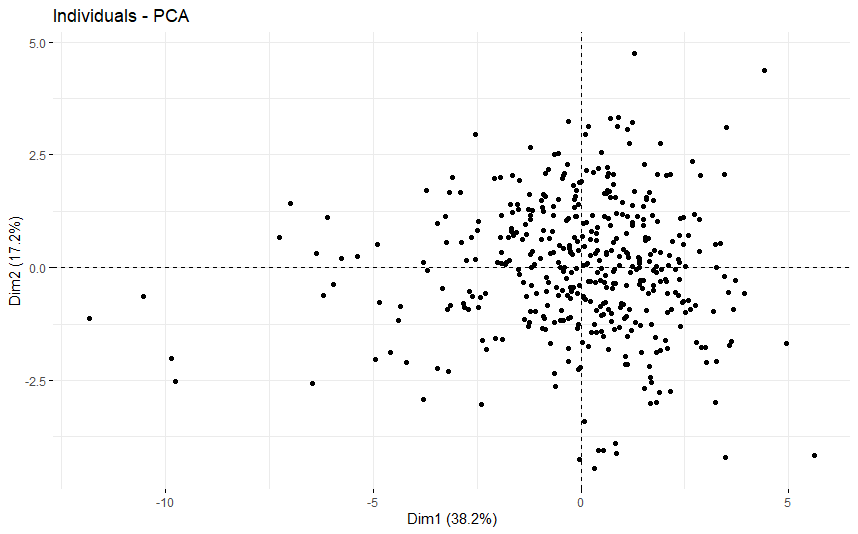
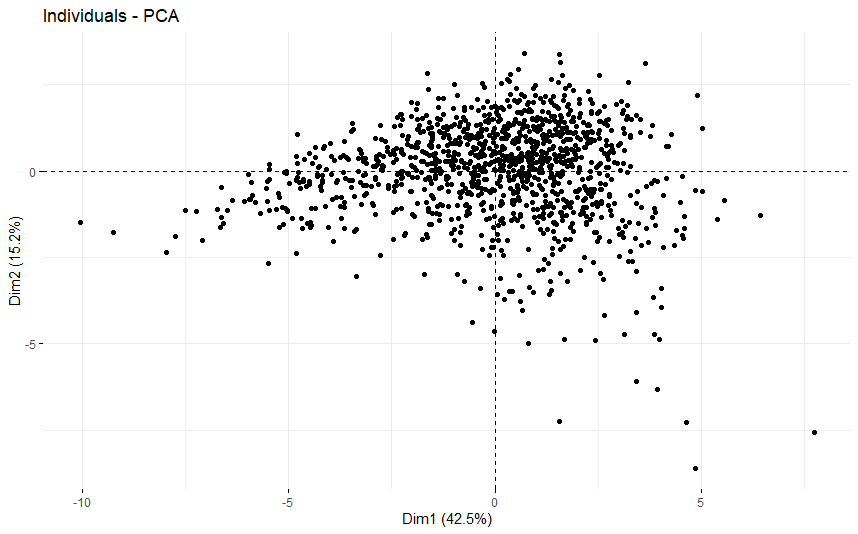
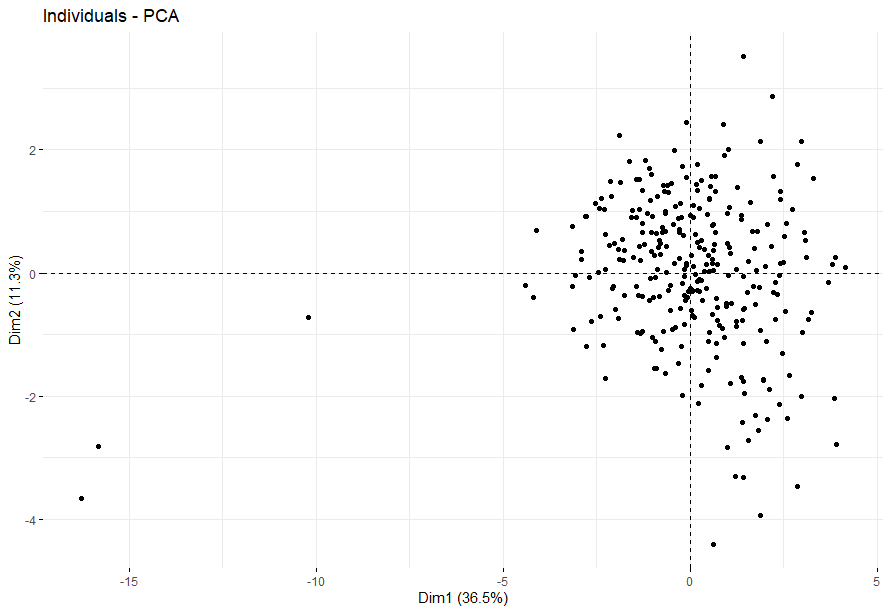
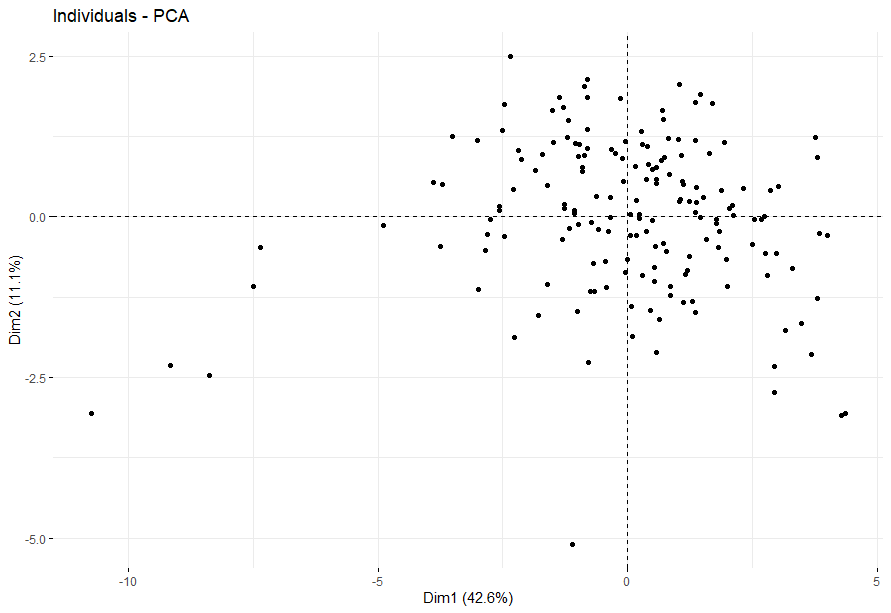
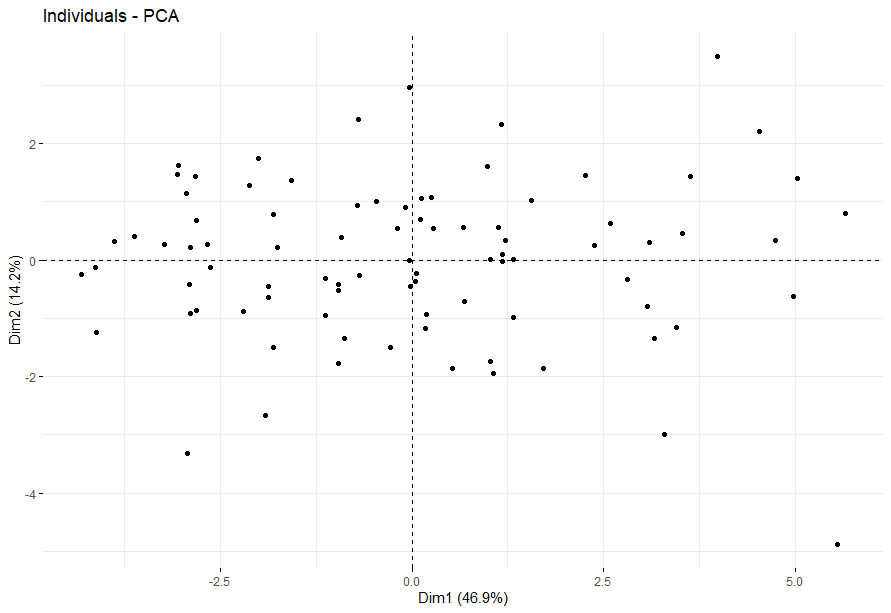
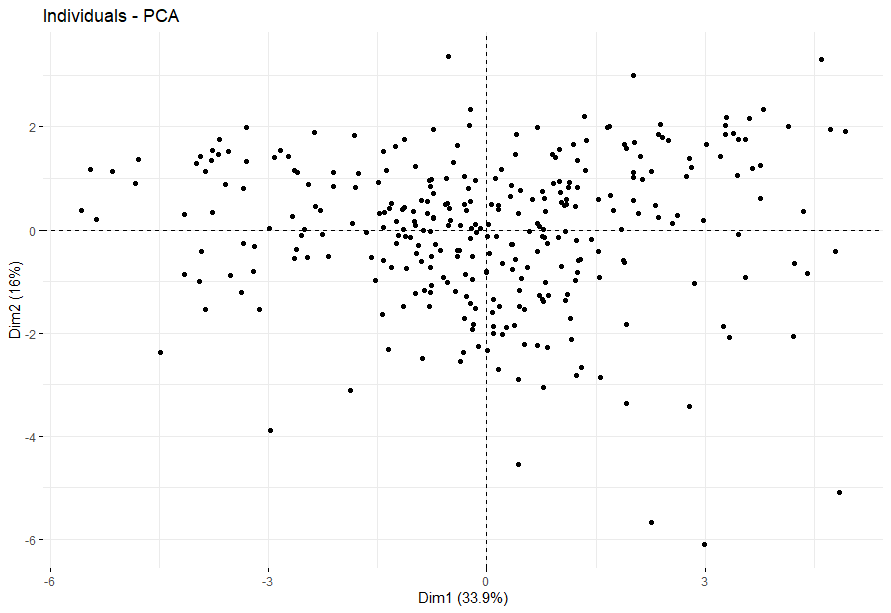
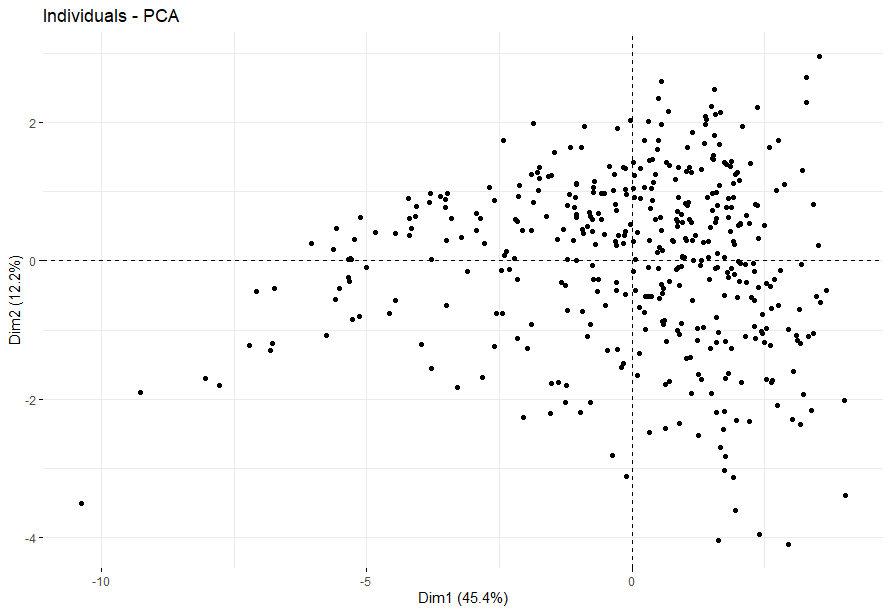
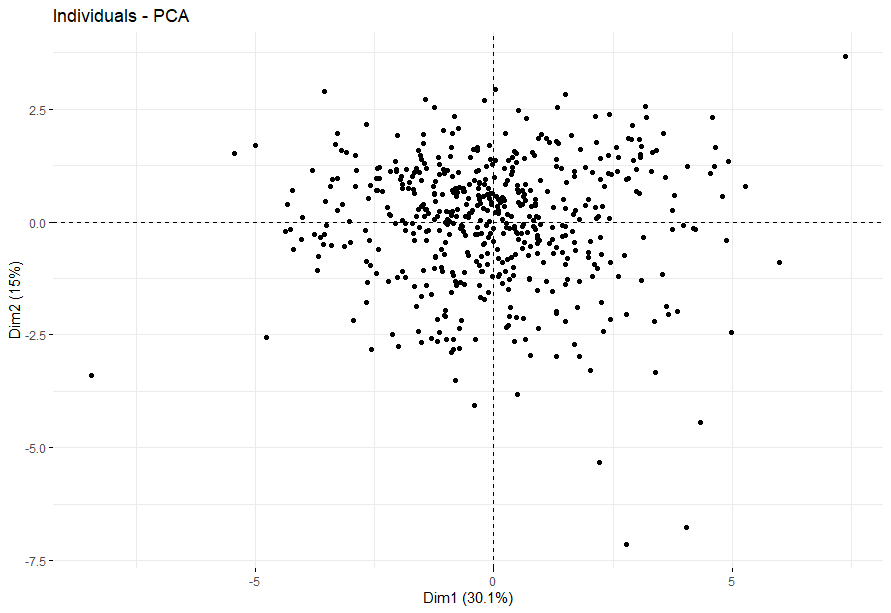
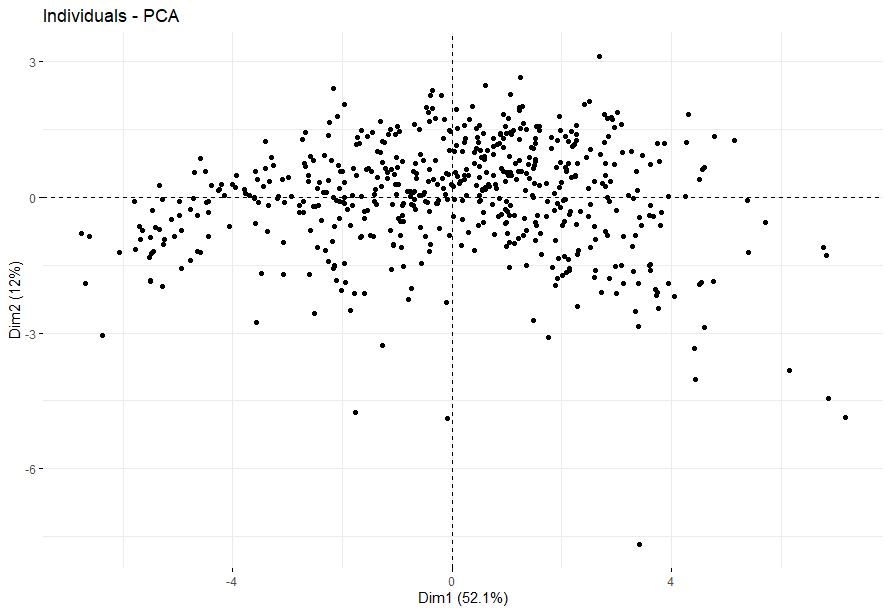
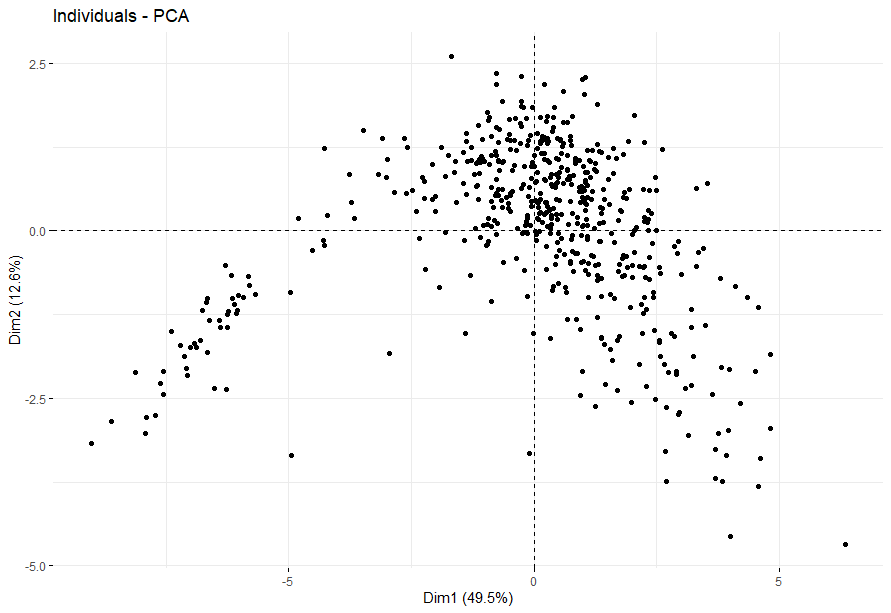
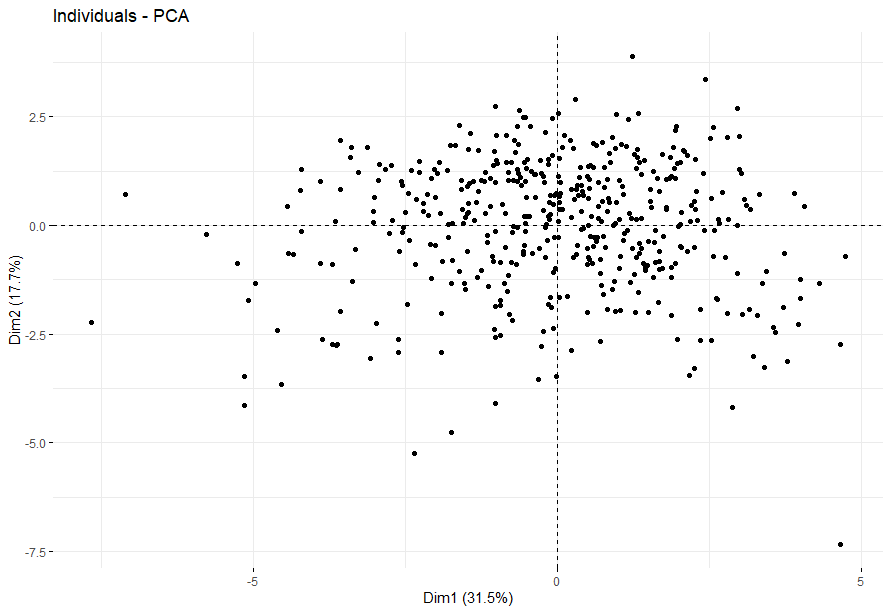
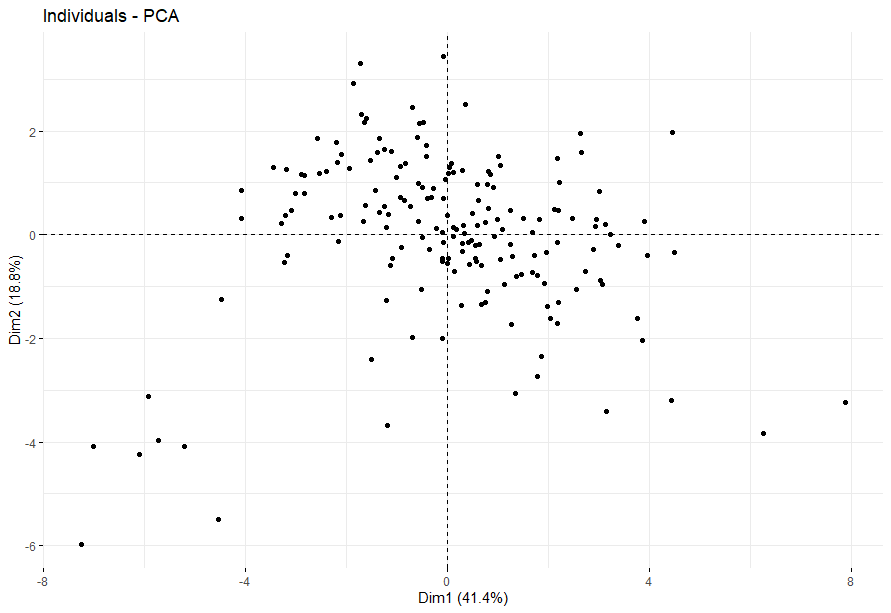
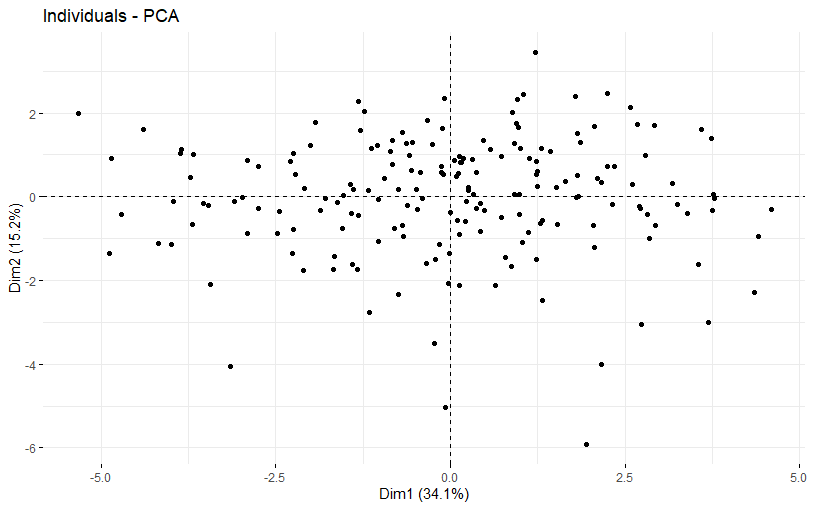
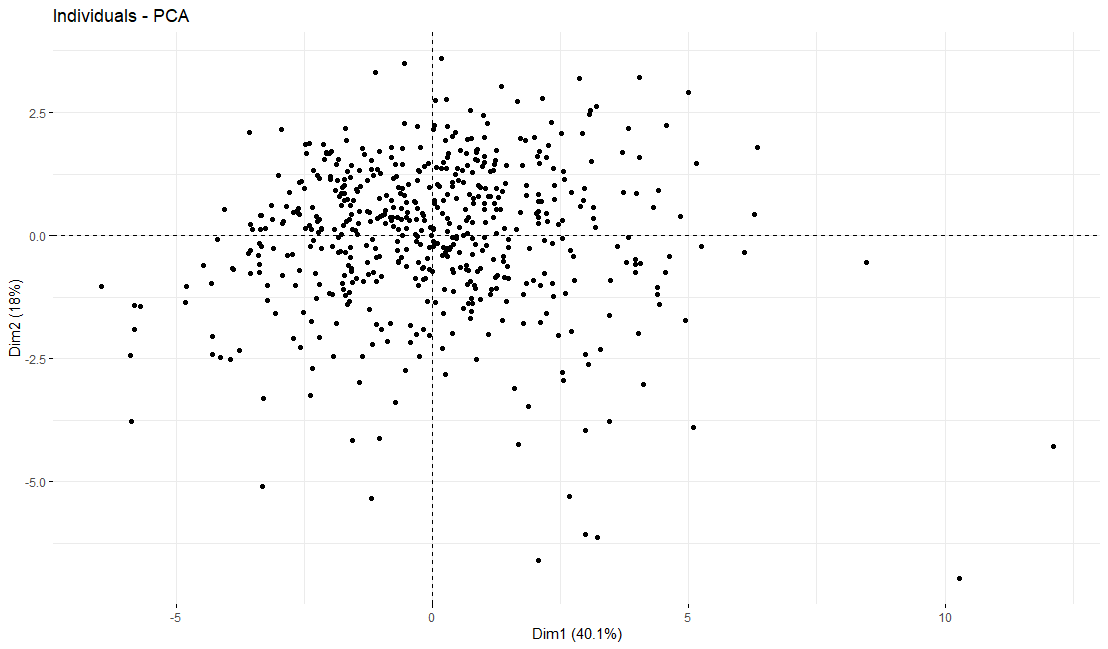
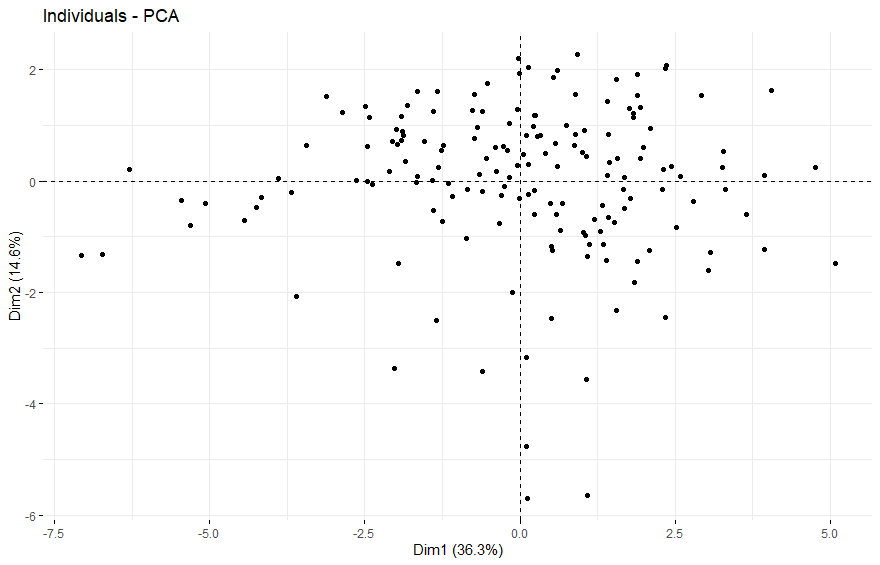
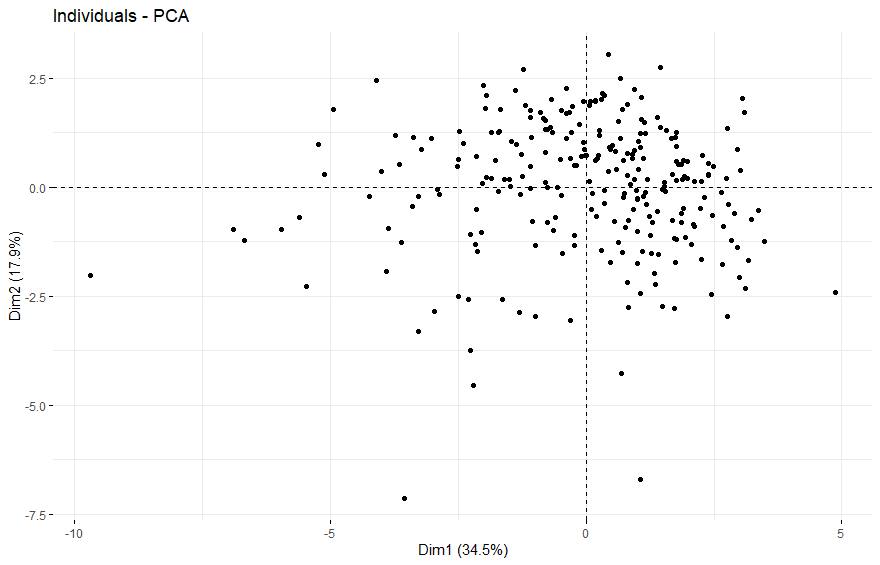
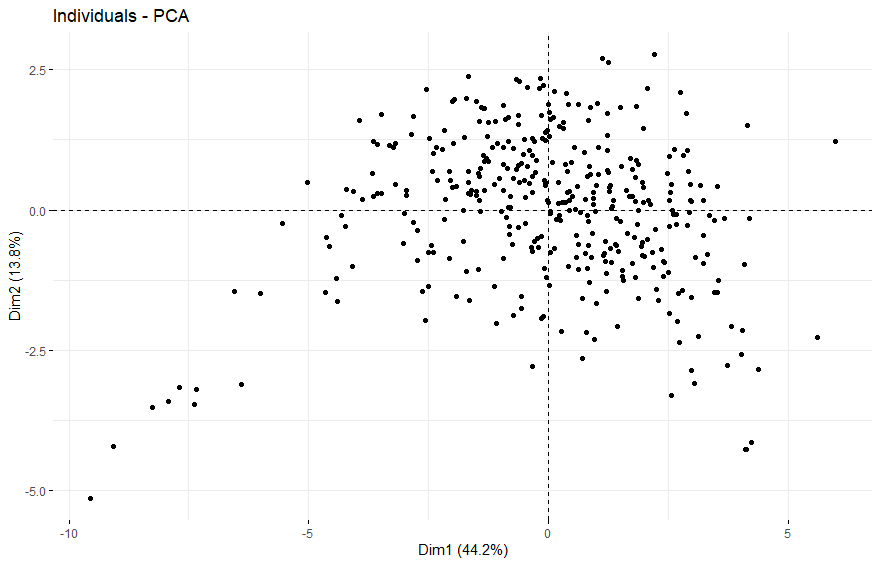
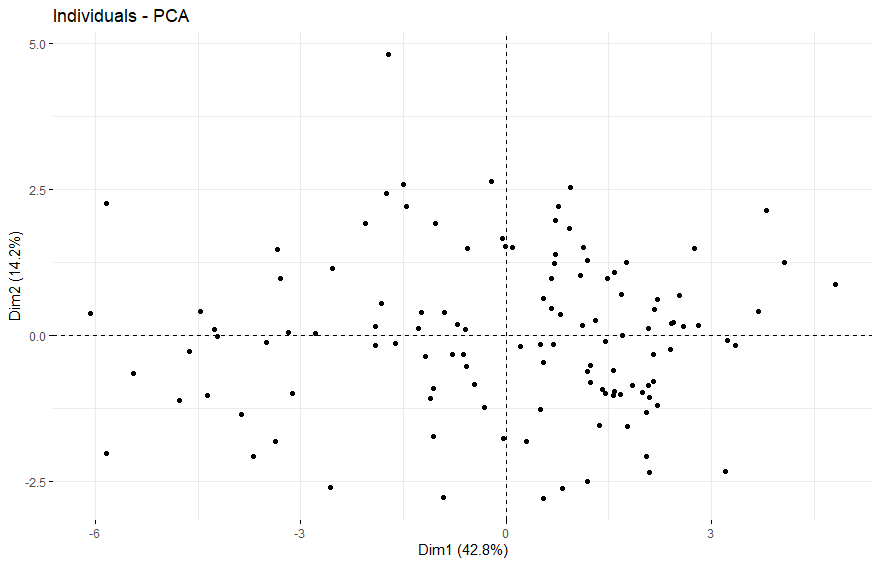
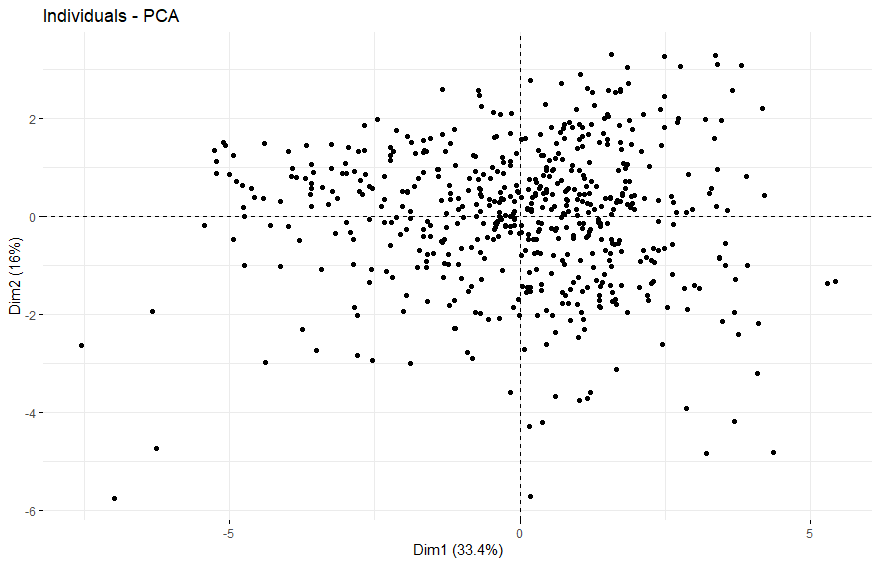
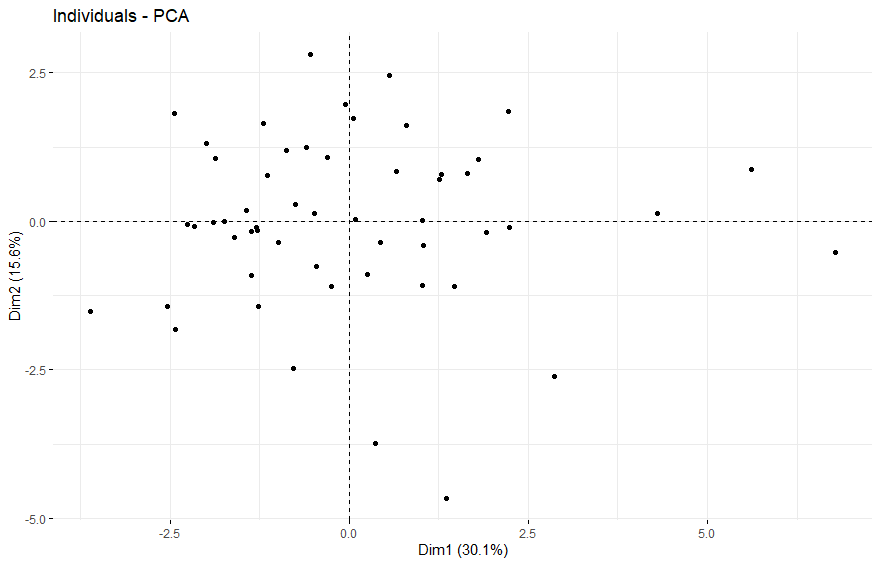
- PCA将样本分成四组
- 一套流程
- Ovarian Cancer (OV)
- Head and Neck Cancer (HNSC)
- Acute Myeloid Leukemia (LAML)
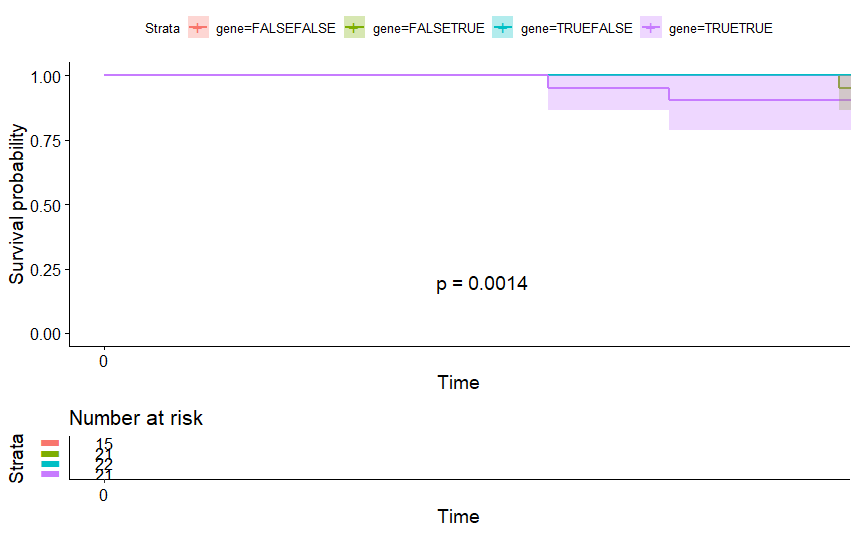
- Adrenocortical Cancer (ACC) (p=0.0014)
- Bile Duct Cancer (CHOL)
- Bladder Cancer (BLCA) (p=0.034)
- Breast Cancer (BRCA)
- Cervical Cancer (CESC)
- Colon Cancer (COAD)
- Endometrioid Cancer (UCEC)
- Esophageal Cancer (ESCA)
- Glioblastoma (GBM)
- Kidney Chromophobe (KICH) (14 datasets)
- Kidney Clear Cell Carcinoma (KIRC)
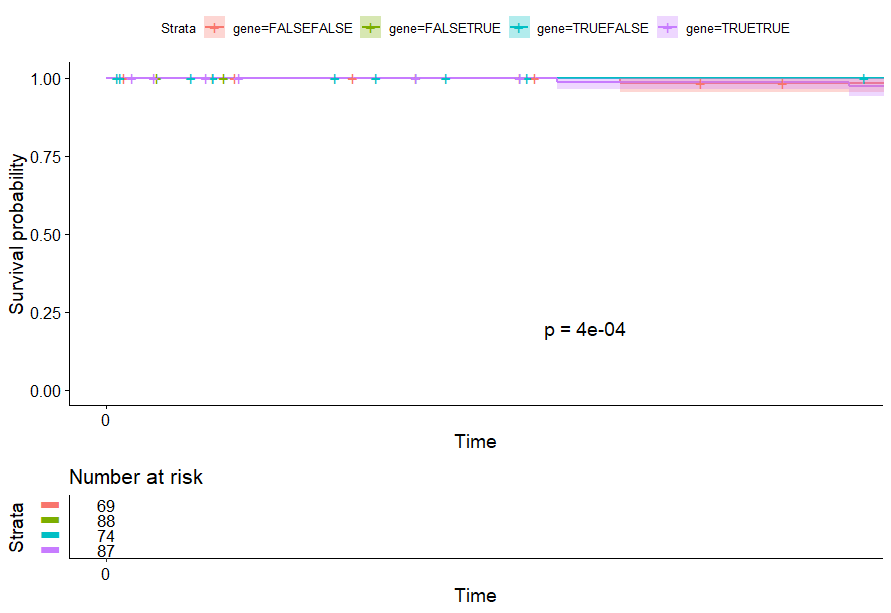
- Kidney Papillary Cell Carcinoma (KIRP) (p=4e-04)
- Large B-cell Lymphoma (DLBC)
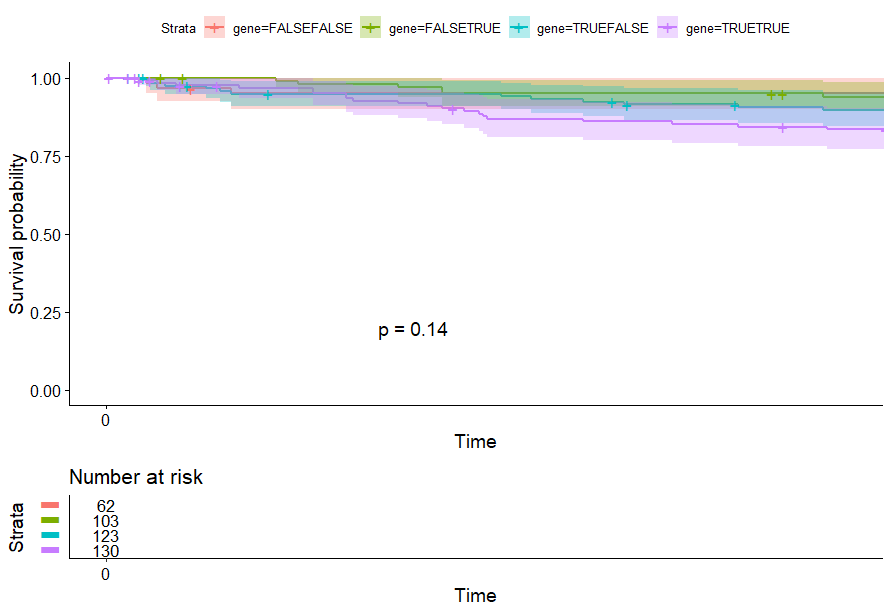
- Liver Cancer (LIHC)
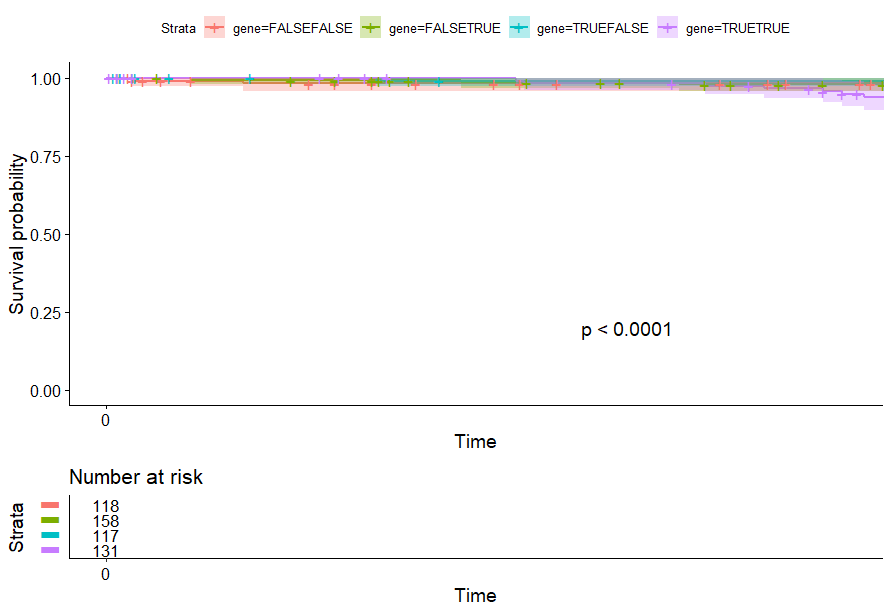
- Lower Grade Glioma (LGG) (p<0.0001)
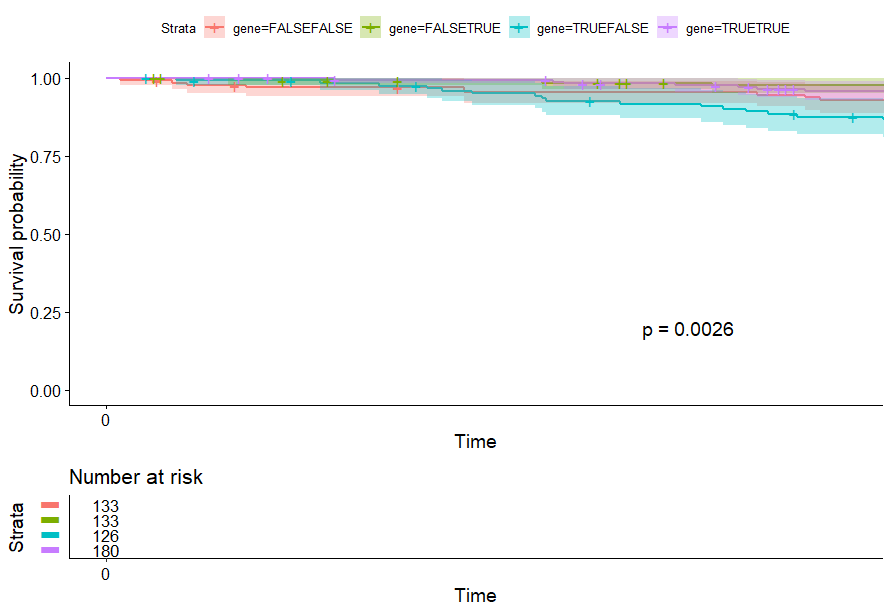
- Lung Adenocarcinoma (LUAD) (p=0.0026)
- Lung Squamous Cell Carcinoma (LUSC)
- Melanoma (SKCM)
- Mesothelioma (MESO) (p<0.0001)
- Ocular melanomas (UVM)
- Pancreatic Cancer (PAAD)
- Pheochromocytoma & Paraganglioma (PCPG)
- Prostate Cancer (PRAD)
- Rectal Cancer (READ)
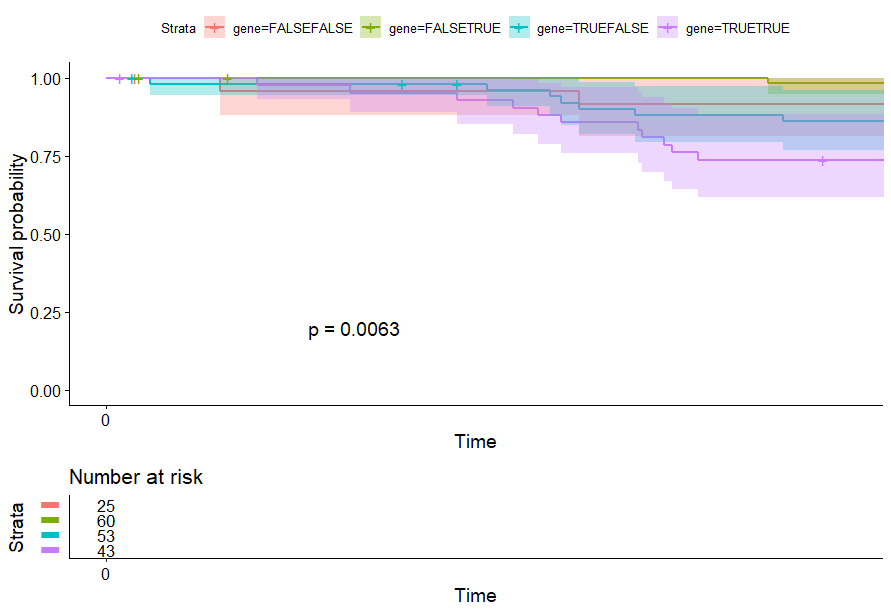
- Sarcoma (SARC) (p=0.0073)
- Stomach Cancer (STAD)
- Testicular Cancer (TGCT)
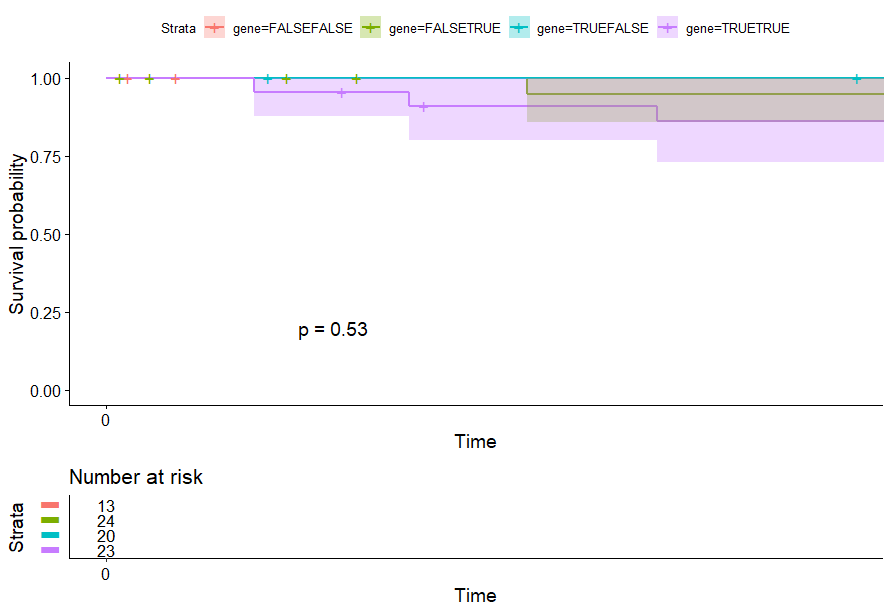
- Thymoma (THYM) (p=0.023)
- Thyroid Cancer (THCA)
- Uterine Carcinosarcoma (UCS)
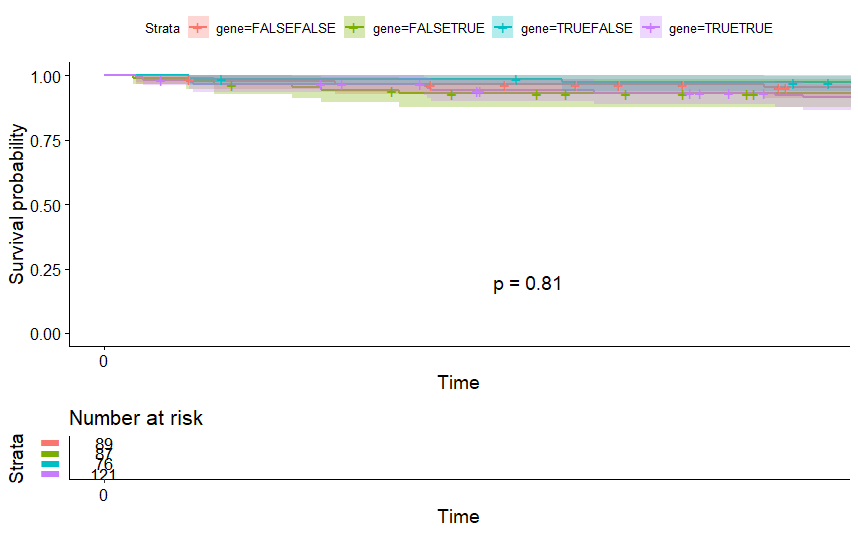
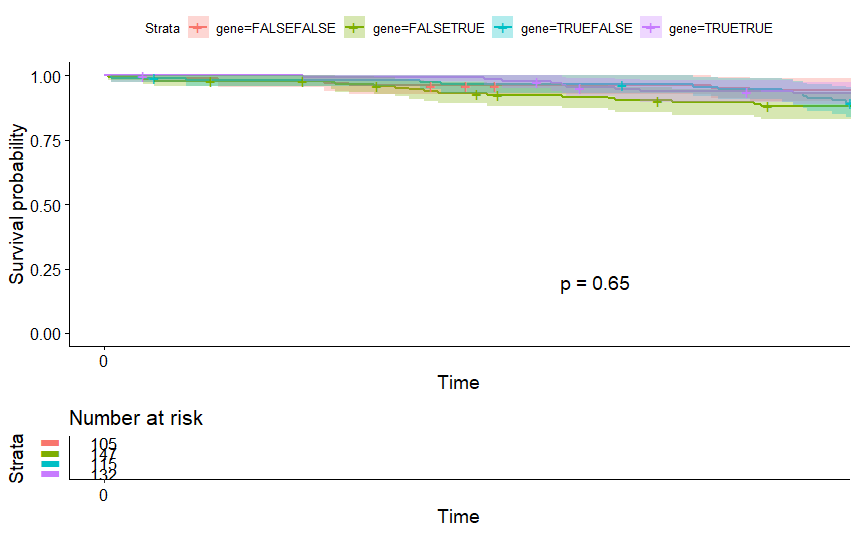
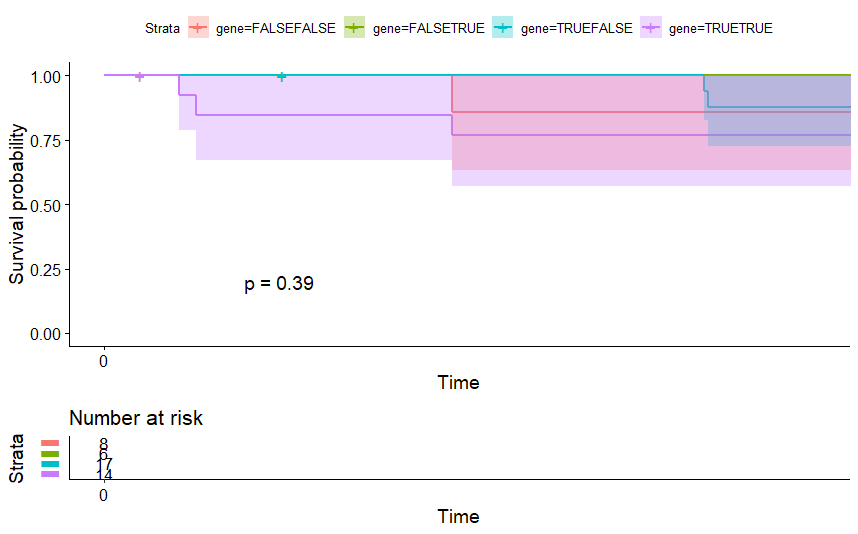
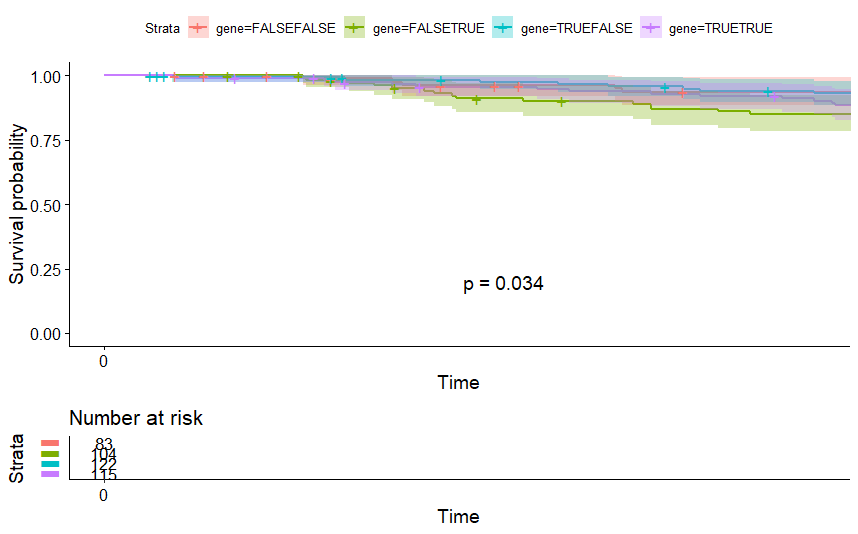
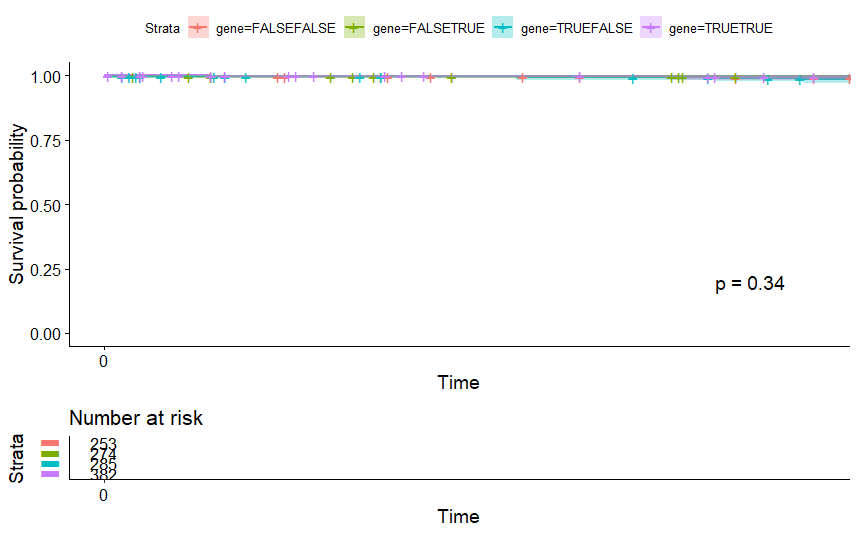
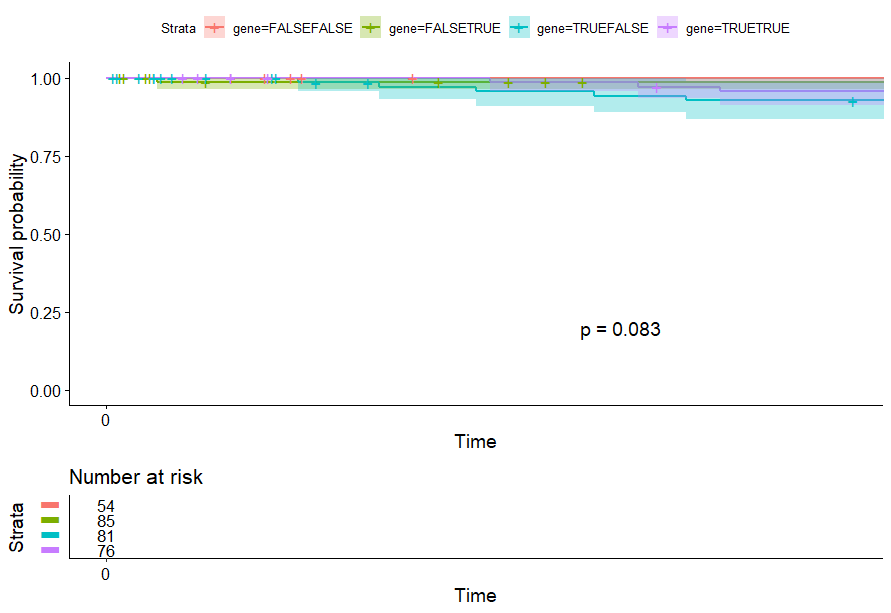
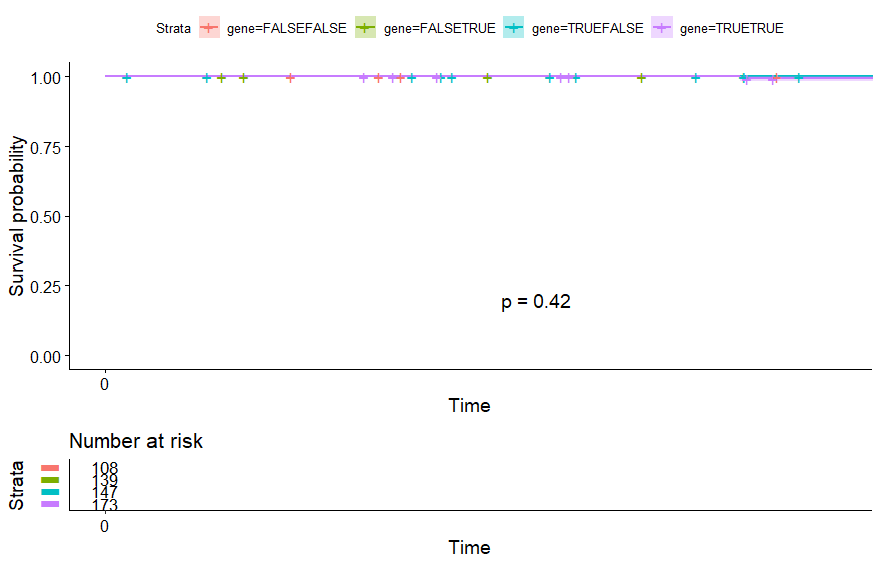
signature 生存分析 p<0.05 的癌症:ACC、KIRP、LGG、LUAD、MESO、SARC、THYM
PCA将样本分成四组
sigs <- t(expr[c("CYP4B1","ADH1B","IL33","CD1D","CR1","CABCOCO1","TCEAL2","ID1","CDC45","ANLN","CDCA2","PRC1","TOP2A"),])
一套流程
rm(list = ls())### exprexpr <- read.table('TCGA-DLBC.htseq_counts.tsv/TCGA-DLBC.htseq_counts.tsv',header = T,sep='\t')tail(expr[,1])expr <- expr[1:(nrow(expr)-5),]expr[,1] <- as.character(expr[,1])for (i in 1:nrow(expr)) {expr[i,1] <- strsplit(expr[i,1],"\\.")[[1]][1]}symb <- AnnotationDbi::select(org.Hs.eg.db,expr[,1],"SYMBOL","ENSEMBL")symbtrim <- symb[match(unique(symb$SYMBOL),symb$SYMBOL),] %>% na.omit()row.names(expr) <- expr[,1]expr <- expr[,-1]expr <- expr[symbtrim$ENSEMBL,]row.names(expr) <- symbtrim$SYMBOLexpr <- log2(edgeR::cpm(expr)+1)# kp <- substring(colnames(expr),14,15)=='01';table(kp)# expr <- expr[,kp]dim(expr)### phephe <- read.table('./TCGA-DLBC.survival.tsv/TCGA-DLBC.survival.tsv',header = T,sep='\t',fill = T,quote = "")phe$sample = gsub('-','.',phe$sample)row.names(phe) <- phe[,1]# phe <- phe[substring(phe$sample,14,15)=='01',]id <- intersect(colnames(expr),rownames(phe))expr <- expr[,id]phe <- phe[id,]dim(phe)dim(expr)sigs <- t(expr[c("CYP4B1","ADH1B","IL33","CD1D","CR1","CABCOCO1","TCEAL2","ID1","CDC45","ANLN","CDCA2","PRC1","TOP2A"),])## 这里如果不做转置,pca会根据13个基因来分组library("FactoMineR")library("factoextra")dat.pca <- PCA(sigs, graph = FALSE)fviz_pca_ind(dat.pca,geom.ind = "point")table(as.data.frame(dat.pca$ind$coord[,1:2]>0))phe$pc1=dat.pca$ind$coord[,1]>0phe$pc2=dat.pca$ind$coord[,2]>0phe$gene=paste0(phe$pc1,phe$pc2)library(survival)library(survminer)fit <- survfit(Surv(OS.time, OS) ~ gene,data = phe)ggsurvplot(fit, # survfit object with calculated statistics.risk.table = TRUE, # show risk table.pval = TRUE, # show p-value of log-rank test.conf.int = TRUE, # show confidence intervals for# point estimaes of survival curves.xlim = c(0,200), # present narrower X axis, but not affect# survival estimates.risk.table.y.text.col = T, # colour risk table text annotations.risk.table.y.text = FALSE # show bars instead of names in text annotations# in legend of risk table)
Ovarian Cancer (OV)
table(as.data.frame(dat.pca$ind$coord[,1:2]>0))# Dim.2# Dim.1 FALSE TRUE# FALSE 89 88# TRUE 76 121
Head and Neck Cancer (HNSC)
table(as.data.frame(dat.pca$ind$coord[,1:2]>0))# Dim.2# Dim.1 FALSE TRUE# FALSE 105 148# TRUE 115 132
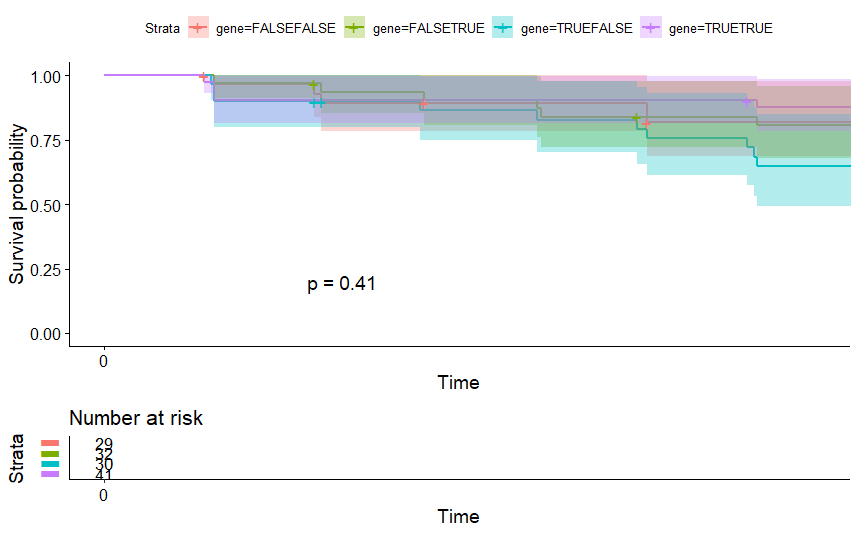
Acute Myeloid Leukemia (LAML)
table(as.data.frame(dat.pca$ind$coord[,1:2]>0))# Dim.2# Dim.1 FALSE TRUE# FALSE 29 32# TRUE 30 41
Adrenocortical Cancer (ACC) (p=0.0014)
table(as.data.frame(dat.pca$ind$coord[,1:2]>0))# Dim.2# Dim.1 FALSE TRUE# FALSE 15 21# TRUE 22 21
Bile Duct Cancer (CHOL)
table(as.data.frame(dat.pca$ind$coord[,1:2]>0))# Dim.2# Dim.1 FALSE TRUE# FALSE 8 6# TRUE 17 14
Bladder Cancer (BLCA) (p=0.034)
table(as.data.frame(dat.pca$ind$coord[,1:2]>0))# Dim.2# Dim.1 FALSE TRUE# FALSE 83 104# TRUE 122 115
Breast Cancer (BRCA)
table(as.data.frame(dat.pca$ind$coord[,1:2]>0))# Dim.2# Dim.1 FALSE TRUE# FALSE 253 274# TRUE 285 382
Cervical Cancer (CESC)
table(as.data.frame(dat.pca$ind$coord[,1:2]>0))# Dim.2# Dim.1 FALSE TRUE# FALSE 54 85# TRUE 81 76
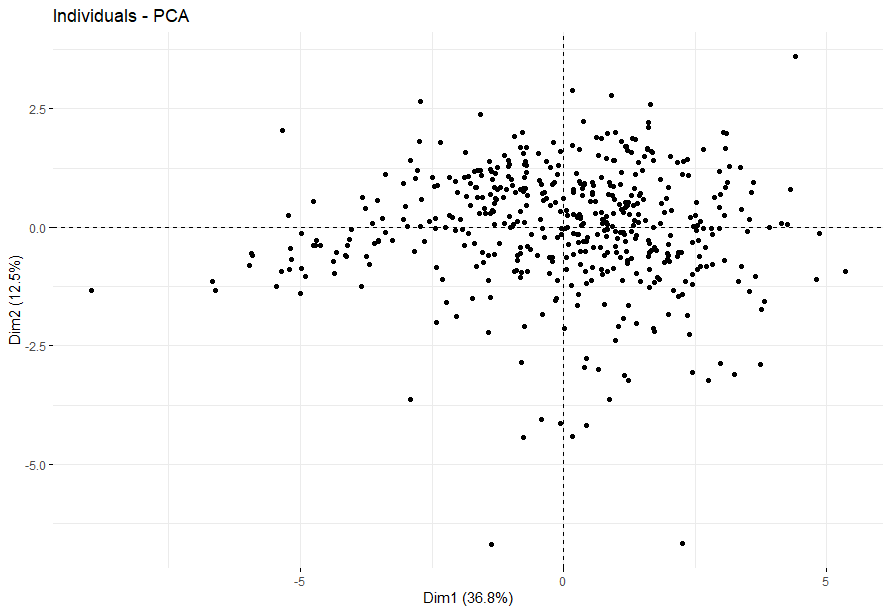
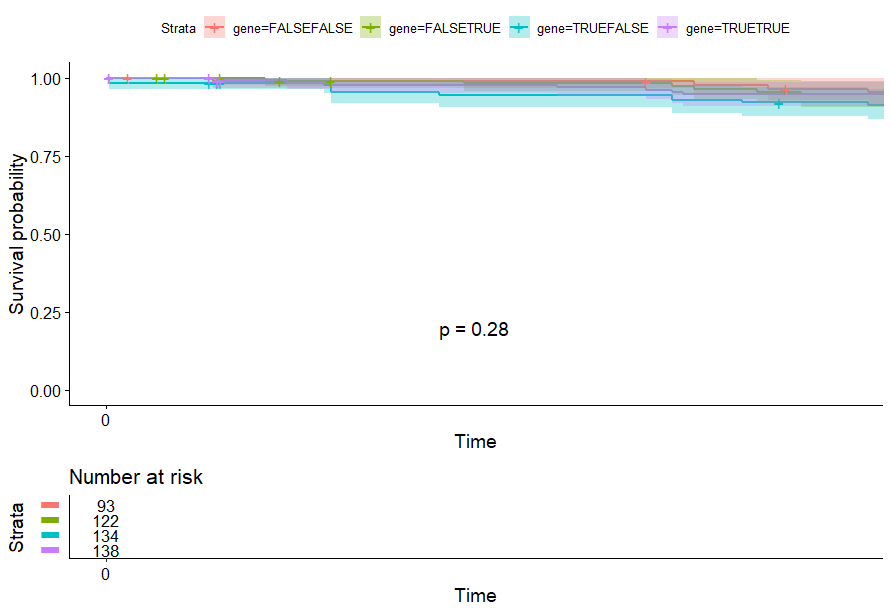
Colon Cancer (COAD)
table(as.data.frame(dat.pca$ind$coord[,1:2]>0))# Dim.2# Dim.1 FALSE TRUE# FALSE 93 122# TRUE 134 138
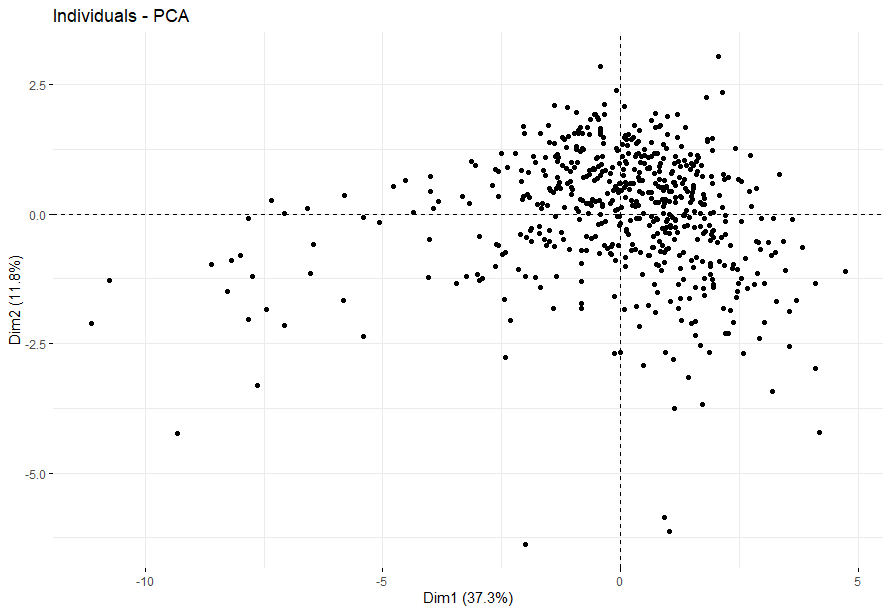
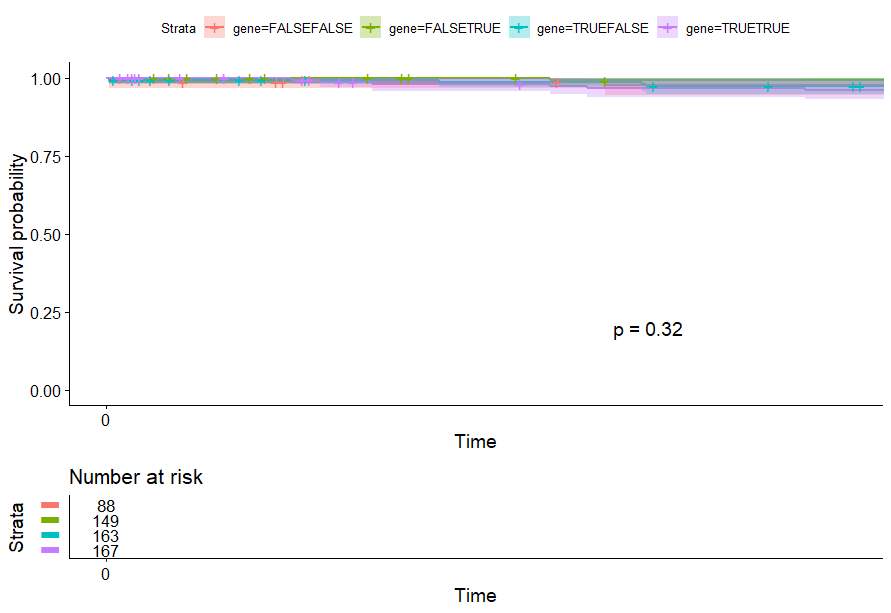
Endometrioid Cancer (UCEC)
table(as.data.frame(dat.pca$ind$coord[,1:2]>0))# Dim.2# Dim.1 FALSE TRUE# FALSE 88 149# TRUE 163 167
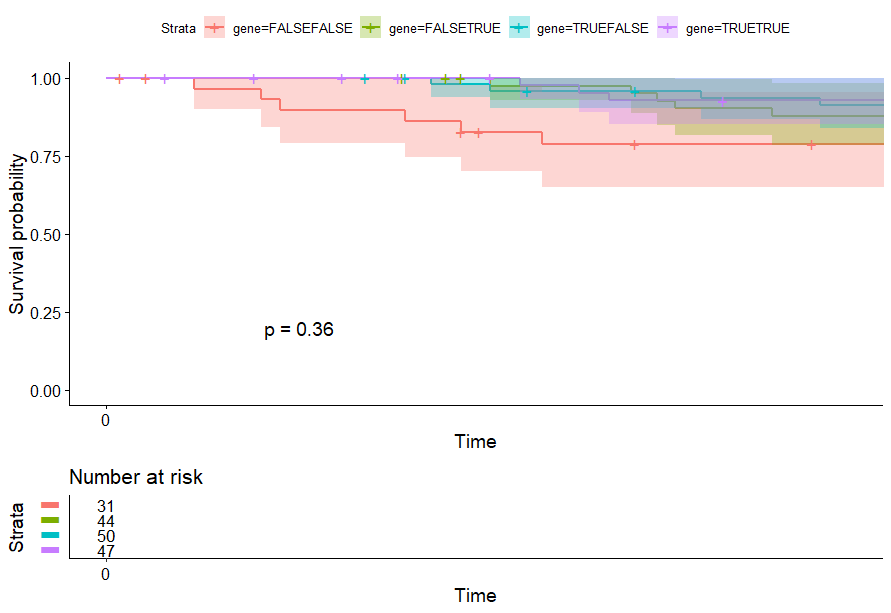
Esophageal Cancer (ESCA)
table(as.data.frame(dat.pca$ind$coord[,1:2]>0))# Dim.2# Dim.1 FALSE TRUE# FALSE 31 44# TRUE 50 47
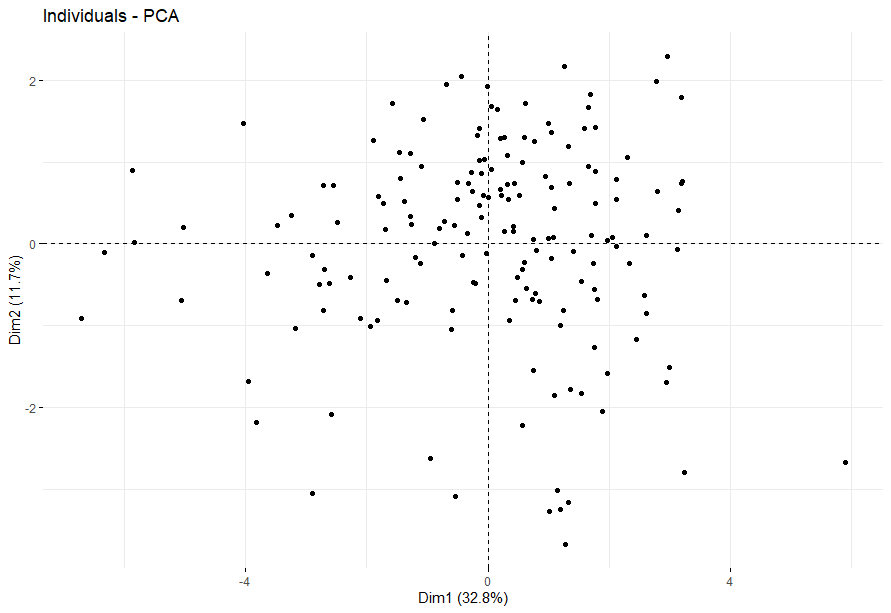
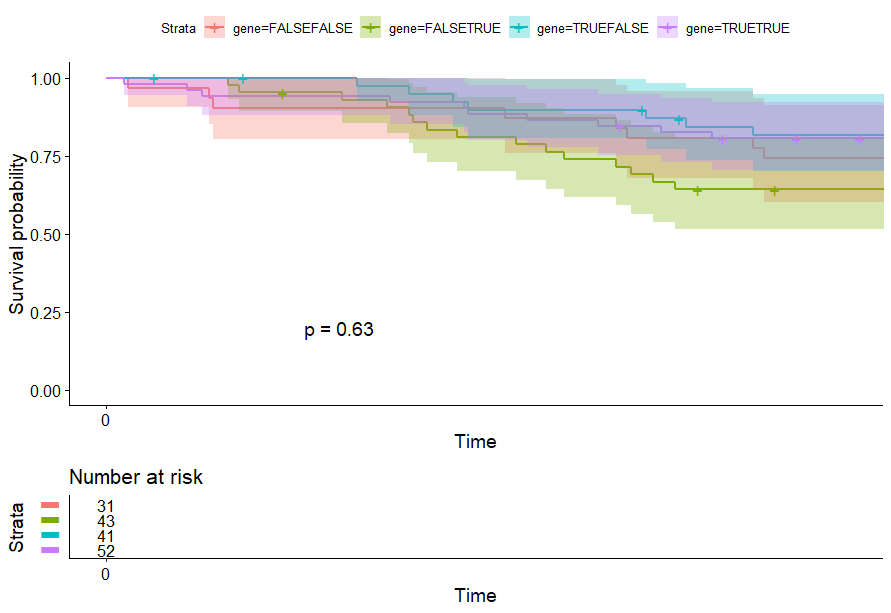
Glioblastoma (GBM)
table(as.data.frame(dat.pca$ind$coord[,1:2]>0))# Dim.2# Dim.1 FALSE TRUE# FALSE 31 43# TRUE 41 52
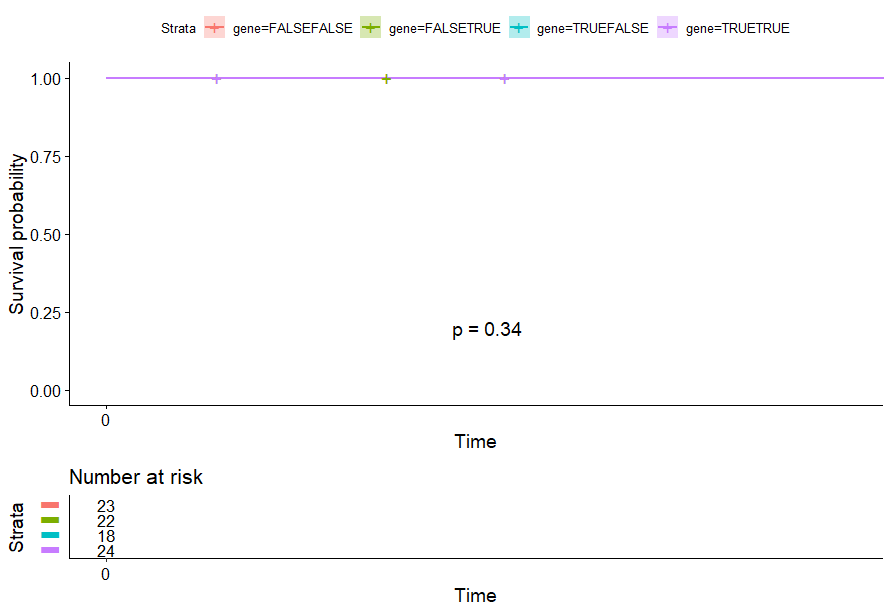
Kidney Chromophobe (KICH) (14 datasets)
table(as.data.frame(dat.pca$ind$coord[,1:2]>0))# Dim.2# Dim.1 FALSE TRUE# FALSE 23 22# TRUE 18 24
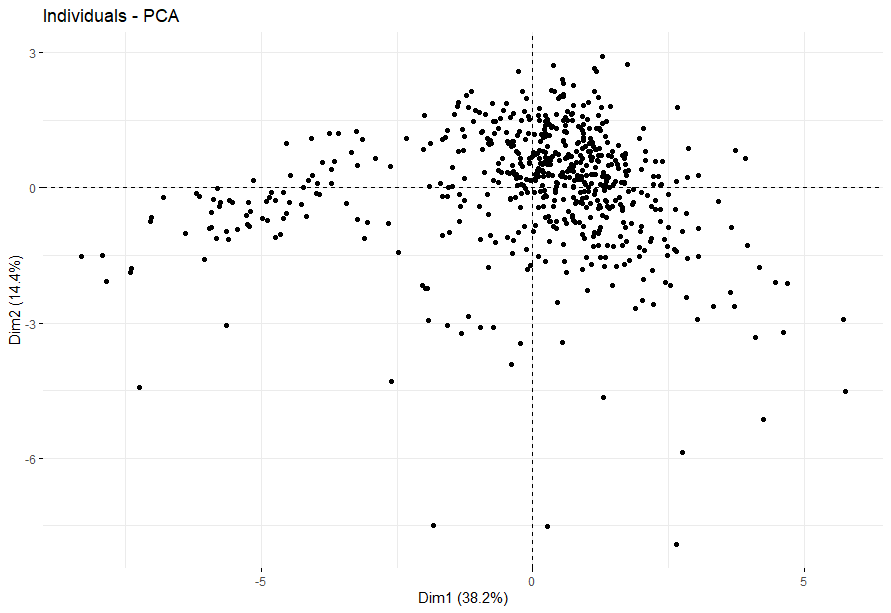
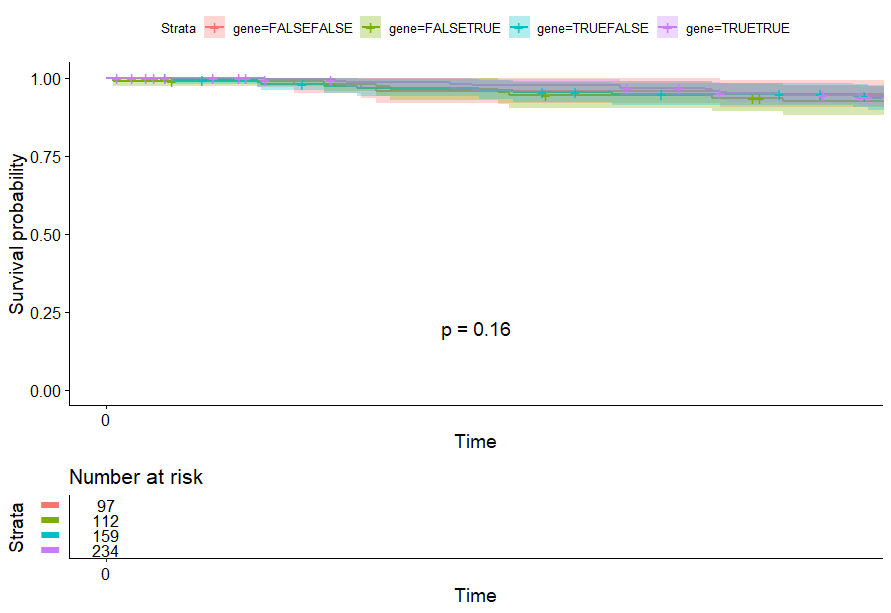
Kidney Clear Cell Carcinoma (KIRC)
table(as.data.frame(dat.pca$ind$coord[,1:2]>0))# Dim.2# Dim.1 FALSE TRUE# FALSE 97 112# TRUE 159 234
Kidney Papillary Cell Carcinoma (KIRP) (p=4e-04)
table(as.data.frame(dat.pca$ind$coord[,1:2]>0))# Dim.2# Dim.1 FALSE TRUE# FALSE 69 88# TRUE 74 87
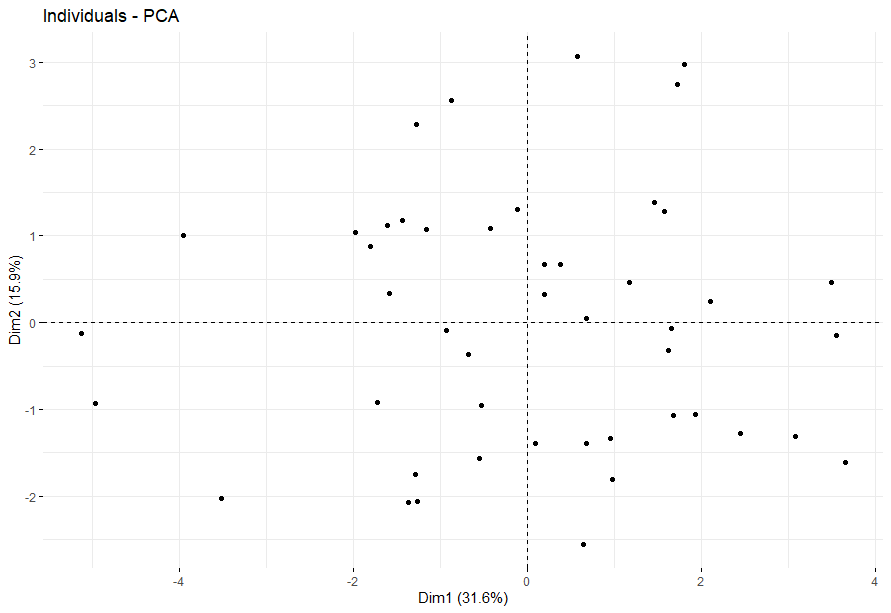
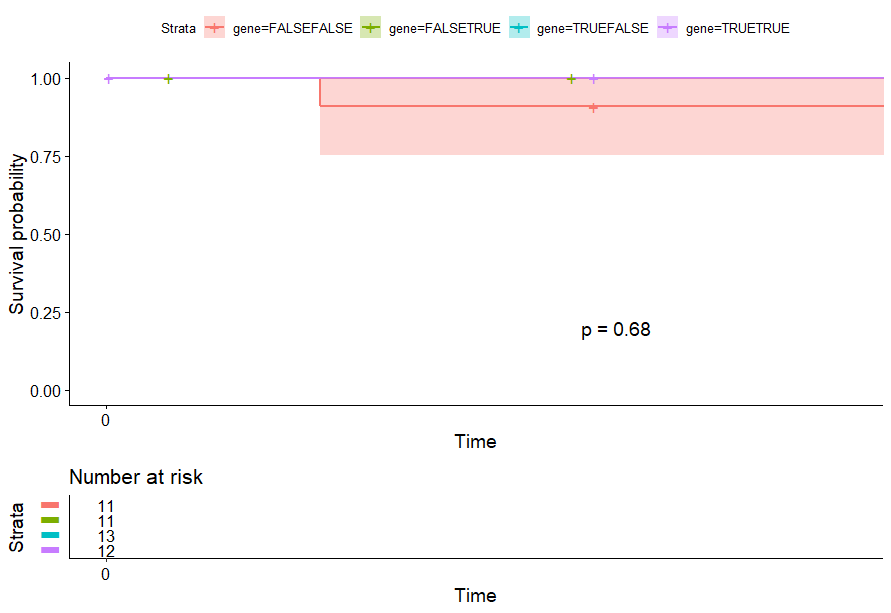
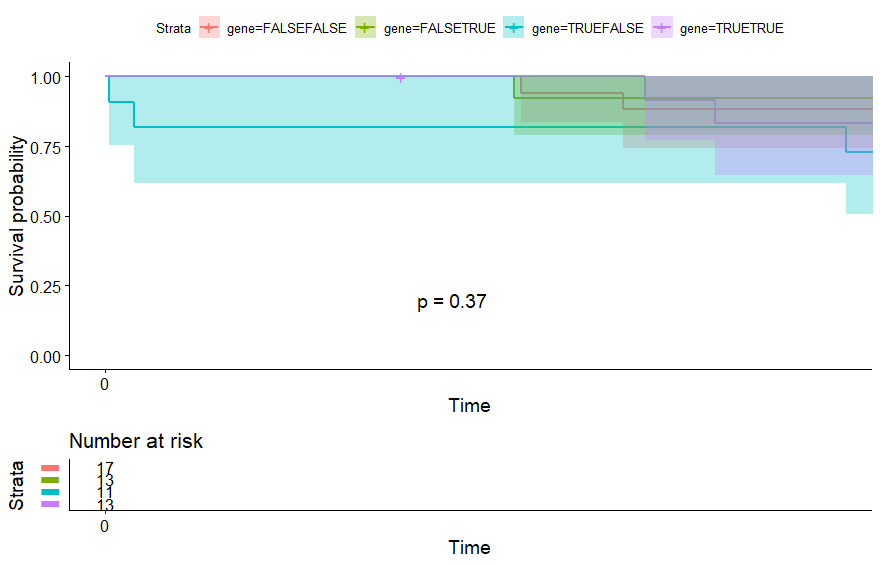
Large B-cell Lymphoma (DLBC)
table(as.data.frame(dat.pca$ind$coord[,1:2]>0))# Dim.2# Dim.1 FALSE TRUE# FALSE 11 11# TRUE 13 12
Liver Cancer (LIHC)
table(as.data.frame(dat.pca$ind$coord[,1:2]>0))# Dim.2# Dim.1 FALSE TRUE# FALSE 62 103# TRUE 123 130
Lower Grade Glioma (LGG) (p<0.0001)
table(as.data.frame(dat.pca$ind$coord[,1:2]>0))# Dim.2# Dim.1 FALSE TRUE# FALSE 118 158# TRUE 117 131
Lung Adenocarcinoma (LUAD) (p=0.0026)
table(as.data.frame(dat.pca$ind$coord[,1:2]>0))# Dim.2# Dim.1 FALSE TRUE# FALSE 133 133# TRUE 126 180
Lung Squamous Cell Carcinoma (LUSC)
table(as.data.frame(dat.pca$ind$coord[,1:2]>0))# Dim.2# Dim.1 FALSE TRUE# FALSE 69 136# TRUE 150 187

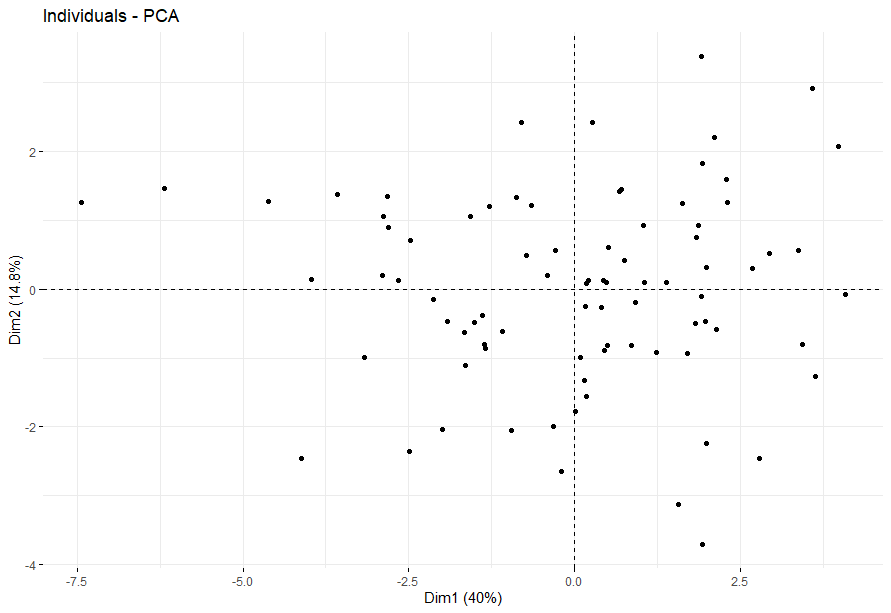
Melanoma (SKCM)
table(as.data.frame(dat.pca$ind$coord[,1:2]>0))# Dim.2# Dim.1 FALSE TRUE# FALSE 94 128# TRUE 106 130
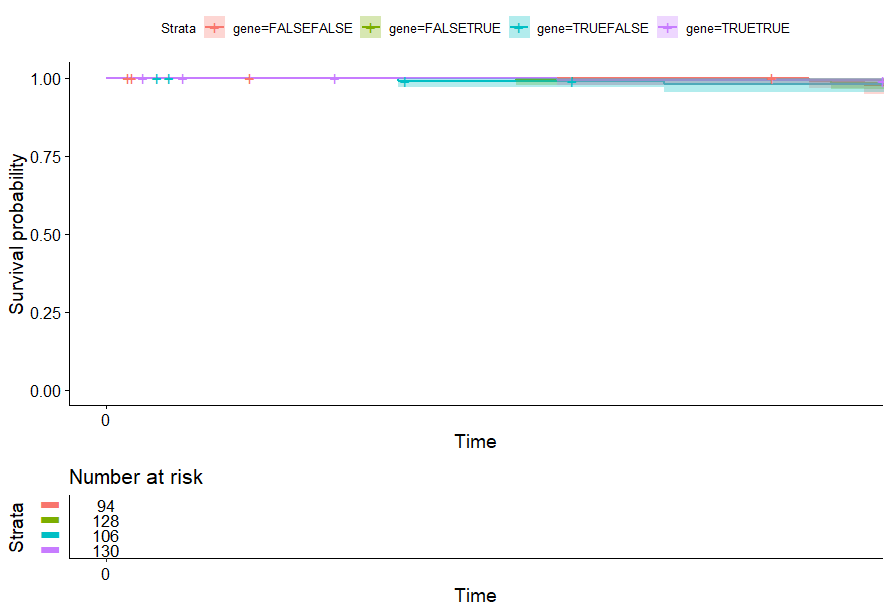
不知道为什么不显示p值…
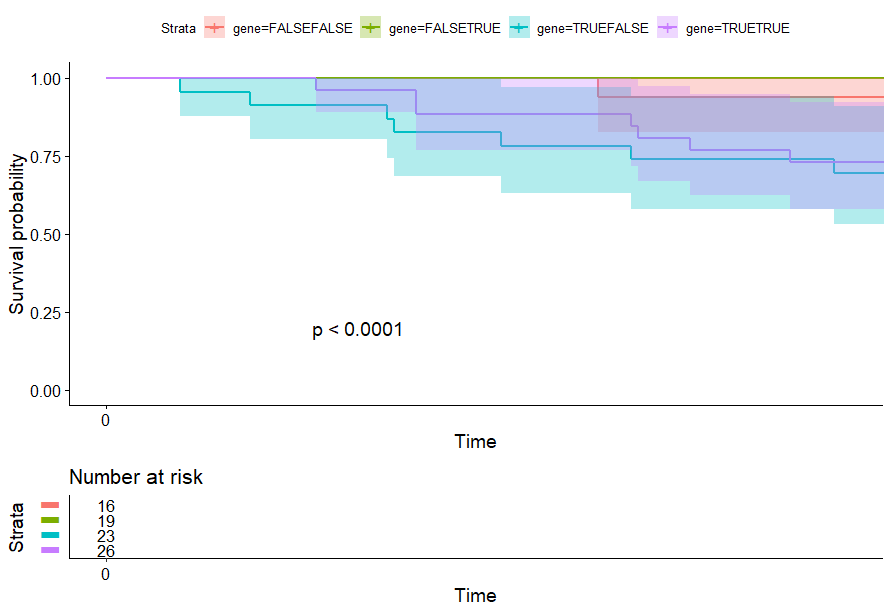
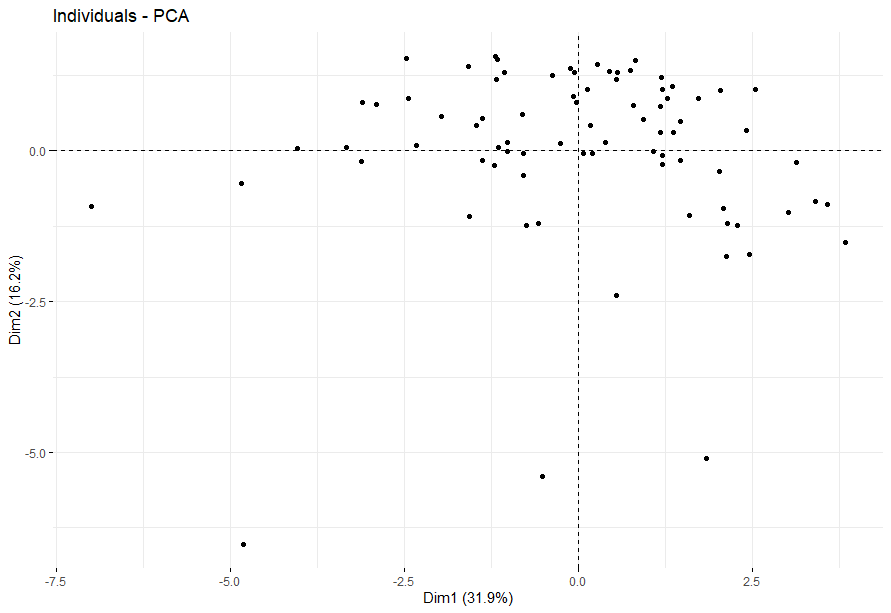
Mesothelioma (MESO) (p<0.0001)
table(as.data.frame(dat.pca$ind$coord[,1:2]>0))# Dim.2# Dim.1 FALSE TRUE# FALSE 16 19# TRUE 23 26
Ocular melanomas (UVM)
table(as.data.frame(dat.pca$ind$coord[,1:2]>0))# Dim.2# Dim.1 FALSE TRUE# FALSE 13 24# TRUE 20 23
Pancreatic Cancer (PAAD)
table(as.data.frame(dat.pca$ind$coord[,1:2]>0))# Dim.2# Dim.1 FALSE TRUE# FALSE 25 60# TRUE 53 43
Pheochromocytoma & Paraganglioma (PCPG)
table(as.data.frame(dat.pca$ind$coord[,1:2]>0))# Dim.2# Dim.1 FALSE TRUE# FALSE 46 43# TRUE 43 54
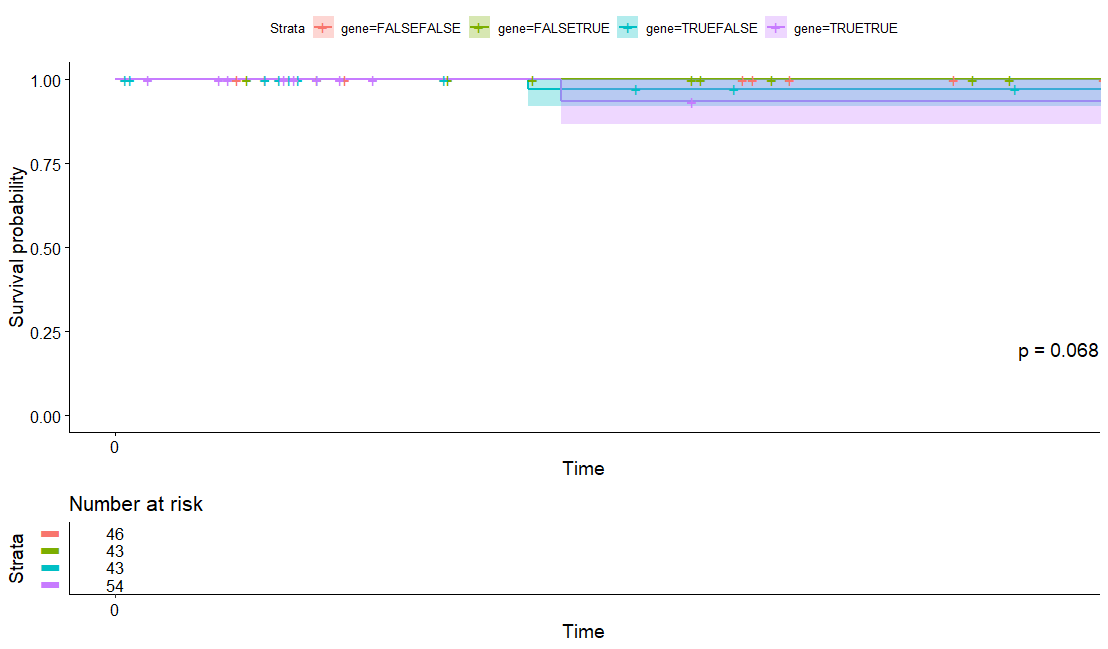
Prostate Cancer (PRAD)
table(as.data.frame(dat.pca$ind$coord[,1:2]>0))# Dim.2# Dim.1 FALSE TRUE# FALSE 125 152# TRUE 123 151
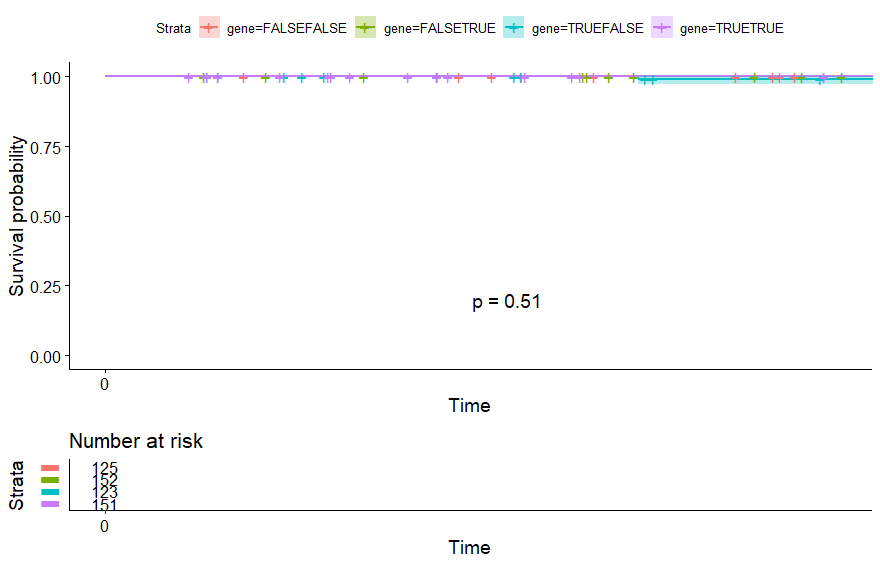
Rectal Cancer (READ)
table(as.data.frame(dat.pca$ind$coord[,1:2]>0))# Dim.2# Dim.1 FALSE TRUE# FALSE 29 46# TRUE 43 49
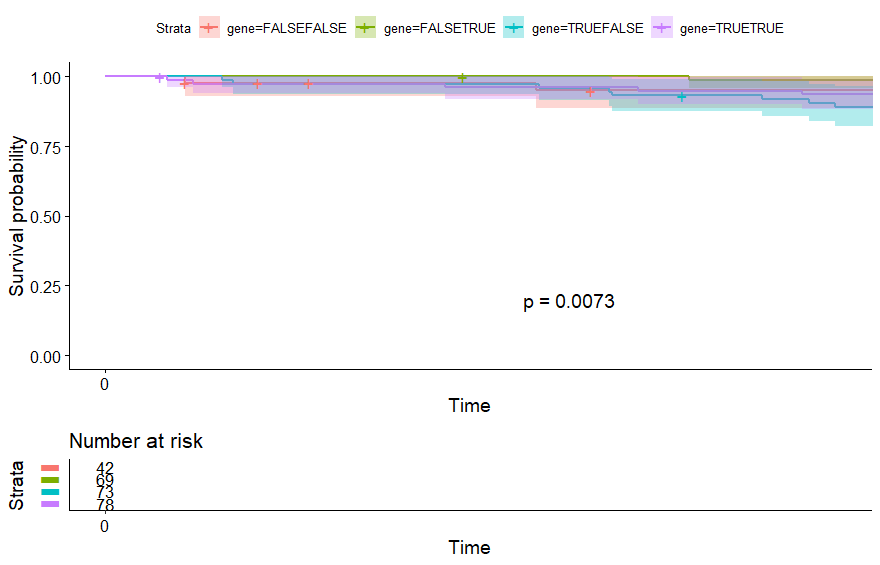
Sarcoma (SARC) (p=0.0073)
table(as.data.frame(dat.pca$ind$coord[,1:2]>0))# Dim.2# Dim.1 FALSE TRUE# FALSE 42 69# TRUE 73 78
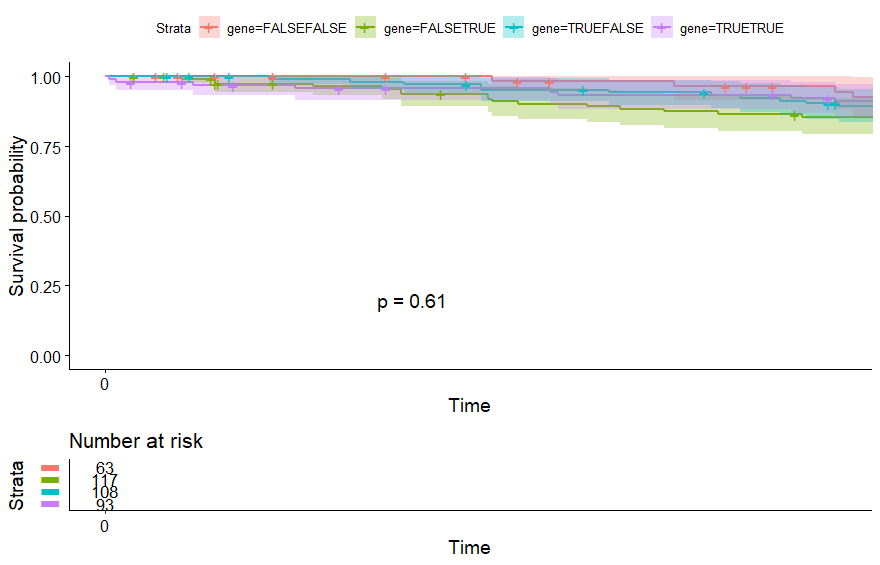
Stomach Cancer (STAD)
table(as.data.frame(dat.pca$ind$coord[,1:2]>0))# Dim.2# Dim.1 FALSE TRUE# FALSE 63 117# TRUE 108 93

Testicular Cancer (TGCT)
table(as.data.frame(dat.pca$ind$coord[,1:2]>0))# Dim.2# Dim.1 FALSE TRUE# FALSE 63 117# TRUE 108 93

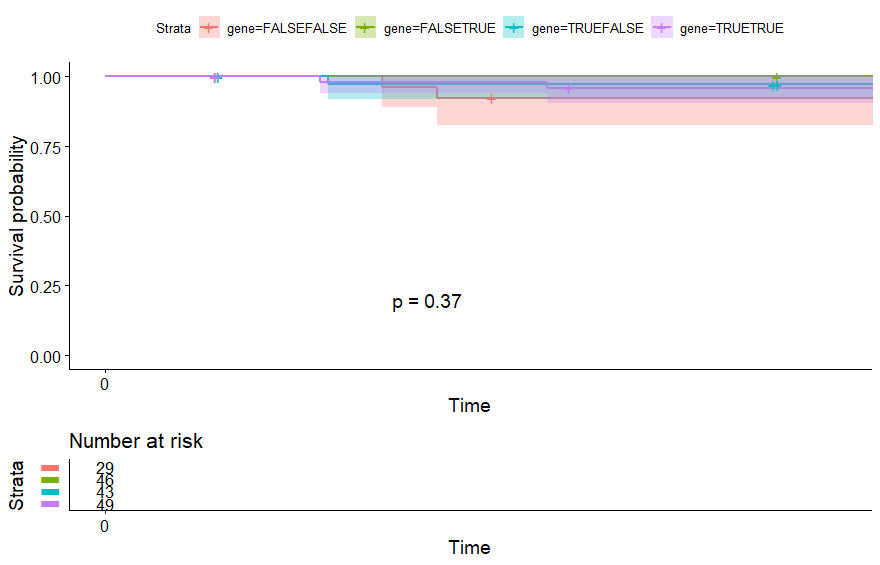
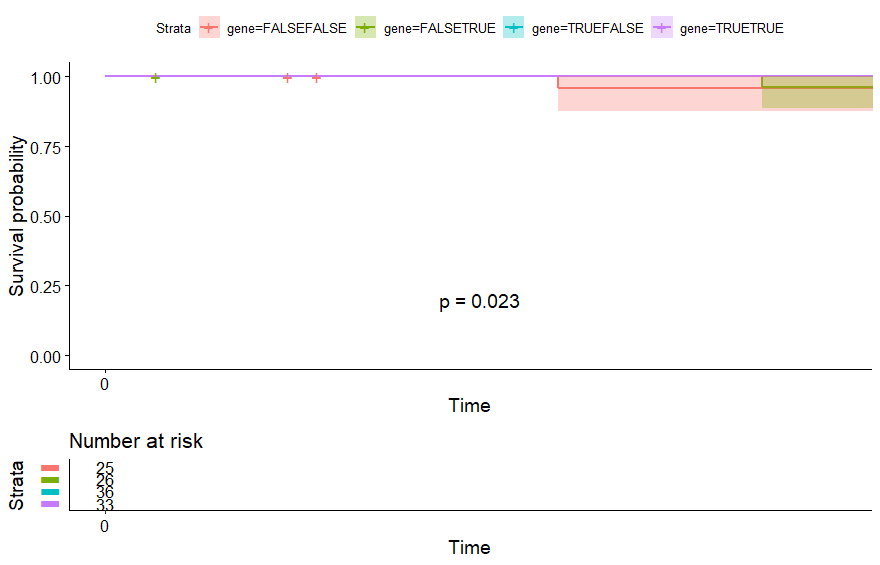
Thymoma (THYM) (p=0.023)
table(as.data.frame(dat.pca$ind$coord[,1:2]>0))# Dim.2# Dim.1 FALSE TRUE# FALSE 25 26# TRUE 36 33
Thyroid Cancer (THCA)
table(as.data.frame(dat.pca$ind$coord[,1:2]>0))# Dim.2# Dim.1 FALSE TRUE# FALSE 108 139# TRUE 147 173
Uterine Carcinosarcoma (UCS)
table(as.data.frame(dat.pca$ind$coord[,1:2]>0))# Dim.2# Dim.1 FALSE TRUE# FALSE 17 13# TRUE 11 13

若有收获,就点个赞吧
0 人点赞
