一、数据框排序
test <- iris[c(1:2,51:52,101:102),]rownames(test) =NULLtest# order 可以给向量排序,也可以给数据框排序。x[order(x)]sort(test$Sepal.Length) #对某列排序test$Sepal.Length[order(test$Sepal.Length)] #全部排列test[order(test$Sepal.Length),] #对所有列进行排序,默认升序test[order(test$Sepal.Length,decreasing = T),] #对所有列进行降序排列# arrange,更加灵活的排序,整行移动,不加引号library(dplyr)arrange(test, Sepal.Length)arrange(test, desc(Sepal.Length)) #降序排列arrange(test, desc(Sepal.Width),Sepal.Length)#先按照A排列,如果列相同,按照B列排列来自dplyr包的其他函数#mutate:新增列mutate(test,new=Sepal.Length*Sepal.Width)test$new=test$Sepal.Length*test$Sepal.Width#也能新增列#select()、filter() 筛选行、列#管道符号 %>%代表向后传递,能规避产生中间变量x1 = filter(iris,Sepal.Width>3) #筛选行x2 = select(x1,Sepal.Length,Sepal.Width)#筛选列x3=arrange(x2,Sepal.Length)#第二种方法x = iris %>%filter(Sepal.Width>3) %>%select(Sepal.Length,Sepal.Width) %>%arrange(Sepal.Length)#第三种方法arrange(select(filter(iris,Sepal.Width>3),Sepal.Length,Sepal.Width),Sepal.Length)
二、表达矩阵画箱式图
对数据格式进行更改
1、把原有的行名转变为第一列
2、转置T
3、宽变长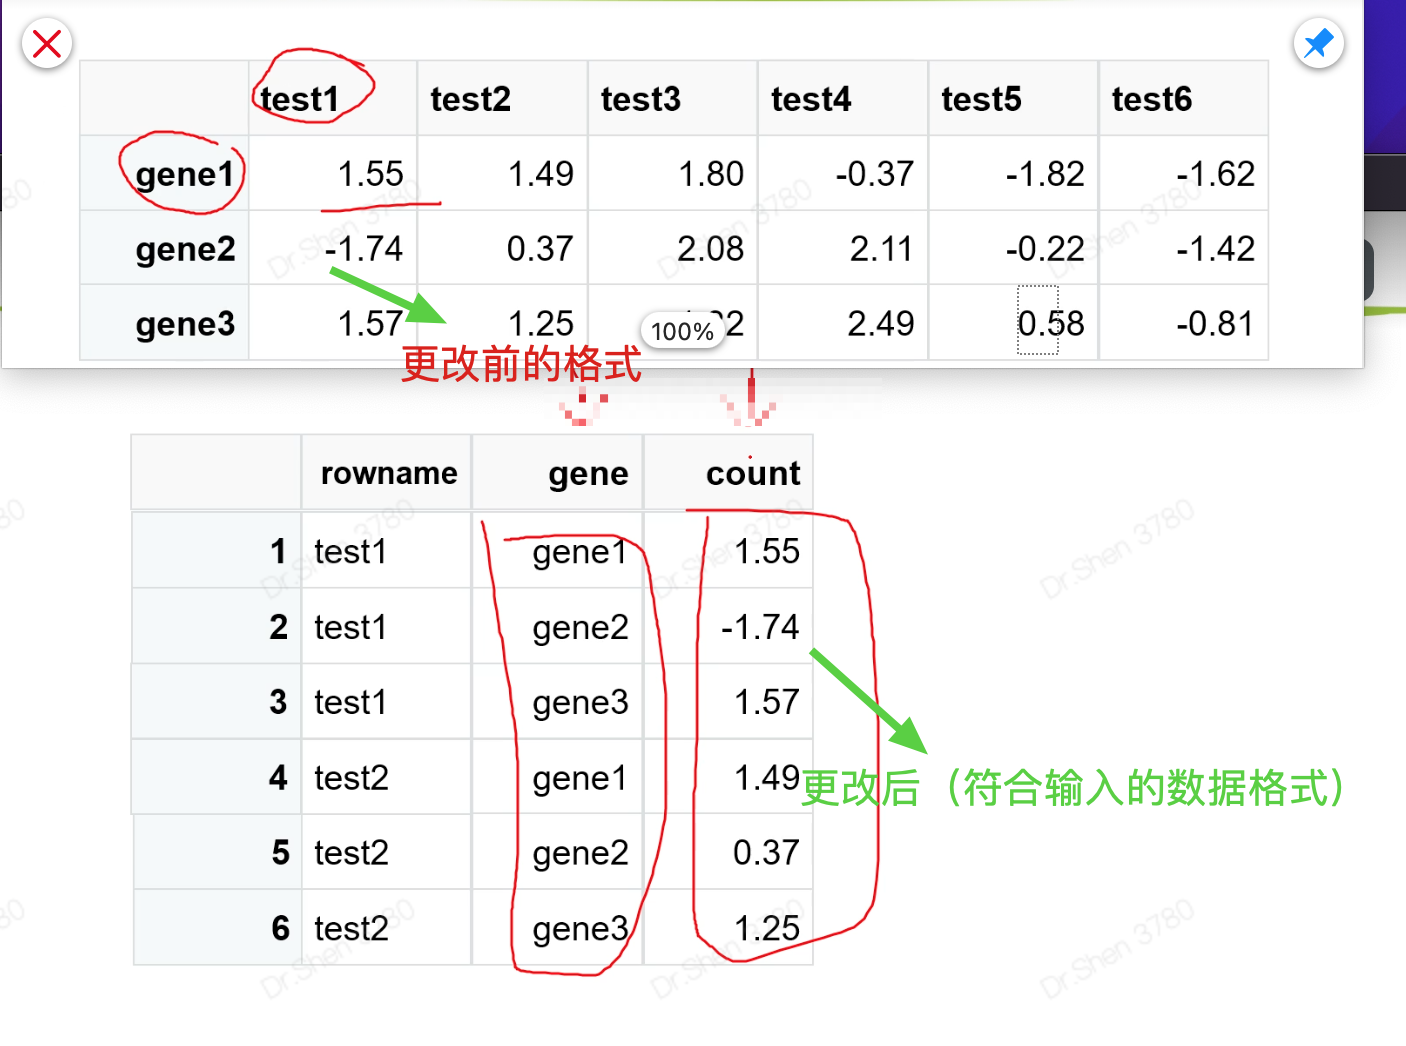
# 表达矩阵的代码操作set.seed(10086) #设定随机种子,保证随机的结果可重复exp = matrix(rnorm(18),ncol = 6)exp = round(exp,2) #保留小数点后2位数rownames(exp) = paste0("gene",1:3)colnames(exp) = paste0("test",1:6)exp[,1:3] = exp[,1:3]+1 #前三列加1explibrary(tidyr)library(tibble)library(dplyr)dat = t(exp) %>% #转制as.data.frame() %>%rownames_to_column() %>%mutate(group = rep(c("control","treat"),each = 3))pdat = dat%>%pivot_longer(cols = starts_with("gene"), #pivot,宽变长的函数names_to = "gene",values_to = "count")library(ggplot2)p = ggplot(pdat,aes(gene,count))+geom_boxplot(aes(fill = group))+theme_bw()pp + facet_wrap(~gene,scales = "free")#分为3张子图,scales 参数fixed表示固定坐标轴刻度,free表示反馈坐标轴刻度
三、连接
test1 <- data.frame(name = c('jimmy','nicker','Damon','Sophie'),blood_type = c("A","B","O","AB"))test1test2 <- data.frame(name = c('Damon','jimmy','nicker','tony'),group = c("group1","group1","group2","group2"),vision = c(4.2,4.3,4.9,4.5))test2library(dplyr)inner_join(test1,test2,by="name")#交集inner_joinleft_join(test1,test2,by="name")#左连接right_join(test1,test2,by="name")#右连接full_join(test1,test2,by="name")#全连接semi_join(test1,test2,by="name")#半连接anti_join(test1,test2,by="name")#反连接
总结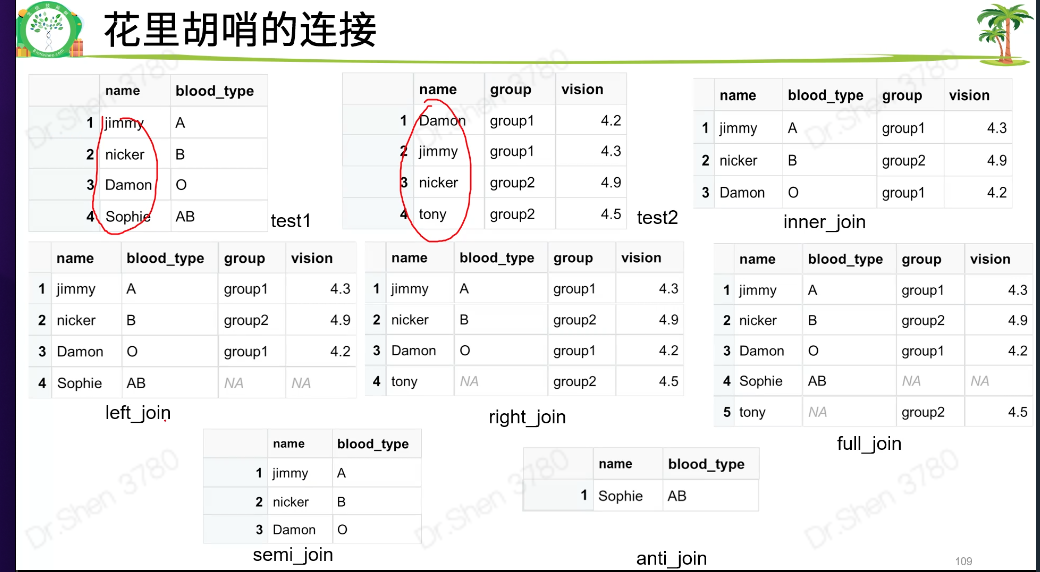
# 练习7-1# 1.加载test1.Rdata,将dat数据框按照logFC从小到大排序load("test1.Rdata")library(dplyr)arrange(dat, logFC)#注意⚠️不加引号# 2.将test1.Rdata中存放的两个数据框连接在一起,按共同的列取交集x=merge(dat,ids,by = "probe_id")#第一种方法library(dplyr)x2=inner_join(dat,ids,by = "probe_id")#第二种方法
四、字符串
常用函数
| 字符长度 | str_length(x) |
|---|---|
| 拆分 | str_split( ) |
| 按位置提取字符 | str_sub( ) |
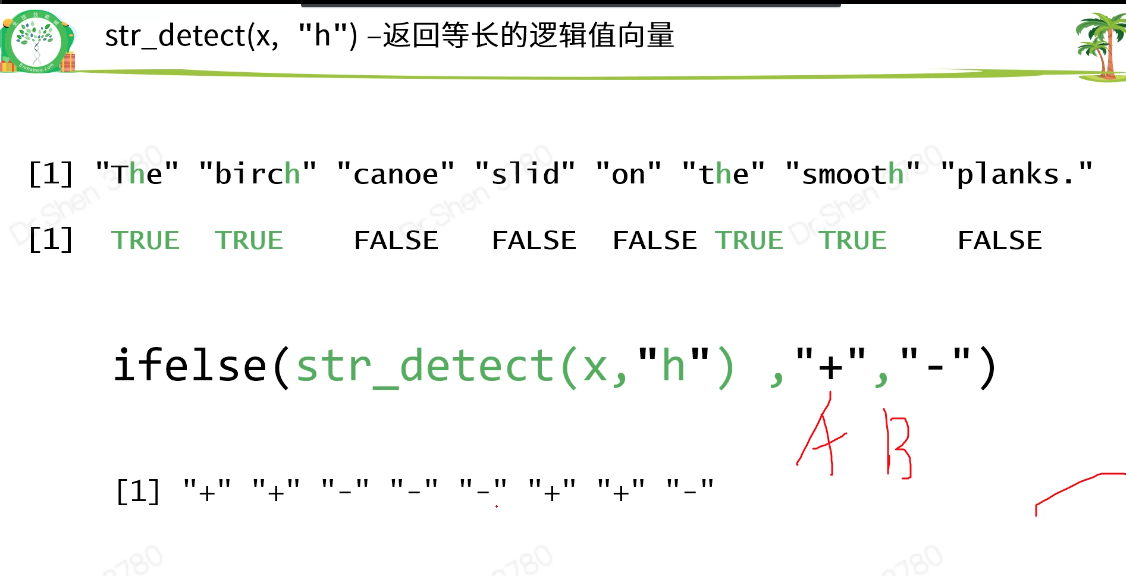
| 字符检测 | str_detect( ) |
| 替换 | str_replace( )/str_replace_all() |
| 删除 | str_remove()/str_remove_all() |
> rm(list = ls())> if(!require(stringr))install.packages('stringr')> library(stringr)>> x <- "The birch canoe slid on the smooth planks.">> x[1] "The birch canoe slid on the smooth planks."> ###1.检测字符串长度> str_length(x) #共多少个字符[1] 42> length(x) #向量中有多少函数[1] 1>> ###2.字符串拆分> str_split(x," ")#以空格作为拆分[[1]][1] "The" "birch" "canoe" "slid" "on" "the" "smooth"[8] "planks."> x2 = str_split(x," ")[[1]];x2[1] "The" "birch" "canoe" "slid" "on" "the" "smooth"[8] "planks.">> y = c("jimmy 150","nicker 140","tony 152")> str_split(y," ")[[1]][1] "jimmy" "150"[[2]][1] "nicker" "140"[[3]][1] "tony" "152"> str_split(y," ",simplify = T)[,1] [,2][1,] "jimmy" "150"[2,] "nicker" "140"[3,] "tony" "152">> ###3.按位置提取字符串> str_sub(x,5,9)[1] "birch">> ###4.字符检测> str_detect(x2,"h")#检验是否含有h[1] TRUE TRUE FALSE FALSE FALSE TRUE TRUE FALSE> str_starts(x2,"h")#检验开头是否含有h[1] FALSE FALSE FALSE FALSE FALSE FALSE FALSE FALSE> str_ends(x2,"h")#检验结尾是否含有h[1] FALSE TRUE FALSE FALSE FALSE FALSE TRUE FALSE>> ###5.字符串替换> str_replace(x2,"o","A") #只替换一个[1] "The" "birch" "canAe" "slid" "An" "the" "smAoth"[8] "planks."> str_replace_all(x2,"o","A")#全部替换[1] "The" "birch" "canAe" "slid" "An" "the" "smAAth"[8] "planks.">> ###6.字符删除> str_remove(x," ")#只删除1个[1] "Thebirch canoe slid on the smooth planks."> str_remove_all(x," ")#全部删除[1] "Thebirchcanoeslidonthesmoothplanks.">
五、条件语句和循环语句
> rm(list = ls())>> ## 一.条件语句>> ###1.if(){ }>> #### (1)只有if没有else,那么条件是FALSE时就什么都不做>> i = -1> if (i<0) print('up')[1] "up"> if (i>0) print('up')>> #理解下面代码> if(!require(tidyr)) install.packages('tidyr')>> #### (2)有else,ifelse(x,yes,no)#3个参数,x逻辑值,yes逻辑值为TRUE的返回值,no逻辑值为FALSE的返回值> i =1> if (i>0){+ print('+')+ } else {+ print("-")+ }[1] "+">> ifelse(i>0,"+","-")[1] "+">> x=rnorm(3)> ifelse(x>0,"+","-")[1] "-" "+" "+">>> #### (3)多个条件> i = 0> if (i>0){+ print('+')+ } else if (i==0) {+ print('0')+ } else if (i< 0){+ print('-')+ }[1] "0">> ifelse(i>0,"+",ifelse(i<0,"-","0"))#第二种写法[1] "0">>
循环语句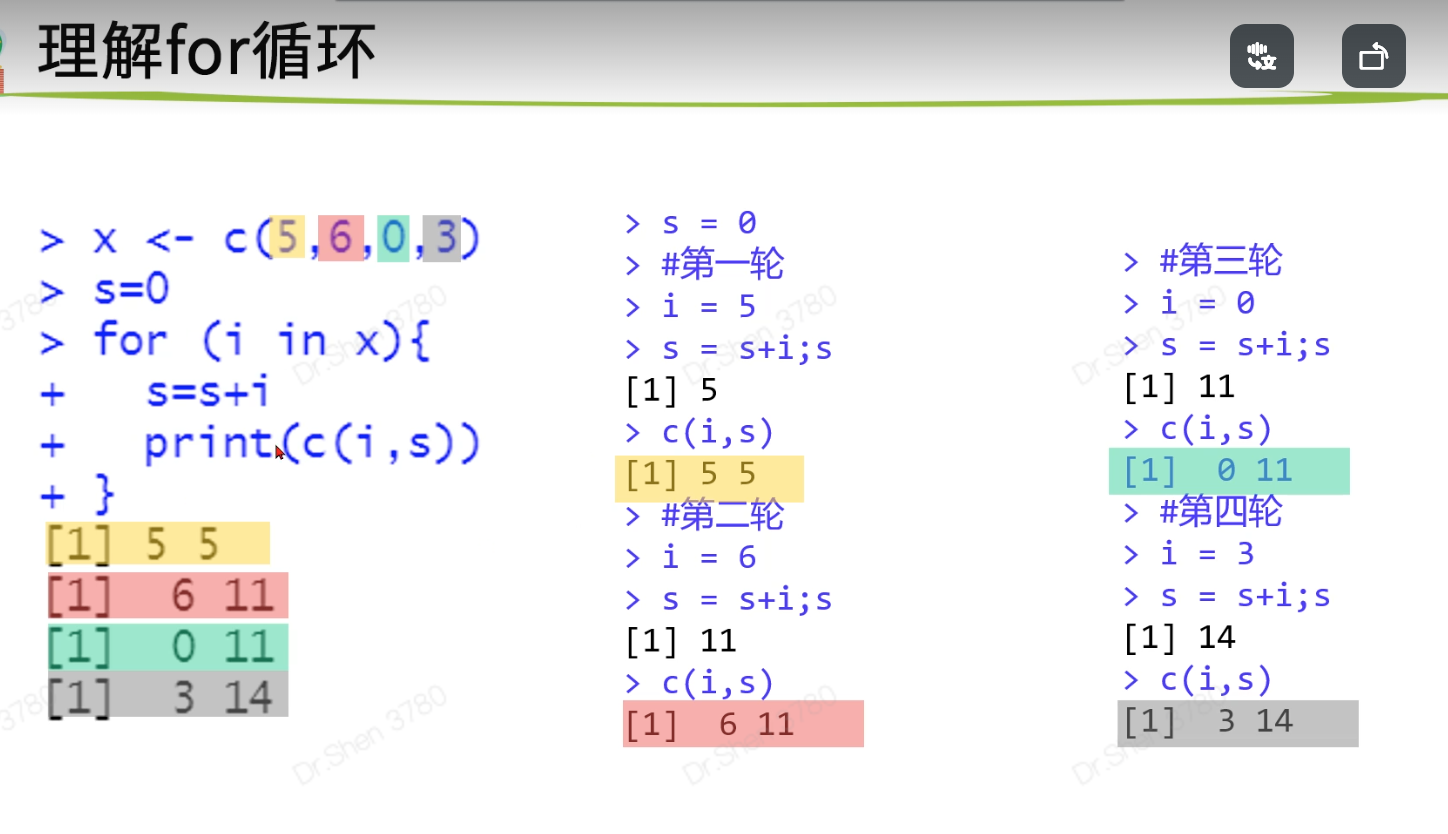
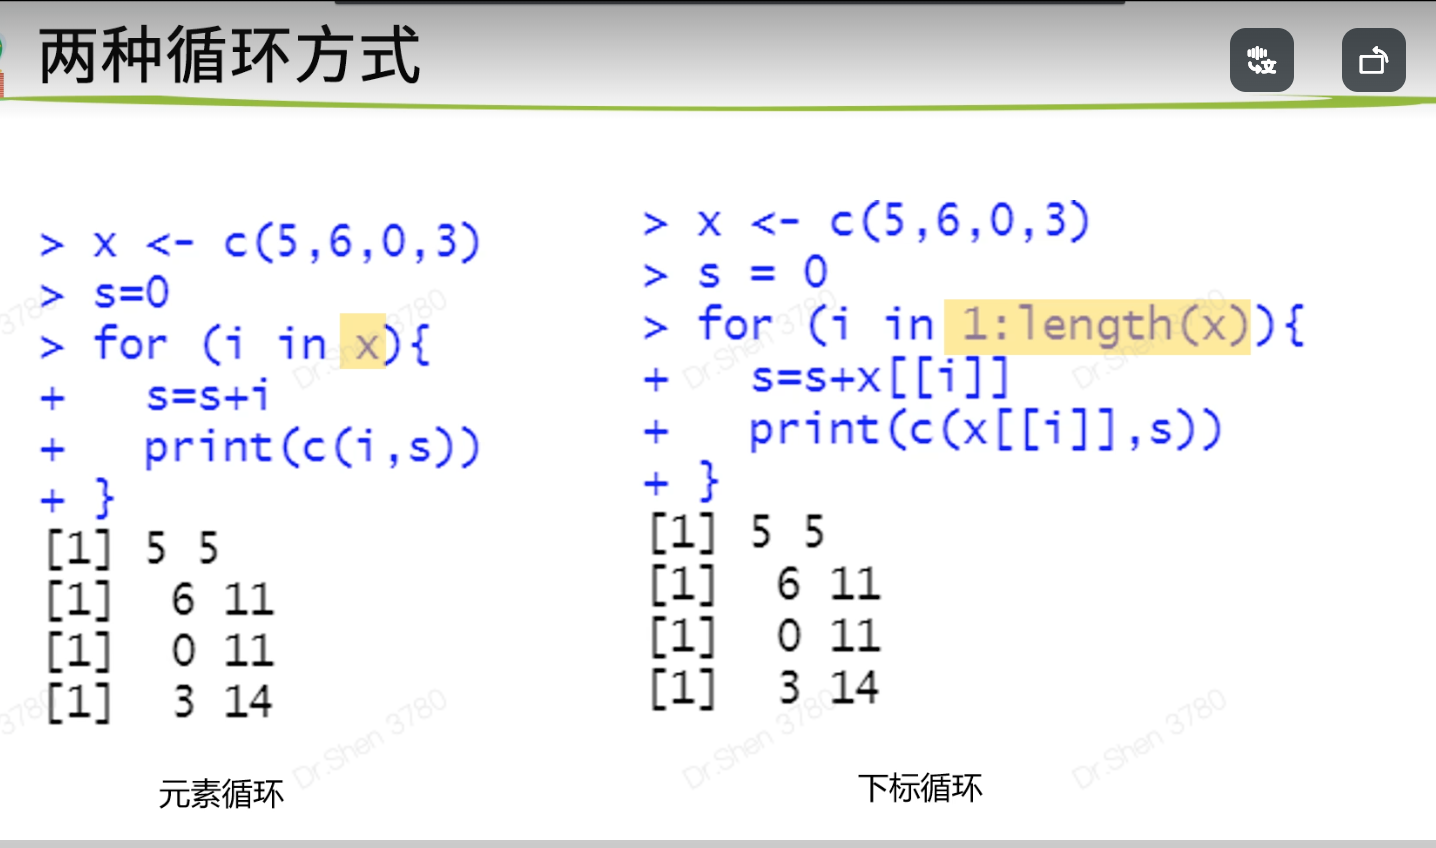
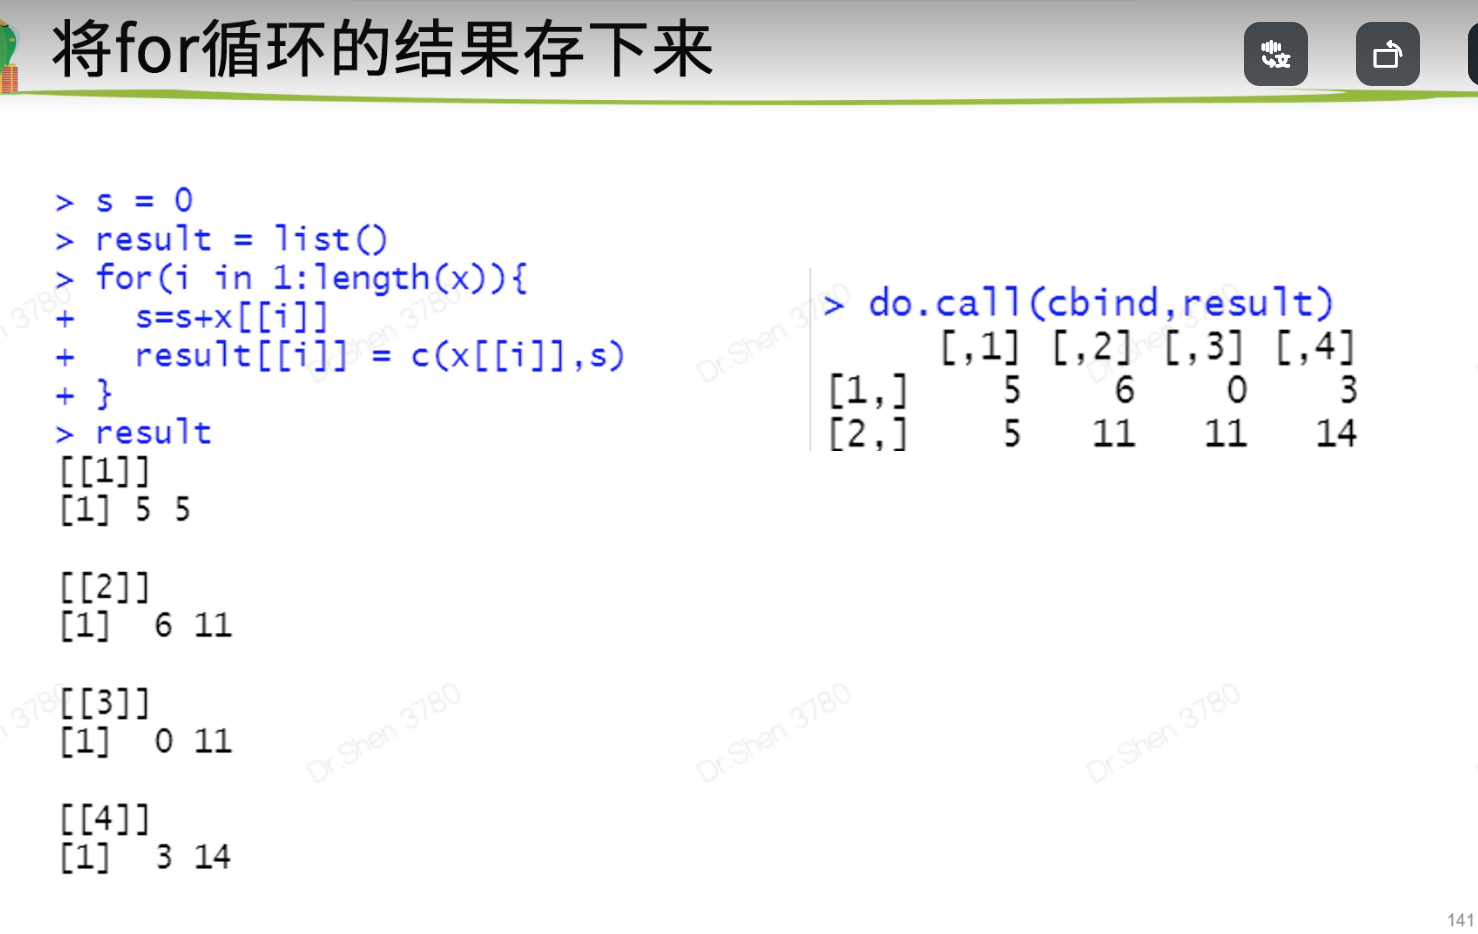
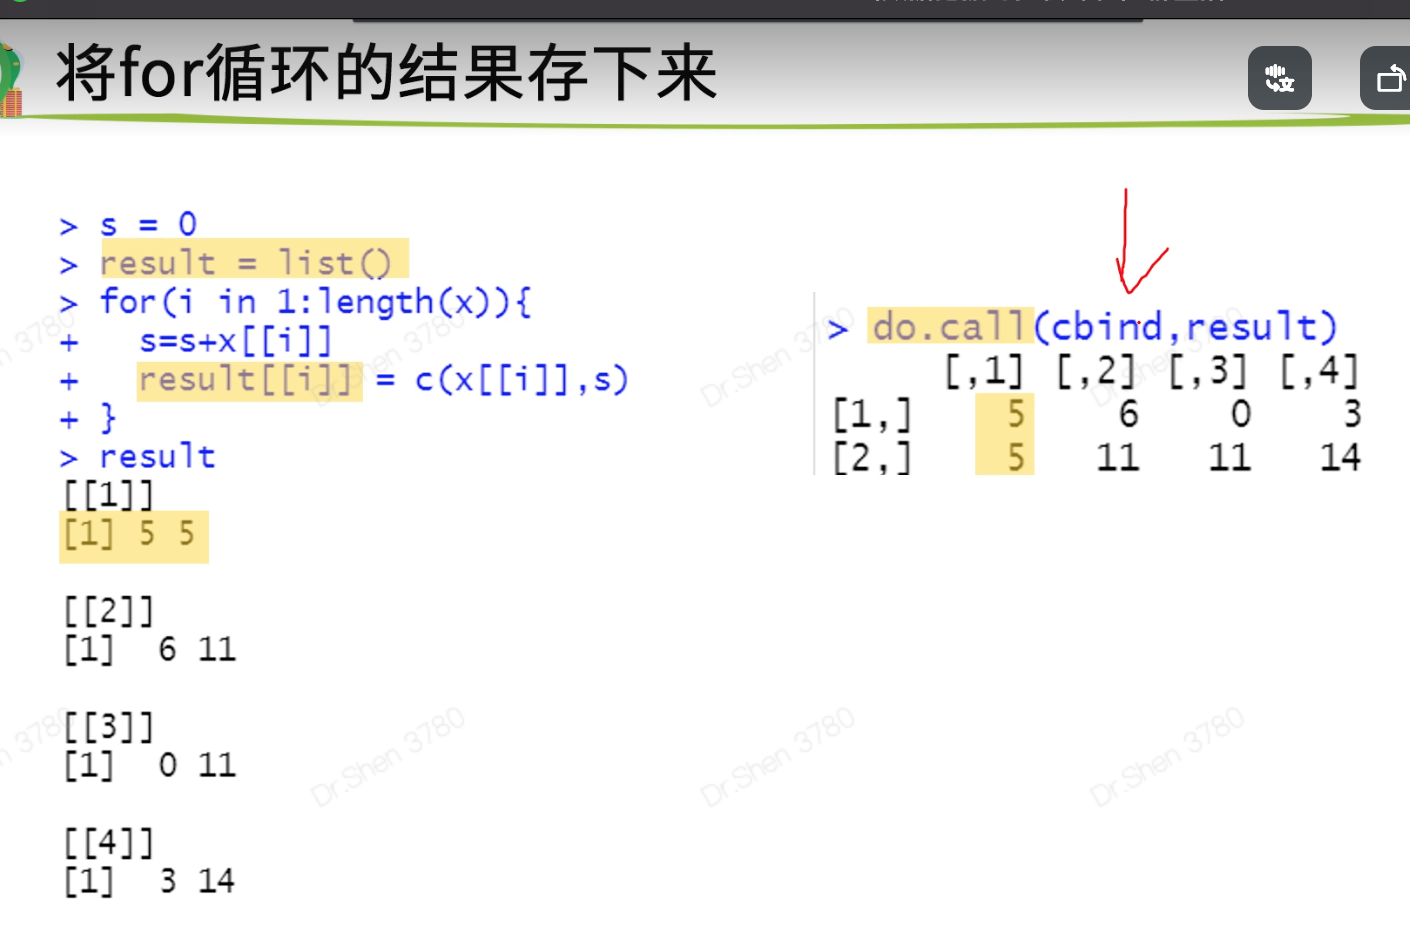
## 二、循环语句>> ### 1.for循环> x <- c(5,6,0,3)> s=0> for (i in x){+ s=s+i+ print(c(i,s))+ }[1] 5 5[1] 6 11[1] 0 11[1] 3 14>> x <- c(5,6,0,3)> s = 0> for (i in 1:length(x)){+ s=s+x[[i]]+ print(c(x[[i]],s))+ }[1] 5 5[1] 6 11[1] 0 11[1] 3 14>> #如何将结果存下来?> s = 0> result = list()> for(i in 1:length(x)){+ s=s+x[[i]]+ result[[i]] = c(x[[i]],s)+ }> result[[1]][1] 5 5[[2]][1] 6 11[[3]][1] 0 11[[4]][1] 3 14> do.call(cbind,result)[,1] [,2] [,3] [,4][1,] 5 6 0 3[2,] 5 11 11 14>
六、隐式循环
如何挑出一个表达矩阵里方差最大的1000个基因?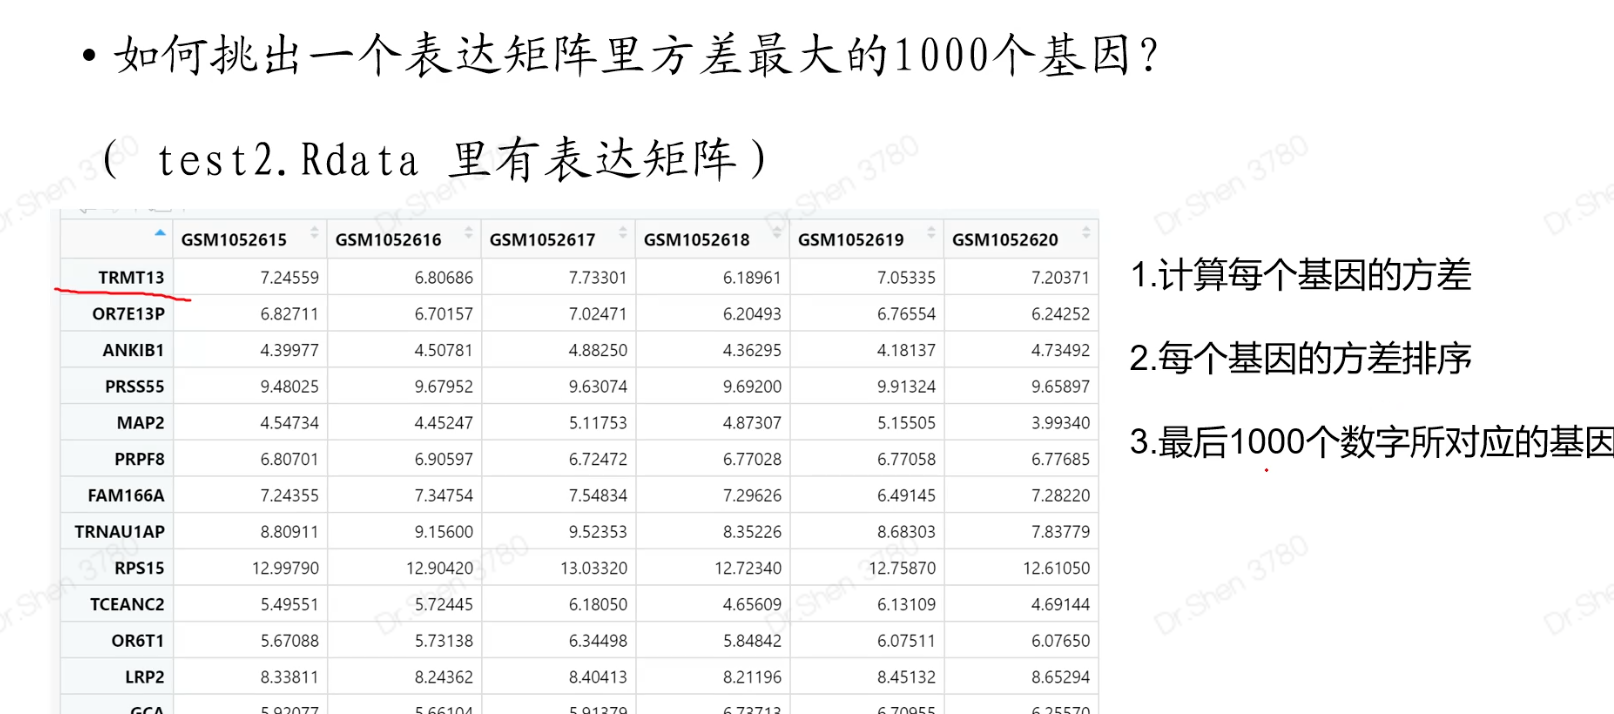
a=rnorm(100)sort(a)tail(sort(a),10)#排序后,取倒数10个load("test2.Rdata")b=apply(test,1,var)#取方差x=names(tail(sort(b),1000))head(x)
> rm(list = ls())> ## apply()族函数>> ### 1.apply 处理矩阵或数据框>> #apply(X, MARGIN, FUN, …)> #其中X是数据框/矩阵名;> #MARGIN为1表示行,为2表示列,FUN是函数>> test<- iris[1:6,1:4]>> apply(test, 2, mean)Sepal.Length Sepal.Width Petal.Length Petal.Width4.9500000 3.3833333 1.4500000 0.2333333>> apply(test, 1, sum)1 2 3 4 5 610.2 9.5 9.4 9.4 10.2 11.4>> ### 2.lapply(list, FUN, …) ,列表的隐式循环> # 对列表/向量中的每个元素(向量)实施相同的操作>> test <- list(x = 36:33,y = 32:35,z = 30:27);test$x[1] 36 35 34 33$y[1] 32 33 34 35$z[1] 30 29 28 27>> #返回值是列表,对列表中的每个元素(向量)求均值(试试方差var,分位数quantile)>> lapply(test,mean)$x[1] 34.5$y[1] 33.5$z[1] 28.5> lapply(test,fivenum)$x[1] 33.0 33.5 34.5 35.5 36.0$y[1] 32.0 32.5 33.5 34.5 35.0$z[1] 27.0 27.5 28.5 29.5 30.0> ### 3.sapply 简化结果,直接返回矩阵或向量>> sapply(test,mean)x y z34.5 33.5 28.5> sapply(test,fivenum)x y z[1,] 33.0 32.0 27.0[2,] 33.5 32.5 27.5[3,] 34.5 33.5 28.5[4,] 35.5 34.5 29.5[5,] 36.0 35.0 30.0>> class(sapply(test,fivenum))[1] "matrix" "array">
#练习7-2----# 1.读取group.csv,从第二列中提取圈出来的信息library(stringr)a = read.csv("group.csv")g = str_split(a$title," ",simplify = T)gg[,4]# 2.如何把上一题结果中的Control和Vemurafenib改成全部小写?搜索一下tolower(g[,4])str_to_lower(g[,4])# 3.加载deg.Rdata,根据a、b两列的值,按照以下条件生成向量x:#a< -1 且b<0.05,则x对应的值为down;#a>1 且b<0.05,则x对应的值为up;#其他情况,x对应的值为no# 统计up、down、no各重复了多少次load("deg.Rdata")k1 = deg$a< -1 & deg$b<0.05;table(k1)k2 = deg$a>1 & deg$b<0.05;table(k2)x = ifelse(k1,"down",ifelse(k2,"up","no"))
彩蛋:长脚本的管理
第一种方法 利用save和load进行长脚本的管理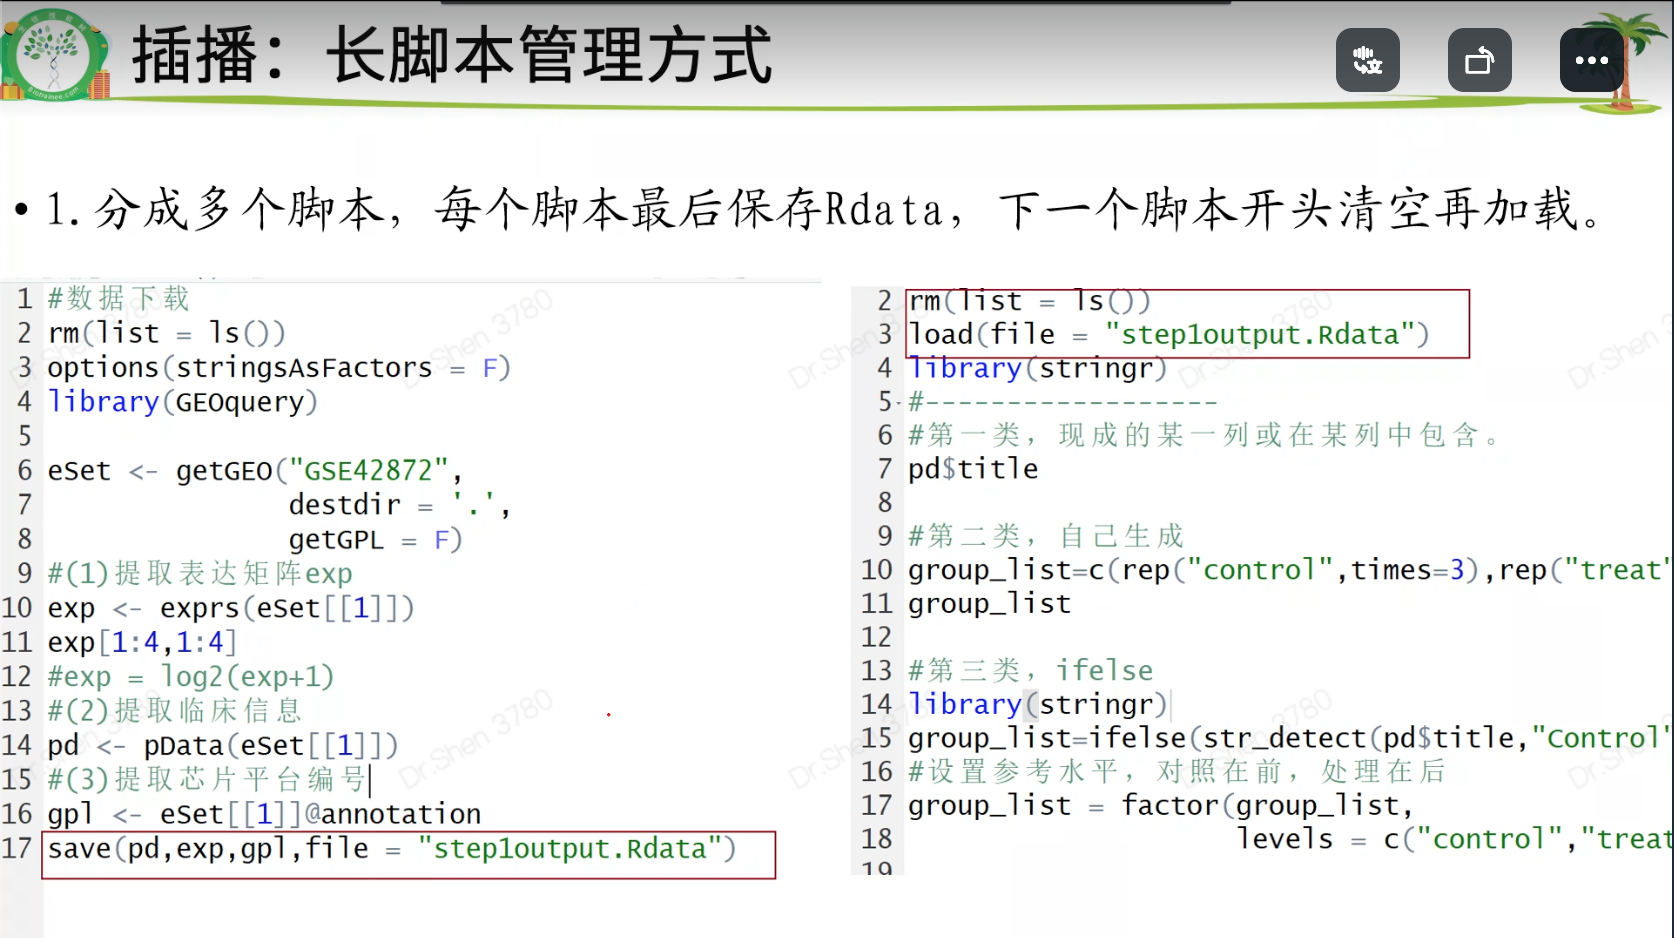
第二种方法,用if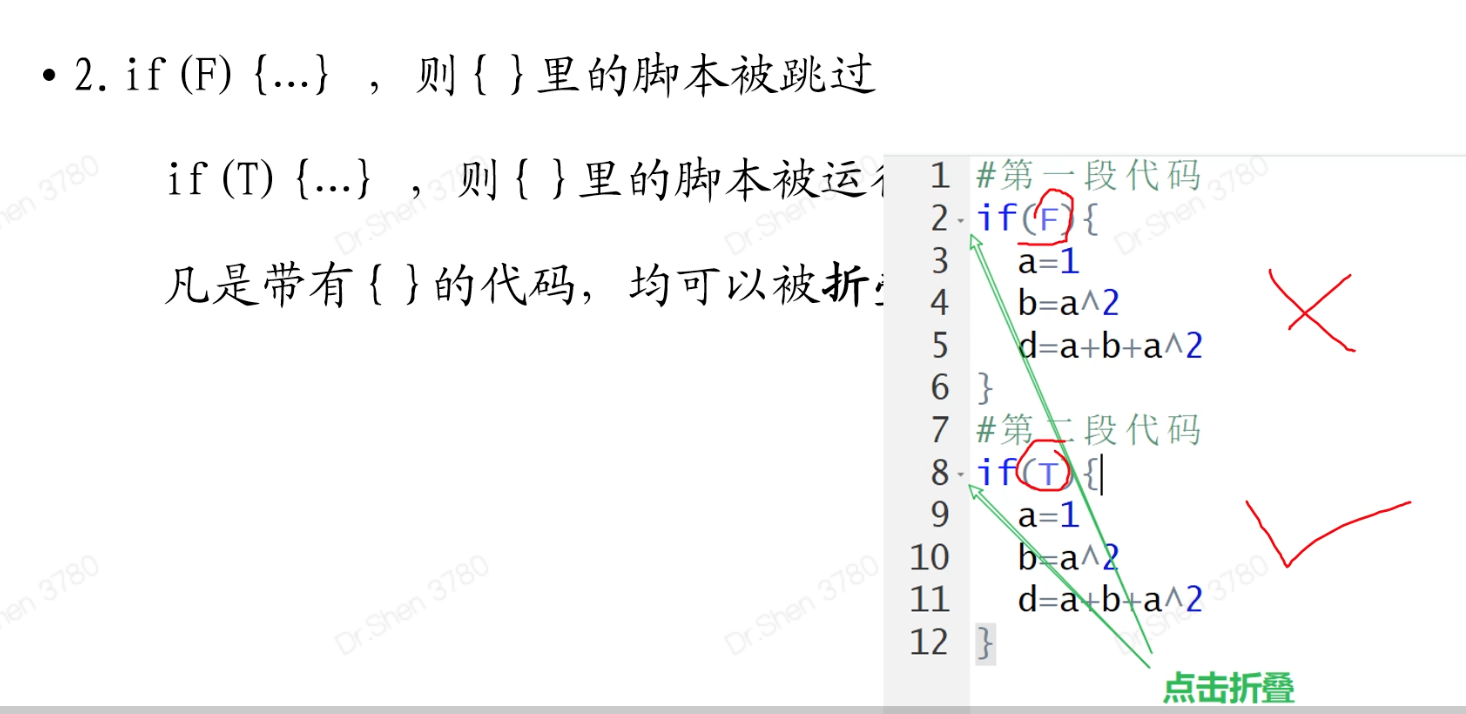

若有收获,就点个赞吧
0 人点赞
