1. Description:
A tool specifically designed to assess the results of metagenomic splicings, the main steps of the assessment include matching reference sequences to determine the content of unknown species, providing comprehensive reports based on diverse reference genomes, and determining the presence of highly correlated species by detecting chimeric overlapping groups
Parameters for comparison of different assembly results:
quast.py S1.fasta S2.fasta S3.fasta \-l S1,S2,S3, \-r reference-genome.fasta \-o quest result \
Assembly results:
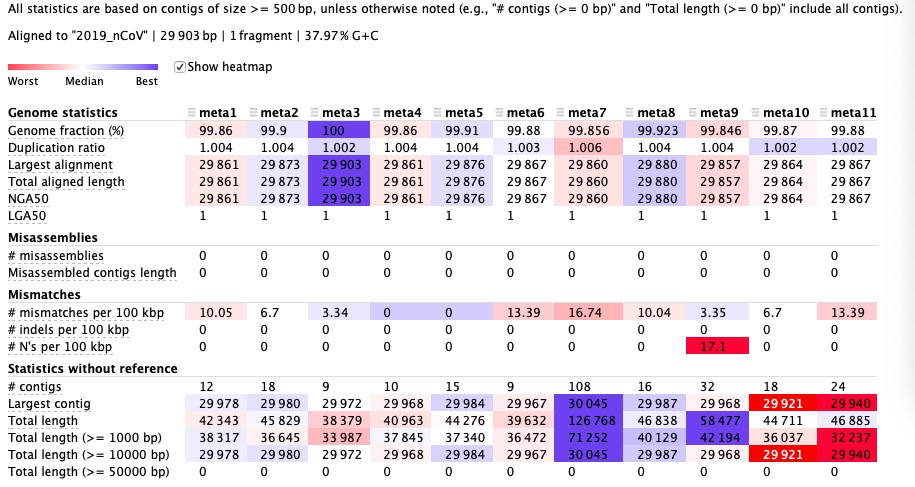
After SPAdea —meta parameters, the evaluation results of the 11 assembled genomes were as follows: Several important indicators:
N50, N90 means that Scaftigs are sorted by length and then summed from long to short, and the length value of Scaftigs when the sum value reaches 50% of the total length of Scaftigs and 90% of the total length of Scaftigs. The higher the value, the better the assembled genome.
Indicators Meaning Genome fraction Total number of aligned bases to the reference Largest alignment Can be smaller than the largest contig NGA50 Calculate the lengths of contig instead of the lengths of contig,The bigger the better LGA50 Count the number of aligned blocks
The smaller the value, the better.Misassemblies Error assembly Mismatches Mismatches
Results analysis:
By comparing the assembly results of 11 samples, it was found that the assembly results of the third sample were closest to the virus genome**, which was consistent with the results of the later evolutionary tree analysis.
The seventh sample has the most mismatches, which is related to the lowest mapping rate in the previous comparison.

若有收获,就点个赞吧
0 人点赞
