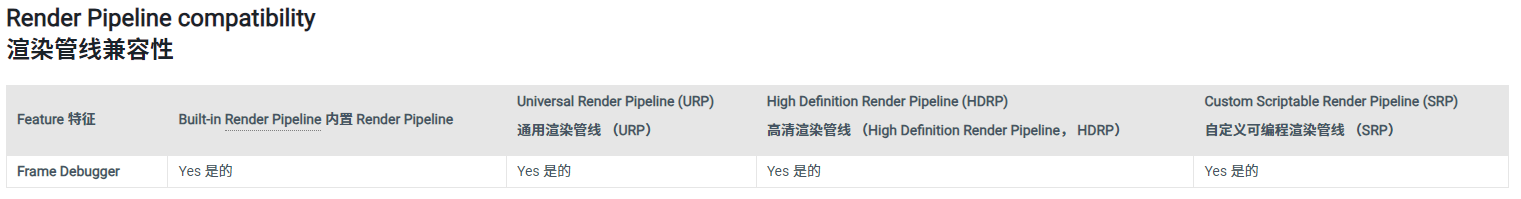
介绍Frame Debug
Unity - Manual: Debug frames in Unity
Debug frames to help identify rendering artefacts and other issues. Unity includes a dedicated Frame Debugger that can pause the application on a particular frame and display the list of rendering events that constitute the frame. The Frame Debugger can step through each event and display the graphical state of the scene at that point in the rendering process. You can use this to find where graphical issues arise or to just see how Unity constructs the scene from graphical elements.
调试帧以帮助识别渲染伪影和其他问题。Unity 包括一个专用的 Frame Debugger(帧调试器),它可以在特定帧上暂停应用程序并显示构成该帧的渲染事件列表。Frame Debugger (帧调试器)可以逐步查看每个事件,并显示在渲染过程中的某个时刻场景的图形状态。你可以使用这个工具来找出图形问题出现的原因,或者仅仅查看 Unity 如何从图形元素构建场景。
Frame Debug的参数介绍
从Unity的工具栏中Window->Analysis->Frame Debugger可以打开Frame Debug面板。
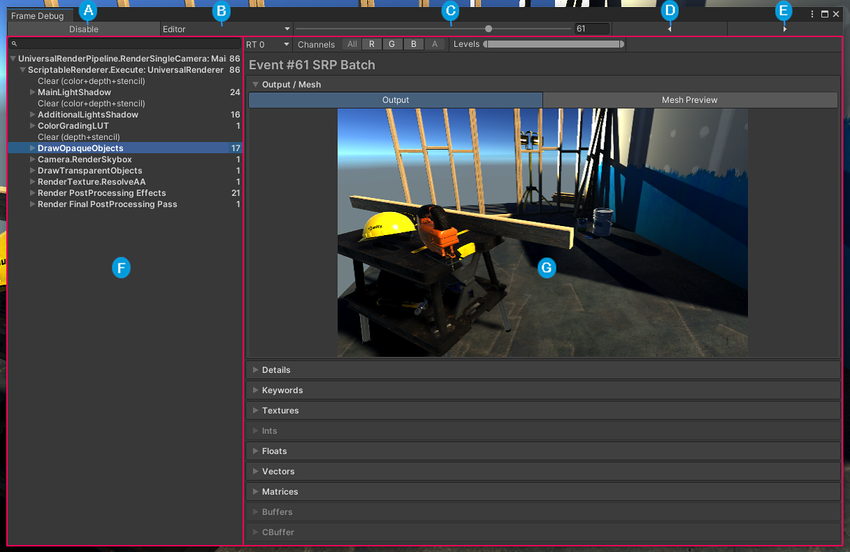
| Label** **标签 | Description** **描述 |
|---|---|
| A | Enable/Disable(启用/禁用):启用或禁用 Frame Debugger |
| B | Target selector(目标选择器):指定要将 Frame Debugger 附加到的进程。这是默认的 Unity 编辑器,但您可以使用它来将 Frame Debugger 附加到构建的应用程序。有关更多信息,请参阅将 Frame Debugger 附加到构建的工程 |
| C | Event scrubber(事件滑块):此滑块可用于在当前帧中的渲染事件之间线性移动。 |
| D | Previous event(上一个事件):选择当前所选事件之前的事件 |
| E | Next event(下一个事件):选择当前所选事件之后的事件 |
| F | Event Hierarchy(事件层次结构):列出构成帧的渲染事件的顺序。有关更多信息,请参阅事件层次结构 |
| G | Event Information Panel(事件信息面板):显示有关事件的信息,例如几何体详细信息和用于绘制调用的信息 shader 。有关更多信息,请参阅事件信息面板 |
补充
- Unity的渲染知识
- Unity性能分析工具 Unity - Manual: Profiling tools
- UPR报告快照对比(对象快照/内存快照)UPR - Unity专业性能优化工具

若有收获,就点个赞吧
0 人点赞
