在前面几节的数据分析中,我们从原始数据一直分析到了 Somatic mutations,进行了 maftools 可视化,然后还分析了 cnv ,对比了多个软件的分析结果。接下来我们来分析一下 Somatic mutations Signatures,用到是 R 包 deconstructSigs。
Mutations Signature介绍
首先,对于点突变 SNV 的类型,可以分为 6 类:C>A, C>G,C>T, A>C,A>G, A>T,而其他的点突变,如 T>G 其实与 A>C 是等效的,因为突变发生在哪条 DNA 链上是无法确定的。如果把突变位点的侧翼各 1 bp 的碱基也考虑进来,也就是三连核苷酸突变,就有 4x6x4=96 种碱基突变类型。
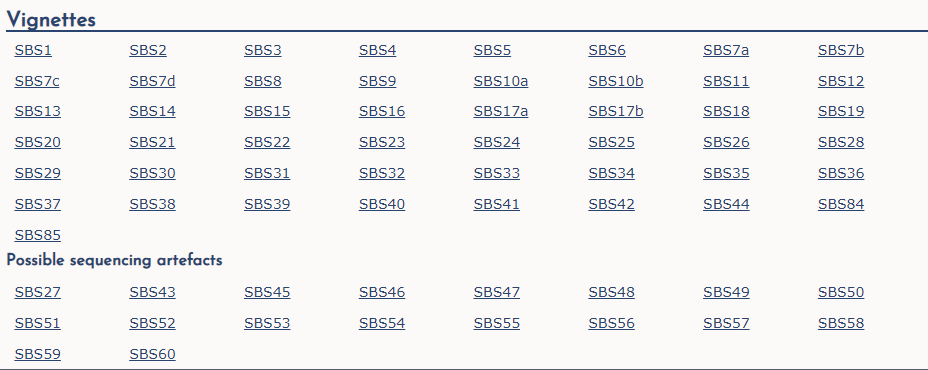
发生 Somatic mutations 的原因是多样的,如: DNA replication infidelity, exogenous and endogenous genotoxins exposures, defective DNA repair pathways and DNA enzymatic editing。不同的突变原因会产生独特的突变类型组合,称为Mutations Signature。每一种突变特征反映了一种肿瘤体细胞突变的物理、化学或生物过程。在 COSMIC 数据库已有记载的单碱基突变特征有:https://cancer.sanger.ac.uk/cosmic/signatures/

数据准备
在前面系列教程中,我们已经分析过了 SNV,还比较了了 VEP、ANNOVAR、GATK 的注释方法和结果,这里我们用 VEP 注释后的 maf 文件(其实都是差不多的,用 vcf 文件也可以)来分析 Signatures,主要是需要知道突变位点所在的染色体坐标、参考基因组和肿瘤样本的碱基信息。分析方法参考曾老师写过的教程,如:下载TCGA所有癌症的maf文件做signature分析
在这里,我们用 R 包 deconstructSigs ,还要安装依赖包 BSgenome, BSgenome.Hsapiens.UCSC.hg38(假如用的参考基因组是hg19,那就安装BSgenome.Hsapiens.UCSC.hg19)
rm(list=ls())options(stringsAsFactors=FALSE)## 切换镜像options(BioC_mirror="https://mirrors.ustc.edu.cn/bioc/")options("repos" = c(CRAN="https://mirrors.tuna.tsinghua.edu.cn/CRAN/"))## 安装R包install.packages('deconstructSigs')BiocManager::install('BSgenome')BiocManager::install('BSgenome.Hsapiens.UCSC.hg38')library(deconstructSigs)## https://github.com/raerose01/deconstructSigs## 读入数据maf=read.table('./7.annotation/vep/VEP_merge.maf',header = T,sep = '\t',quote = "")maf[1:5,1:5]## 构建肿瘤突变数据框,需要5列信息: sample.ID,chr,pos,ref,altsample.mut.ref <- data.frame(Sample=maf[,16],chr = maf[,5],pos = maf[,6],ref = maf[,11],alt = maf[,13])
构建好的数据框格式如下(前5行):
> sample.mut.ref[1:5,1:5]Sample chr pos ref alt1 case1_biorep_A_techrep chr1 6146376 G T2 case1_biorep_A_techrep chr1 6461445 G T3 case1_biorep_A_techrep chr1 31756671 C A4 case1_biorep_A_techrep chr1 32672798 A T5 case1_biorep_A_techrep chr1 39441098 G T
数据处理
使用函数 mut.to.sigs.input,将肿瘤的突变数据转换为 n 行和 96 列数据框,其中 n 是存在的样本数,这里是 24 个样本。每一列表示在每个三联核苷酸范围内发现突变的个数
sigs.input <- mut.to.sigs.input(mut.ref = sample.mut.ref,sample.id = "Sample",chr = "chr",pos = "pos",ref = "ref",alt = "alt",bsg = BSgenome.Hsapiens.UCSC.hg38)
这样就拿到了每个样本的三联核苷酸突变类型分布了,如前 5 行前 5 列
> sigs.input[1:5,1:5]A[C>A]A A[C>A]C A[C>A]G A[C>A]T C[C>A]Acase1_biorep_A_techrep 8 6 22 7 9case1_biorep_B 10 4 12 8 7case1_biorep_C 14 4 17 4 7case1_techrep_2 7 5 10 1 7case2_biorep_A 15 5 5 6 6
可视化
最后就用函数 whichSignatures 确定给定样本中每个签名的数量,这里的signatures.ref参数指选定的参考数据库的 signature 可以选择signatures.cosmic 或者 signatures.nature2013,同样的,我们选择一个肿瘤样本进行可视化就好:case1_biorep_A_techrep
sigs.output <- whichSignatures(tumor.ref = sigs.input,signatures.ref = signatures.cosmic,sample.id = 'case1_biorep_A_techrep',contexts.needed = TRUE)# Plot outputplotSignatures(sigs.output)
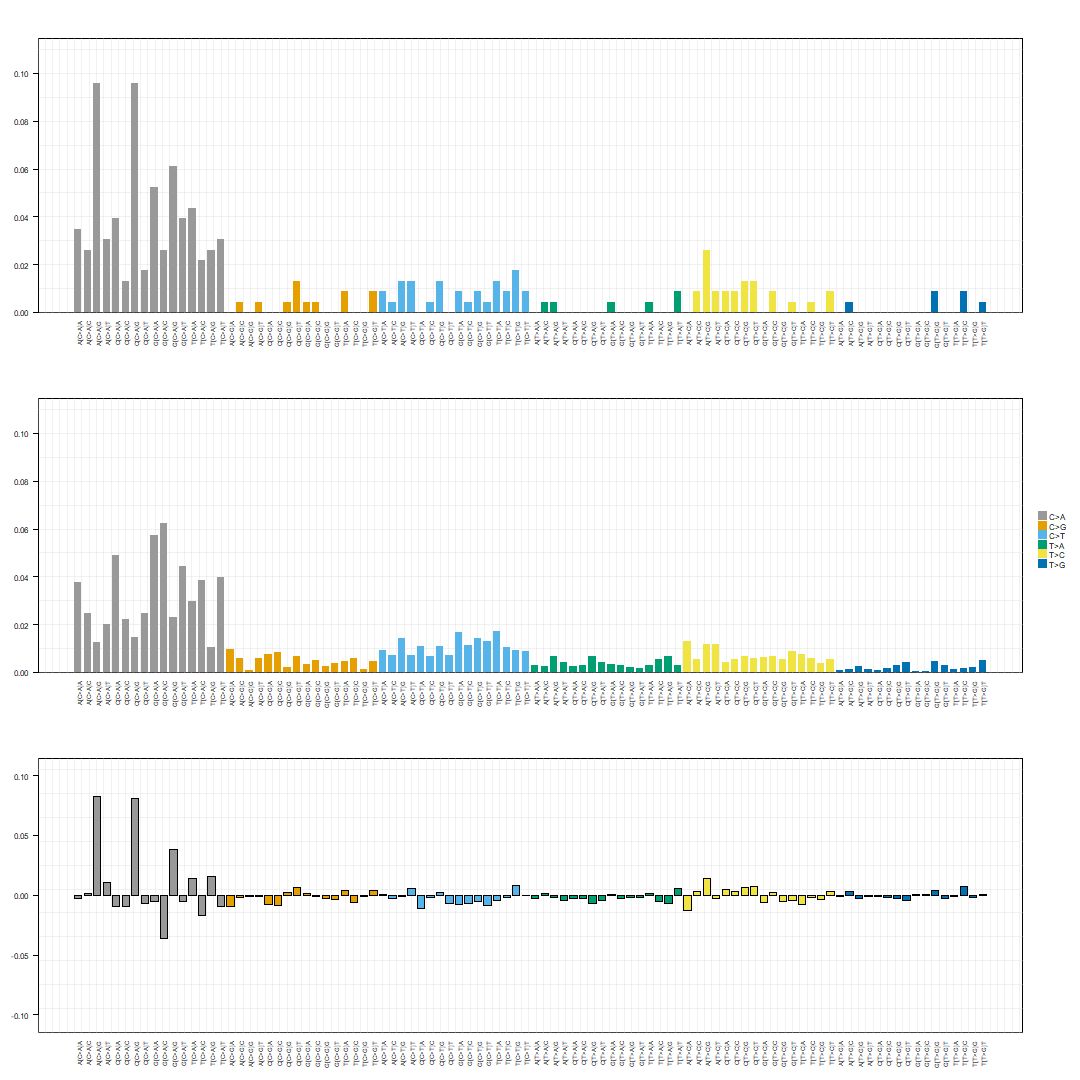
结果输出的图分为 3 个 panel ,上面的 panel 是肿瘤样本的突变分布图谱,显示每种三联核苷酸类型的突变的数;中间的 panel 是由参考数据库的 signature (这里用的是 signatures.cosmic )所计算出的突变分布,底部的 panel 是肿瘤样本和参考数据库的 signature 突变类型分布的差

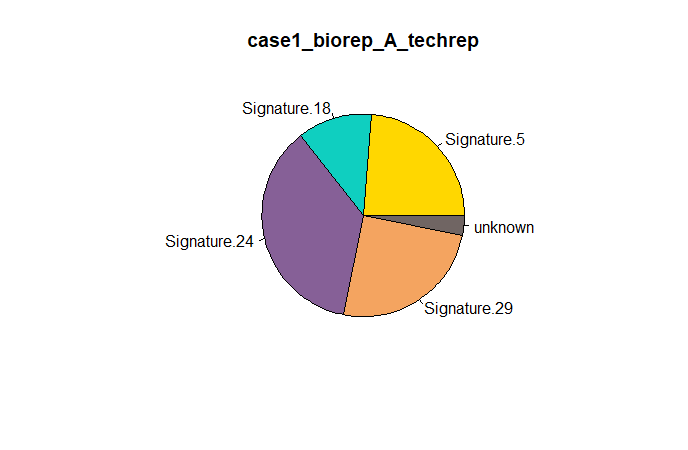
其实,每个样本的 mutations signature 都是由若干个 signature 组成,每个 signature 所占比例不一样,把 case1_biorep_A_techrep 样本的 signature 画出饼图就可以知道
makePie(sigs.output)

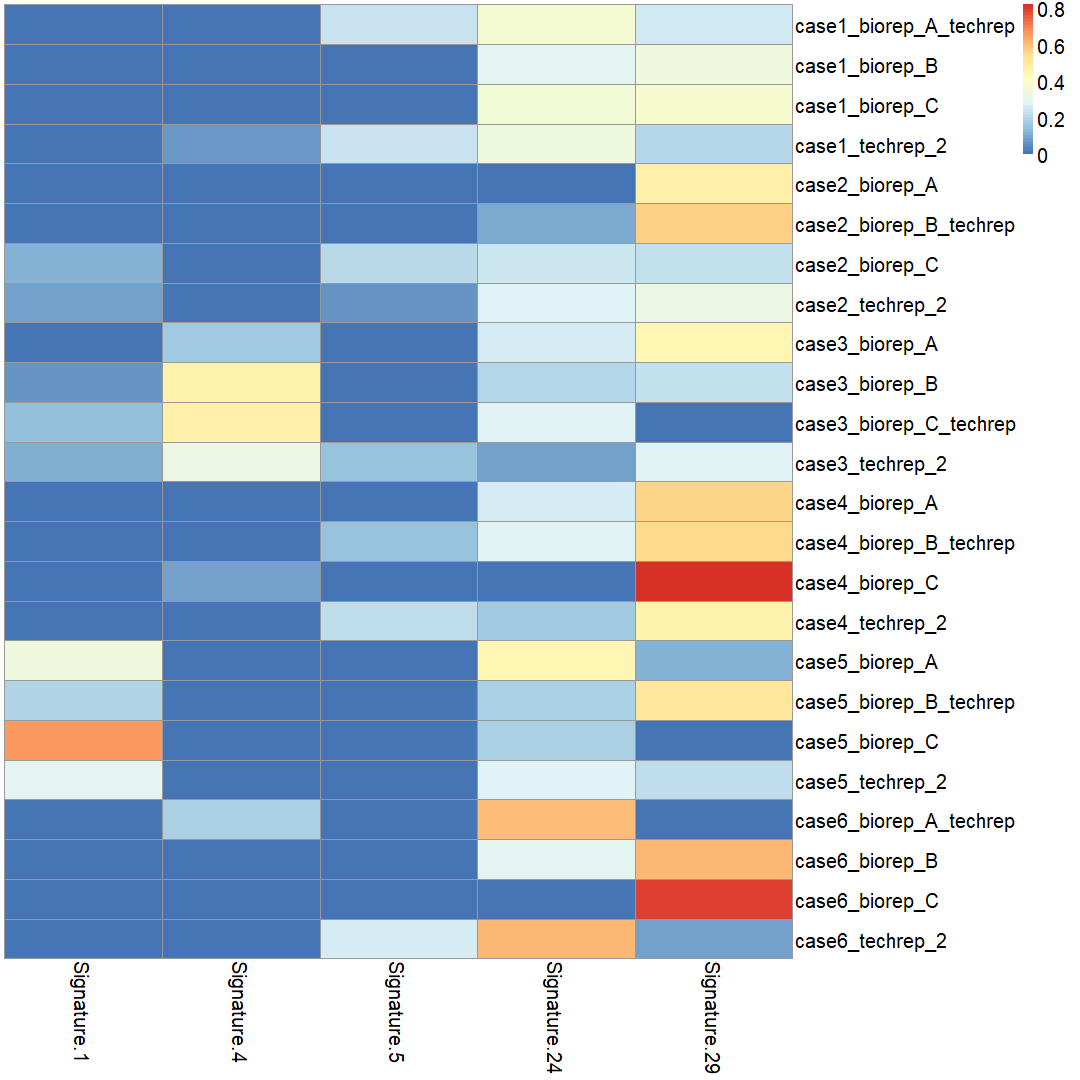
如果想把每个样本的若干个 signature 都表示出来,就要画成热图,挑选主要的 signature ,比如我这里就只挑选了样本数大于 5 的 signature:
# pheatmapdf = data.frame()for (i in rownames(sigs.input)) {sigs.output <- whichSignatures(tumor.ref = sigs.input,signatures.ref = signatures.cosmic,sample.id = i,contexts.needed = TRUE)df = rbind(df,sigs.output$weights)}df = df[ , apply(df, 2, function(x){sum(x>0)})>5]pheatmap::pheatmap(df,cluster_cols = F,cluster_rows = F,fontsize = 20)


