写在前面
其实从去年 11 月份就准备学习 PyClone 了,在网上搜了一些教程,发现基本上都是随便写的,对软件的使用及结果介绍的不够系统,既然这样,就只能靠自己一点点慢慢啃了。这个过程遇到不少了 Python 模块的 bug ,还得感谢 @琪音(qiyin) 熬夜帮忙解决。拖延症一直到今天才想把 PyClone 系统整理一下。内容比较多,主要参考:
- https://bitbucket.org/aroth85/pyclone/wiki/Usage
- http://www.bio-info-trainee.com/3964.html
- https://www.nature.com/articles/nmeth.2883
PyClone介绍
上一节我们提到肿瘤细组织是一个由正常细胞和肿瘤细胞组成的混合组织,而肿瘤中存在的异质性也导致了分析起来更加复杂。由癌细胞分裂的后代呈现的基因组水平的差异,随着肿瘤进化而形成不同的克隆或亚克隆,如何根据测序数据来进行推断肿瘤的克隆和亚克隆的组成,就是 PyClone 所要解决的问题。考虑到突变频率的影响因素的复杂性:肿瘤组织中混有的正常细胞、携带该突变的肿瘤细胞的比例、每个细胞中突变的等位基因拷贝数、以及未知的技术噪声来源,Pyclone 基于贝叶斯聚类方法,用于将一个或多个位点取样深度测序(通常大于1000x)的体细胞突变归类为推定的克隆clusters,同时估算其细胞患病率,并解释由拷贝数变异和正常细胞污染引起的等位基因失衡问题。
分析过程主要分 5 个步骤:
To run a PyClone analysis you need to perform several steps.
- Prepare mutations input file(s).
- Prepare .tsv input file.
- Run
PyClone build_mutations_file --in_files TSV_FILEwhereTSV_FILEis the input file you have created.- Prepare a configuration file for the analysis.
- Run the PyClone analysis using the
PyClone run_analysis --config_file CONFIG_FILEcommand. WhereCONFIG_FILEis the file you created in step 2.- (Optional) Plot results using the
plot_clustersandplot_locicommands.- (Optional) Build summary tables using the
build_tablecommand.
但是,作者也给出了 pipeline,可以一步完成,这对于新手(比如我)来说相当友好。
软件安装
PyClone 基于 Python2,这里介绍两种安装方法:
- (推荐)用 conda 安装,最好就是新建一个环境:
## 创建小环境conda create --name pyclone python=2conda activate pyclone## 用conda安装pycloneconda install -c aroth85 pyclone
可能会出现 warnning,提示我们需要下载示例数据,所以结合第二种安装方法
Example files are contained in the examples/mixing/tsv folder which ships with the PyClone software
- git clone 手动安装(即便是手动安装,也建议新建一个 Python2 的小环境)
cd ~/wes_cancer/biosoft/## 下载软件包git clone https://github.com/aroth85/pyclone## 安装,如果用conda安装好了,就不用再安装一遍,下载数据就行# cd pyclone# python setup.py install
使用过程可能会出现下面的报错,应该是 Python 的模块版本问题:
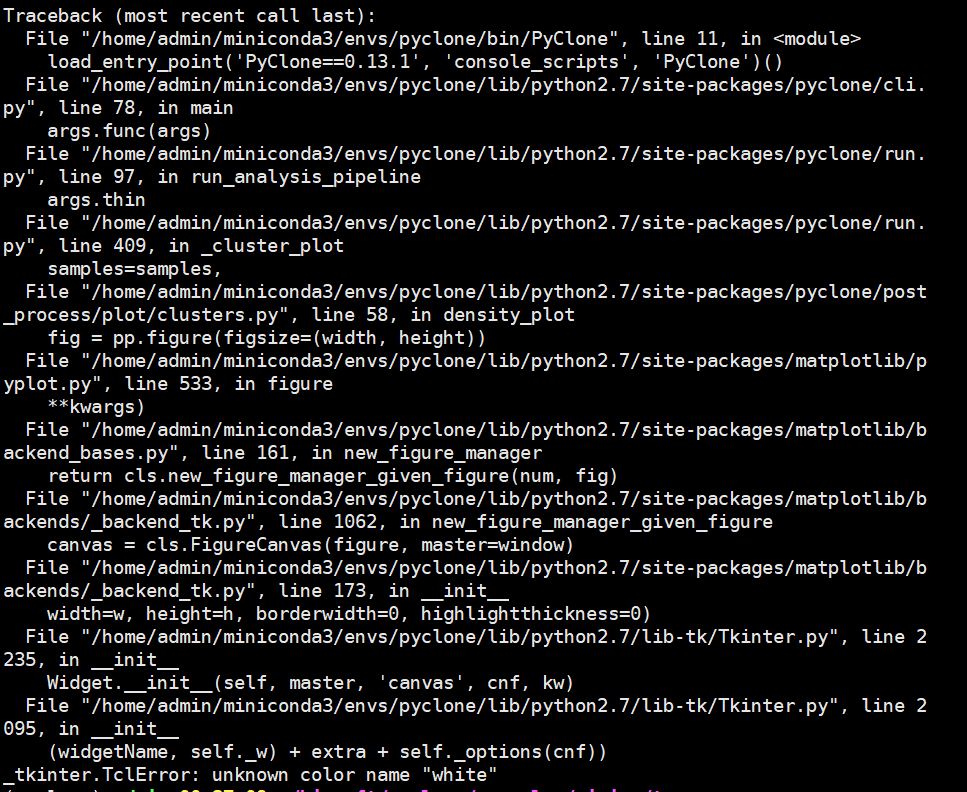
如果遇到上面的报错,这里提供两种可能的解决方法,但是不能保证百分之百有效:
- 安装
numpy==1.14.5:原先用 conda 默认安装的 numpy 版本是 1.16.5,改为 1.14.5 的版本,可解决上面的问题
conda install -y numpy==1.14.5
- 设置
clusters.py画图脚本,如果是使用 conda 安装,应该差不多是在以下路径:在~/miniconda3/envs/pyclone/lib/python2.7/site-packages/pyclone/post_process/clusters.py文件最上方的注释行下面添加下面两行代码:
import matplotlibmatplotlib.use('agg')
测试数据
如果是使用原始的步骤,则需要按照要求一步步处理数据,如果是根据作者给的 pipeline,则需要输入 tsv 格式文件,文件中主要包含以下 6 列(其他列将被忽略,可以做为注释用):
The required fields in this file are:
- mutation_id - A unique ID to identify the mutation. Good names are thing such a the genomic co-ordinates of the mutation i.e. chr22:12345. Gene names are not good IDs because one gene may have multiple mutations, in which case the ID is not unique and PyClone will fail to run or worse give unexpected results. If you want to include the gene name I suggest adding the genomic coordinates i.e. TP53_chr17:753342.
- ref_counts - The number of reads covering the mutation which contain the reference (genome) allele.
- var_counts - The number of reads covering the mutation which contain the variant allele.
- normal_cn - The copy number of the cells in the normal population. For autosomal chromosomes this will be 2 and for sex chromosomes it could be either 1 or 2. For species besides human other values are possible.
- minor_cn - The minor copy number of the cancer cells. Usually this value will be predicted from WGSS or array data.
- major_cn - The major copy number of the cancer cells. Usually this value will be predicted from WGSS or array data.
需要注意的是,前 3 列我们都可以从 maf 或者 vcf 文件中获取,第 4 列normal_cn 对于人类来说正常拷贝数为 2,而后两列 minor_cn 和 major_cn 并没有。看了一下作者提供的测试数据,格式如下:
$ less -S pyclone/examples/mixing/tsv/SRR385938.tsvmutation_id ref_counts var_counts normal_cn minor_cn major_cn variant_case variant_freq genotypeNA12156:BB:chr2:175263063 3812 14 2 0 2 NA12156 0.0036591740721380033 BBNA12156:BB:chr1:46500613 3933 42 2 0 2 NA12156 0.010566037735849057 BBNA12156:BB:chr19:43763059 10352 42 2 0 2....NA19240:AB:chr5:112178995 2559 1258 2 1 1 NA19240 0.32957820277705 ABNA12156:BB:chr11:5364450 3048 43 2 0 2 NA12156 0.013911355548366224 BBNA12156:AB:chr3:37053568 2265 17 2 1 1 NA12156 0.007449605609114811 AB......
从作者提供的测试数据上来看,对于二倍体生物,总拷贝数为 2 ,当基因型为 AB 的杂合突变位点时,minor_cn 和 major_cn 分别为 1,当基因型为 BB 时,minor_cn 为 0,major_cn 数为 2。下面使用测试数据,根据作者的 run_analysis_pipeline 运行一下看结果如何,代码是:
## 跑测试数据conda activate pyclonecd ~/wes_cancer/biosoft/pyclone/examples/mixing/tsv/PyClone run_analysis_pipeline --in_files SRR385938.tsv SRR385939.tsv SRR385940.tsv SRR385941.tsv --working_dir pyclone_analysis
结果生成一个文件夹 pyclone_analysis,文件结构是:
tree ./pyclone_analysis/├── config.yaml├── plots│ ├── cluster│ │ ├── density.pdf│ │ ├── parallel_coordinates.pdf│ │ └── scatter.pdf│ └── loci│ ├── density.pdf│ ├── parallel_coordinates.pdf│ ├── scatter.pdf│ ├── similarity_matrix.pdf│ ├── vaf_parallel_coordinates.pdf│ └── vaf_scatter.pdf├── tables│ ├── cluster.tsv│ └── loci.tsv├── trace│ ├── alpha.tsv│ ├── labels.tsv.bz2│ ├── precision.tsv.bz2│ ├── SRR385938.cellular_prevalence.tsv.bz2│ ├── SRR385939.cellular_prevalence.tsv.bz2│ ├── SRR385940.cellular_prevalence.tsv.bz2│ └── SRR385941.cellular_prevalence.tsv.bz2└── yaml├── SRR385938.yaml├── SRR385939.yaml├── SRR385940.yaml└── SRR385941.yaml6 directories, 23 files
关于这些文件所记录的内容:
The contents of these folders are as follows
- config.yaml - This file specifies the configuration used for the PyClone analysis.
- plots - Contains all plots from the analysis. There will be two sub-folders
clusters/andloci/for cluster and locus specific plots respectively.- tables - This contains the output tables with summarized results for the analysis. There will be two tables
clusters.tsvandloci.tsv, for cluster and locus specific information.- trace - This the raw trace from the MCMC sampling algorithm. Advanced users may wish to work with these files directly for generating plots and summary statistics.
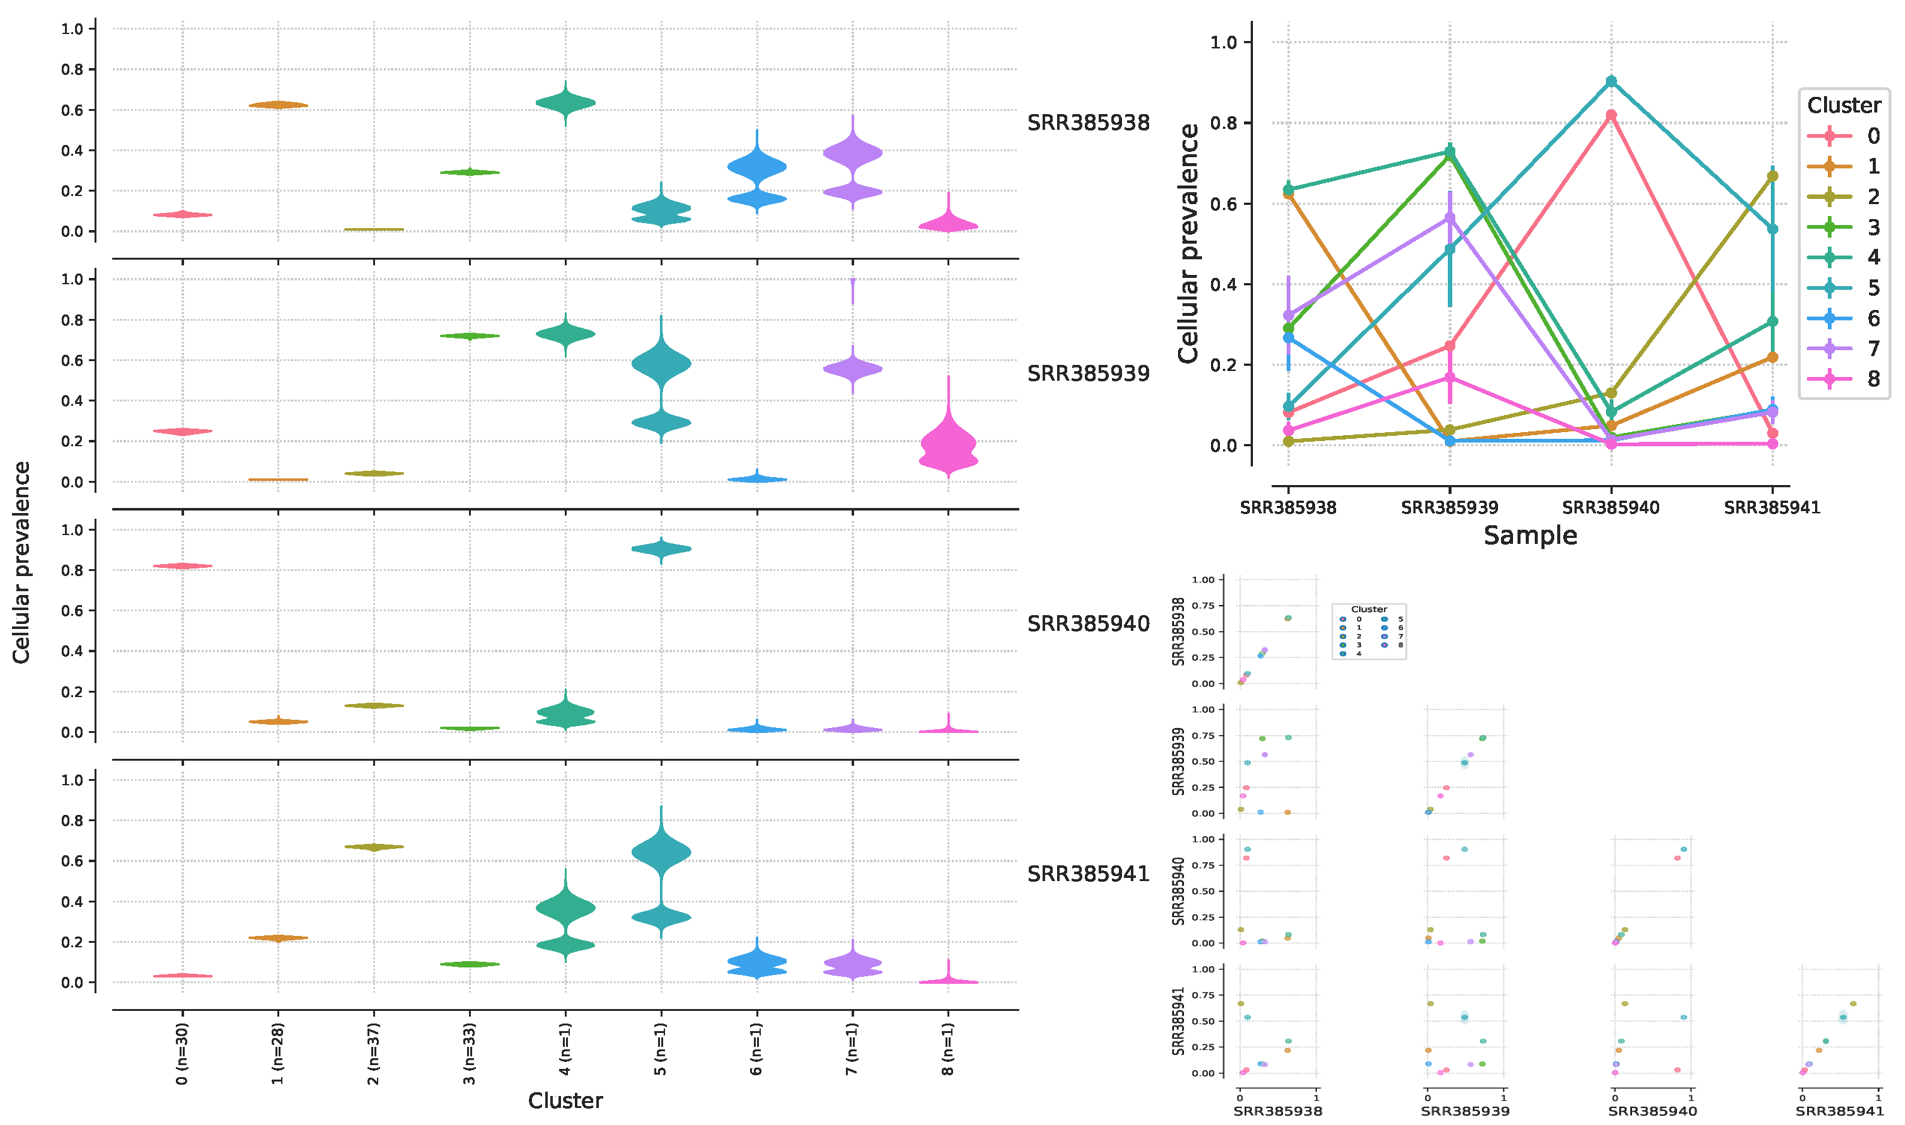
生成的 PDF 是可视化的结果,可以看出来这个病人有 4 个样本中,总共是有9个亚克隆,不同样本的亚克隆比重不一样,图表的具体含义我们后面再讲:
数据处理
在实际运行时,输入数据所要求的前 4 列信息是可知的,这里我从 肿瘤外显子数据处理系列教程(八)不同注释软件的比较(中):注释后转成maf文件 VEP 注释后得到的 maf 文件获取前四列信息。但是后两列 minor_cn 和 major_cn 的信息我们并没有,作者给出的建议是:
If you do not major and minor copy number information you should set the minor copy number to 0, and the major copy number to the predicted total copy number. If you do this make sure to use the total_copy_number for the
--priorflag of thebuild_mutations_file,setup_analysisandrun_analysis_pipelinecommands. DO NOT use the parental copy number or major_copy_number information method as it assumes you have knowledge of the minor and major copy number.
也就是把 minor_cn 设置为 0,把 major_cn 设置为推断出来的拷贝数,然后加一个--prior total_copy_number参数 。不过我觉得也可以根据 vcf 或 maf 文件给出的 genetype 把杂合位点的 minor_cn s设置为 1,不过我这里还是按照作者所说的方法来设置。先从前面的拷贝数变异分析的结果来获取 major_cn ,然后根据突变坐标映射到拷贝数变异分析的 segments 文件,这里采用的是 肿瘤外显子数据处理系列教程(九)拷贝数变异分析(主要是GATK)得到的 segments 文件,根据文件的 Segment_Mean 来计算拷贝数,Segment_Mean 大于 0 则拷贝数扩增,小于 0 则拷贝数缺失,但是通常在 -0.2~0.2 之间都认为是正常,也有一些软件的 cutoff 是 0.3。实际计算方法如下:
由
可知,实际的
首先制作初步的输入文件,内容基本来自于 vep 注释后的 maf 文件:
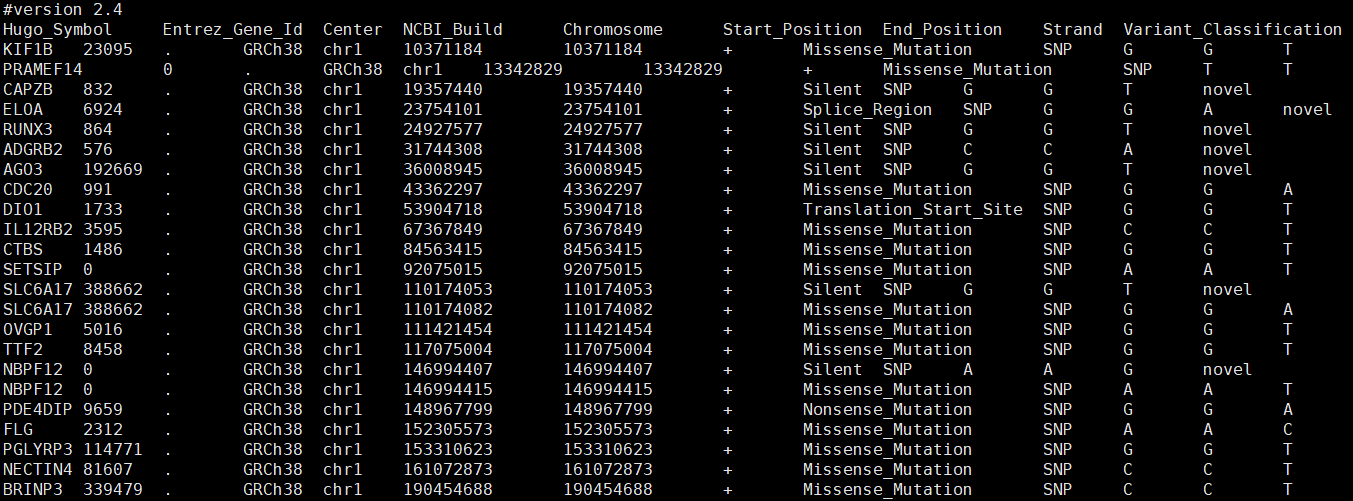
同样用 config 文件进行批量化操作:
$ cat configcase1_biorep_A_techrepcase2_biorep_Acase3_biorep_Acase4_biorep_Acase5_biorep_A......
下面的临时 tsv 文件前三列是我暂时添加的,而 mutation_id 合并于 maf 文件的 Hugo_Symbol、Chromosome 和 Start_Position,顺便把major_cn暂定为2,后面再做修改,最后生成文件命名为 ${id}.tmp.tsv
$ cat config | while read iddocat ./7.annotation/vep/${id}_vep.maf | sed '1,2d' | awk -F '\t' '{print $5"\t"$6"\t"$7"\t"$5":"$6":"$1"\t"$41"\t"$42"\t"2"\t"0"\t"2"\t"}' >./9.pyclone/${id}.tmp.tsvdone$ cat config | while read iddocat ./7.annotation/vep/${id}_vep.maf | sed '1,2d' | awk -F '\t' 'BEGIN{print "Chromosome\tStart_Position\tEnd_Position\tmutation_id\tref_counts\tvar_counts\tnormal_cn\tminor_cn\tmajor_cn"}{print $5"\t"$6"\t"$7"\t"$5":"$6":"$1"\t"$41"\t"$42"\t"2"\t"0"\t"2"\t"}' >./9.pyclone/${id}.tmp.tsvdone
初步的文件内容如下,以 case1_biorep_A_techrep 样本为例,因为后面需要突变位点的坐标信息,所以,前三列是我增加了一些必要坐标,后面六列才是输入文件所必须的:
$head ./9.pyclone/case1_biorep_A_techrep.tmp.tsvchr1 6146376 6146377 chr1:6146376:CHD5 97 3 2 0 2chr1 6461445 6461446 chr1:6461445:TNFRSF25 6 2 2 0 2chr1 31756671 31756672 chr1:31756671:ADGRB2 120 9 2 0 2chr1 32672798 32672799 chr1:32672798:RBBP4 307 16 2 0 2chr1 39441098 39441099 chr1:39441098:MACF1 265 5 2 0 2chr1 39663330 39663331 chr1:39663330:NT5C1A 354 4 2 0 2chr1 43569766 43569767 chr1:43569766:PTPRF 68 12 2 0 2chr1 55156954 55156955 chr1:55156954:USP24 290 6 2 0 2chr1 66770463 66770464 chr1:66770463:TCTEX1D1 362 35 2 0 2chr1 67093601 67093602 chr1:67093601:C1orf141 167 4 2 0 2
然后需要从 segments 文件中获取突变位点的 Segment_Mean,需要先把 segments 文件进行处理,由于直接计算出来的拷贝数为小数,因此需要进行取舍,这里简单的进行四舍五入,如果为 0 ,则删除这条记录:
$ cat config | while read iddocat ./8.cnv/gatk/segments/${id}.cr.igv.seg | sed '1d' | awk 'BEGIN{OFS="\t"}{print $0"\t"int((2^$6)*2+0.5)}'| awk 'BEGIN{OFS="\t"}{if ($7!=0)print $0}' | cut -f 2-6 >./9.pyclone/${id}.beddone## 生成的文件如下$ head ./9.pyclone/case1_biorep_A_techrep.bedchr1 925692 1268241 159 -0.900757 1chr1 1281354 1705274 232 -0.727594 1chr1 1707159 6485692 447 -0.612354 1chr1 6519195 12848538 813 -0.456544 1chr1 12858760 13175822 12 -1.625130 1chr1 13178321 16018212 188 -0.495148 1chr1 16023550 16459245 112 -0.505413 1chr1 16921769 16972695 37 -1.070912 1chr1 16974670 31414313 1816 -0.460105 1chr1 31423443 43404799 1551 0.359218 3
最后用到了 bedtools 工具,把两个文件的坐标进行 overlap 一下,取出必要的列就可以了
$ cat config | while read id;dobedtools window -a ./9.pyclone/${id}.tmp.tsv -b ./9.pyclone/${id}.bed | cut -f 4-8,15 | awk 'BEGIN{OFS="\t";print "mutation_id\tref_counts\tvar_counts\tnormal_cn\tminor_cn\tmajor_cn"}{print $0}' >./9.pyclone/${id}.tsvdone
最后的文件内容如下:
$ head 9.pyclone/case1_biorep_A_techrep.tsvmutation_id ref_counts var_counts normal_cn minor_cn major_cnchr1:6146376:CHD5 97 3 2 0 1chr1:6461445:TNFRSF25 6 2 2 0 1chr1:31756671:ADGRB2 120 9 2 0 3chr1:32672798:RBBP4 307 16 2 0 3chr1:39441098:MACF1 265 5 2 0 3chr1:39663330:NT5C1A 354 4 2 0 3chr1:43569766:PTPRF 68 12 2 0 3chr1:55156954:USP24 290 6 2 0 2chr1:66770463:TCTEX1D1 362 35 2 0 2
实际运行
上面处理好文件格式后,保留下面的 tsv 文件,其他临时文件可以删除掉
$ ls ./9.pyclone/case1_biorep_A_techrep.tsv case2_biorep_A.tsv case3_biorep_A.tsv case4_biorep_A.tsv case5_biorep_A.tsv case6_biorep_A_techrep.tsvcase1_biorep_B.tsv case2_biorep_B_techrep.tsv case3_biorep_B.tsv case4_biorep_B_techrep.tsv case5_biorep_B_techrep.tsv case6_biorep_B.tsvcase1_biorep_C.tsv case2_biorep_C.tsv case3_biorep_C_techrep.tsv case4_biorep_C.tsv case5_biorep_C.tsv case6_biorep_C.tsvcase1_techrep_2.tsv case2_techrep_2.tsv case3_techrep_2.tsv case4_techrep_2.tsv case5_techrep_2.tsv case6_techrep_2.tsv
然后就可以使用 pyclone 进行分析了,代码是:
conda activate pyclonefor i in case{1..6}doPyClone run_analysis_pipeline --prior total_copy_number --in_files ./9.pyclone/${i}*tsv --working_dir ./9.pyclone/${i}_pyclone_analysis 1>./9.pyclone/${i}.log 2>&1done
结果每个样本会得到以下文件,文件的介绍前面已经说过了:
$ tree ./9.pyclone/case1_pyclone_analysis/9.pyclone/case1_pyclone_analysis/├── config.yaml├── plots│ ├── cluster│ │ ├── density.pdf│ │ ├── parallel_coordinates.pdf│ │ └── scatter.pdf│ └── loci│ ├── density.pdf│ ├── parallel_coordinates.pdf│ ├── scatter.pdf│ ├── similarity_matrix.pdf│ ├── vaf_parallel_coordinates.pdf│ └── vaf_scatter.pdf├── tables│ ├── cluster.tsv│ └── loci.tsv├── trace│ ├── alpha.tsv.bz2│ ├── case1_biorep_A_techrep.cellular_prevalence.tsv.bz2│ ├── case1_biorep_B.cellular_prevalence.tsv.bz2│ ├── case1_biorep_C.cellular_prevalence.tsv.bz2│ ├── case1_techrep_2.cellular_prevalence.tsv.bz2│ ├── labels.tsv.bz2│ └── precision.tsv.bz2└── yaml├── case1_biorep_A_techrep.yaml├── case1_biorep_B.yaml├── case1_biorep_C.yaml└── case1_techrep_2.yaml6 directories, 23 files
结果解读
在上面得到的可视化结果中,可以得到 6 个 case 的 4 个样本的克隆分布:
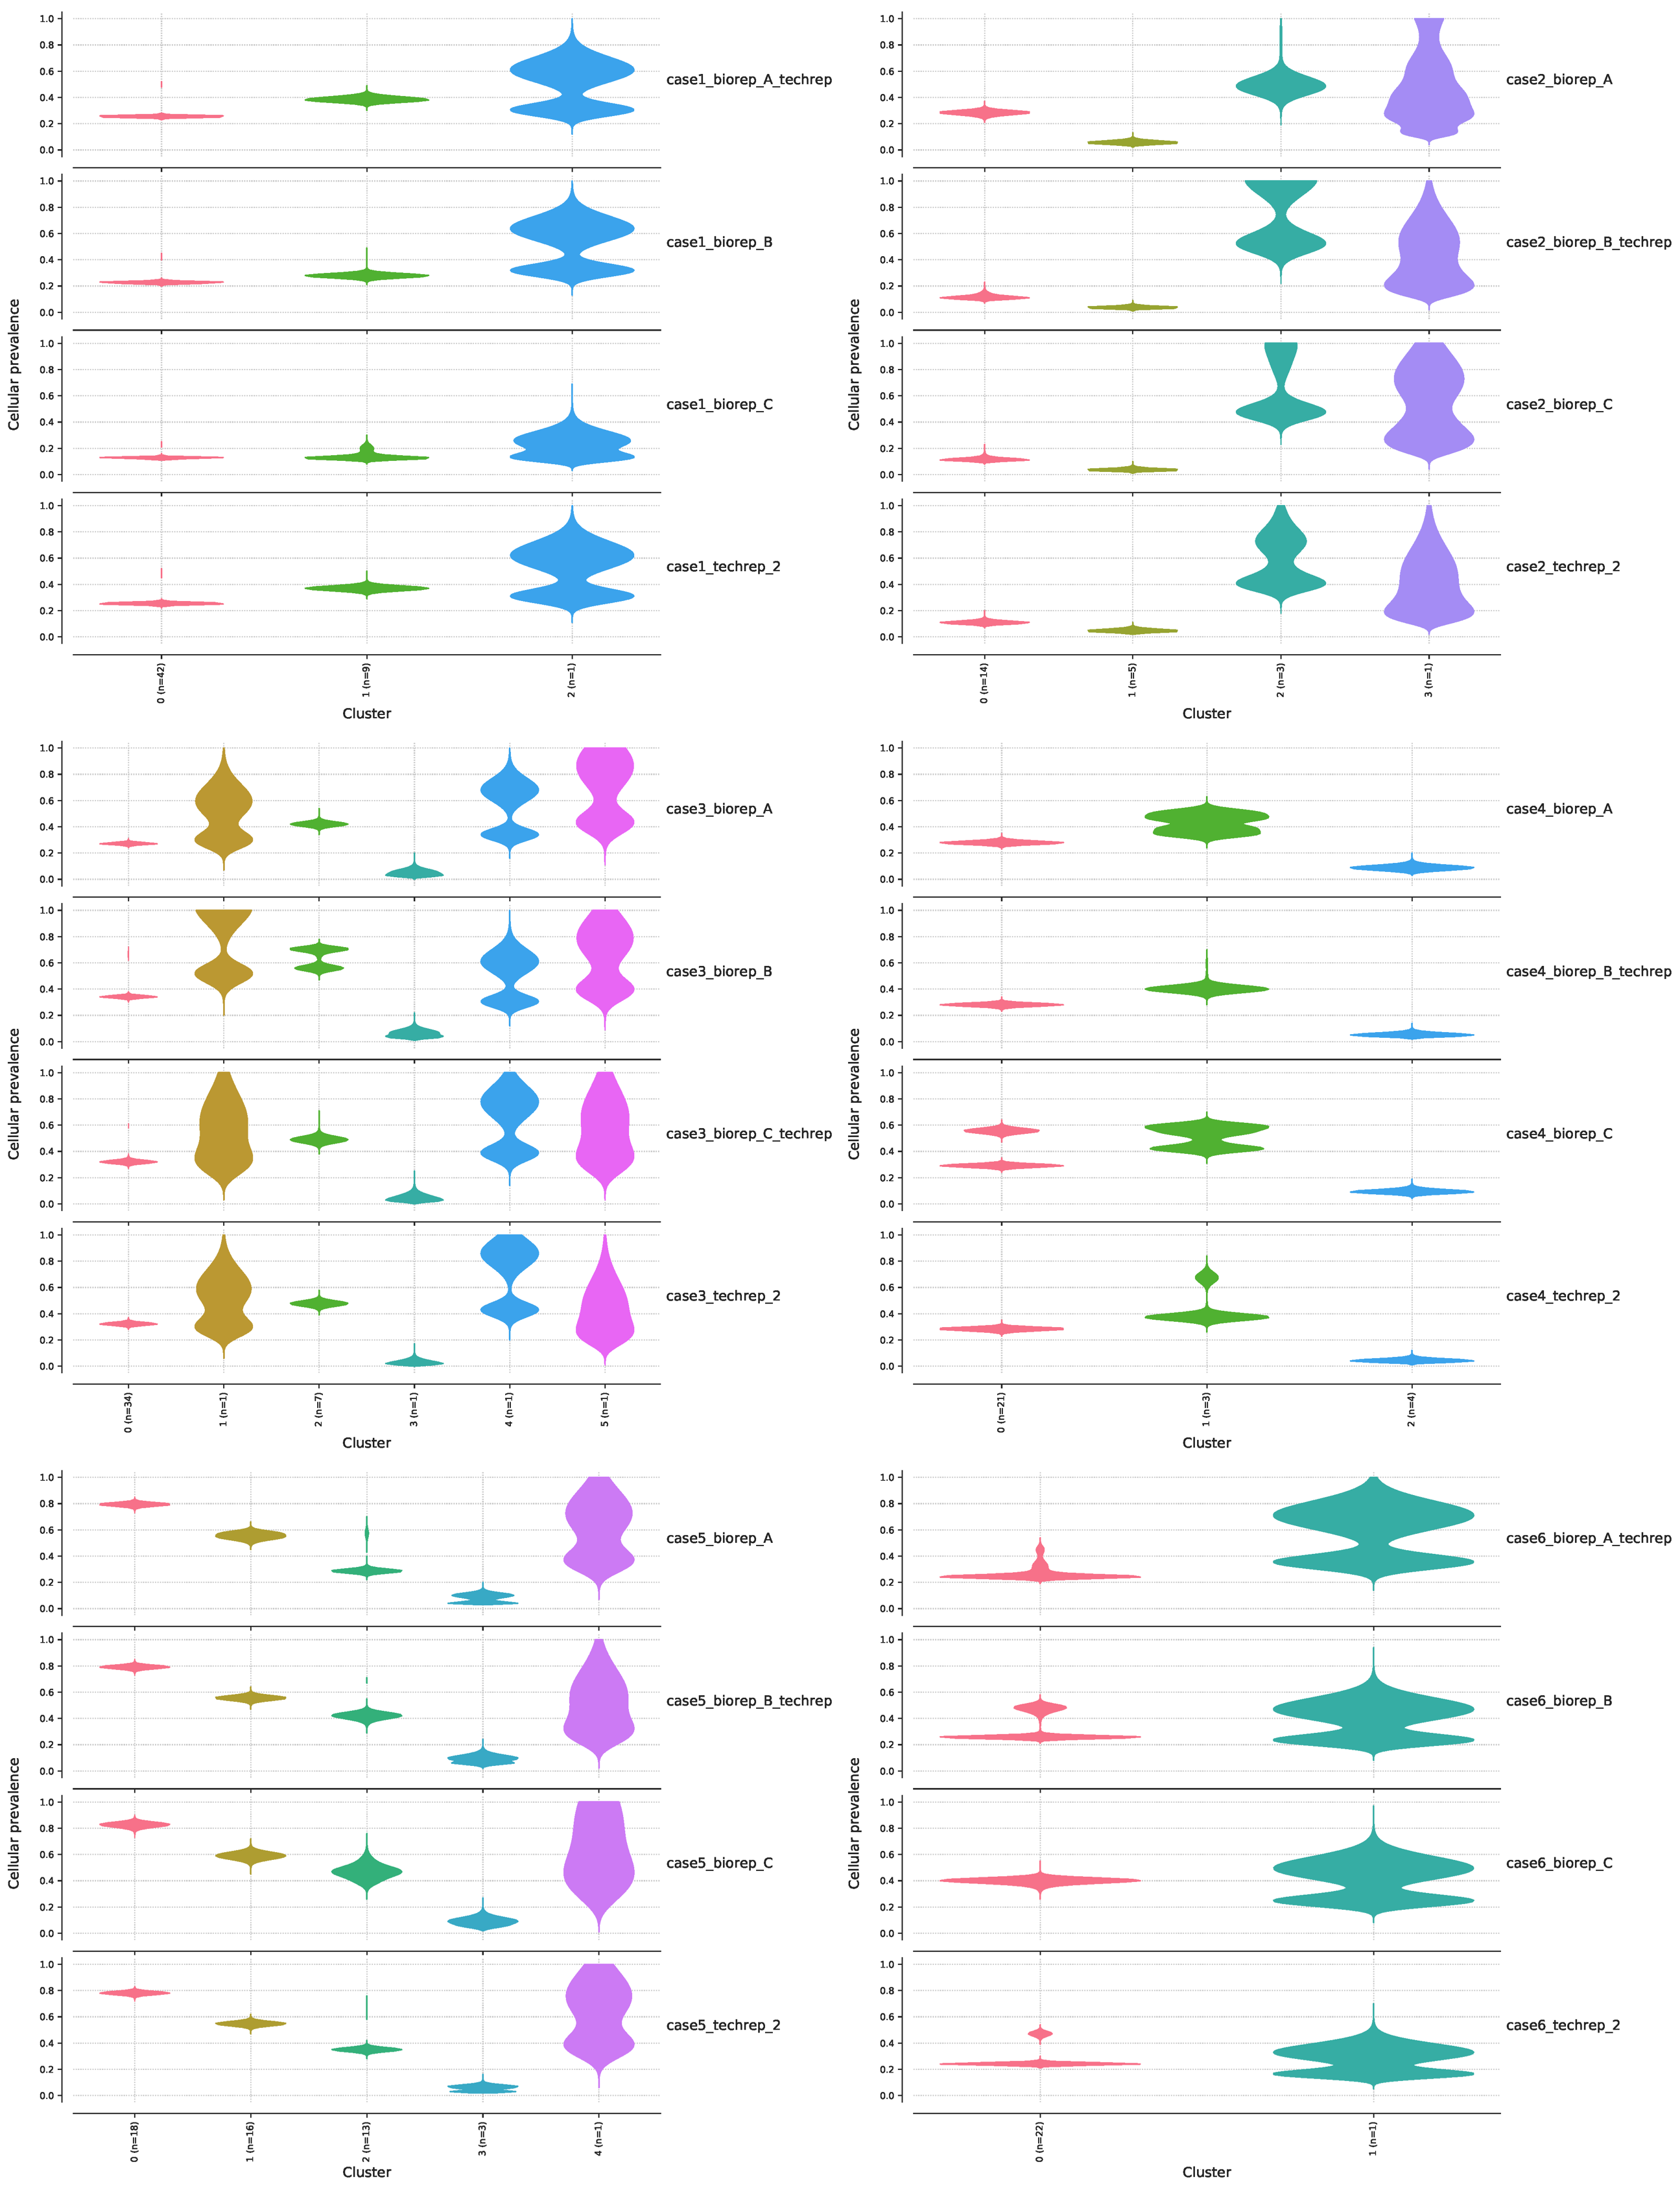
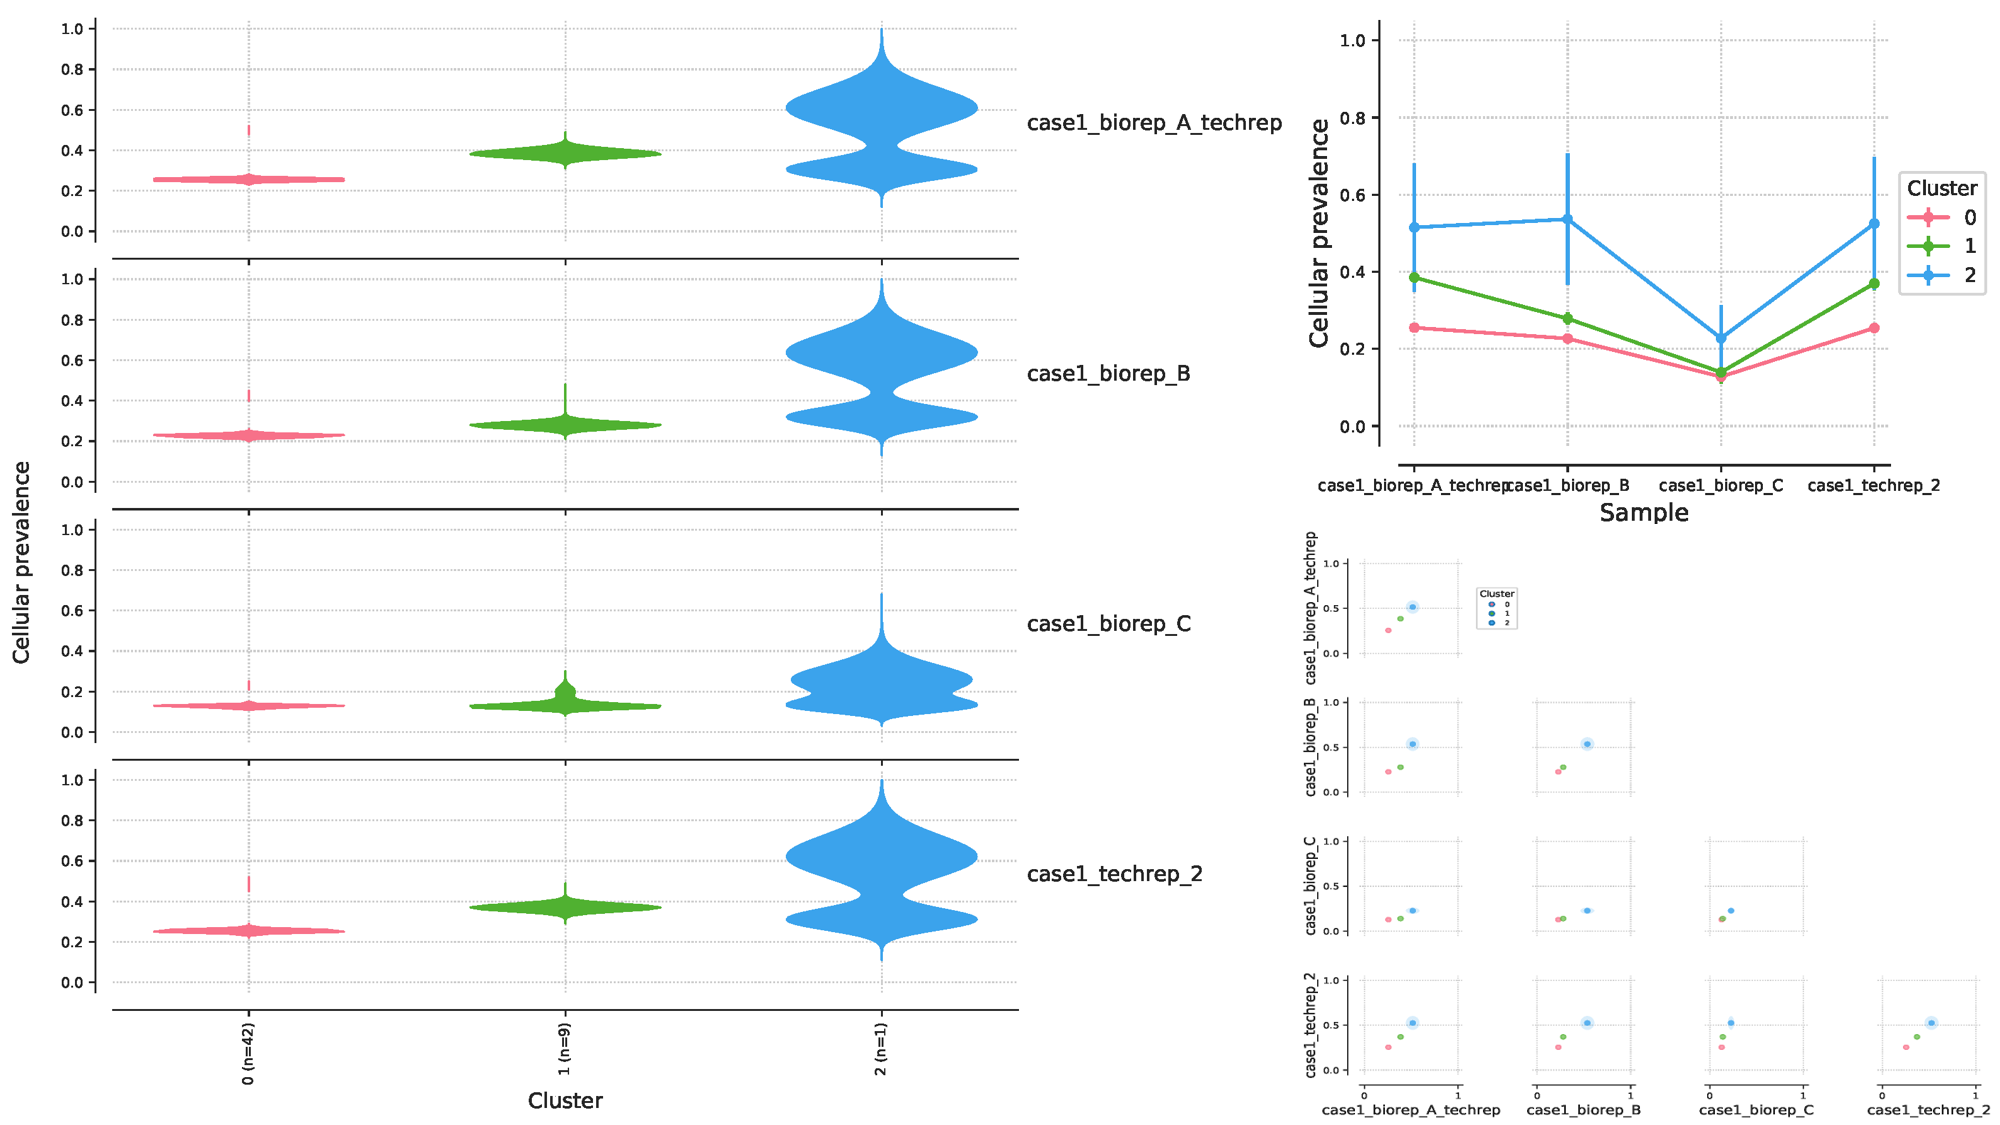
我们还是同样取一个结果来分析就好,看一下 case1 的 4 个样本:从下面左边的图可以看到,这 4 个样本的突变可以分为 3 个 clusters,每个 clusters 的细胞患病率有所异同,每个 clusters 所含有的突变数量 n 也不同(cluster0=42,cluster1=9,cluster2=1),总共有42个突变位点,这 42 个位点的特殊性在于,它们在 4 个样本中都出现了,而没有在 4 个样本中同时出现的位点被过滤掉了,后面我们再统计一下。右上角的图是左边图的另一种可视化方式而已,表达的意思是相同的。右下角的图则展示了样本间的 clusters 的相关性。
结果探索
在 pyclone 给出的结果中,有一个 tsv 文件,如 ./9.pyclone/case1_pyclone_analysis/tables/loci.tsv ,记录了每个突变位点在每个样本中的 cellular_prevalence 等信息:
## 简单查看一下文件$ head ./9.pyclone/case1_pyclone_analysis/tables/loci.tsvmutation_id sample_id cluster_id cellular_prevalence cellular_prevalence_std variant_allele_frequencychr10:106667729:SORCS1 case1_techrep_2 1 0.38945511580114206 0.09005473036678552 0.33636363636363636chr10:106667729:SORCS1 case1_biorep_A_techrep 1 0.4114724772400249 0.09182455522743185 0.41732283464566927chr10:106667729:SORCS1 case1_biorep_B 1 0.3278834507743034 0.1081393780875951 0.35135135135135137chr10:106667729:SORCS1 case1_biorep_C 1 0.15107809443018044 0.0427504992112245840.12162162162162163chr11:1239839:MUC5B case1_techrep_2 0 0.2699492592281054 0.0480038226973345460.2191780821917808chr11:1239839:MUC5B case1_biorep_A_techrep 0 0.26436648312757505 0.03631276265297281 0.28440366972477066chr11:1239839:MUC5B case1_biorep_B 0 0.23952487069280487 0.04520172519105122 0.2125chr11:1239839:MUC5B case1_biorep_C 0 0.1293905024834781 0.0125701637262017550.11904761904761904chr11:32760188:CCDC73 case1_techrep_2 0 0.26556420619555277 0.04447389697314711 0.31137724550898205## 简单统计一下第一列,可以看到每个突变都出现了4次,因为 4 个样本$ cat ./9.pyclone/case1_pyclone_analysis/tables/loci.tsv | sed '1d' | cut -f 1 | sort | uniq -c4 chr10:106667729:SORCS14 chr11:1239839:MUC5B4 chr11:32760188:CCDC734 chr11:46895907:LRP44 chr1:152719922:C1orf684 chr1:156936822:ARHGEF11......4 chr9:123583176:DENND1A4 chr9:35658448:CCDC1074 chrX:115649481:PLS34 chrX:24494834:PDK34 chrX:32310230:DMD4 chrX:77683174:ATRX## 总共52个突变$ cat ./9.pyclone/case1_pyclone_analysis/tables/loci.tsv | sed '/mutation_id/d' | cut -f 1|sort |uniq -c |wc -l52
然后用 R 语言看看 pyclone 给出的 cellular_prevalence 和 variant_allele_frequency 也就是原来的输入文件中的 vaf=var_counts/(ref_counts+var_counts) 值有什么关系,代码如下:
rm(list = ls())options(stringsAsFactors = F)case1_loci = read.table("./9.pyclone/case1_pyclone_analysis/tables/loci.tsv",header = T)# 获取clusters 的分组信息clusters_list = unique(case1_loci[, c(1, 3)])rownames(clusters_list) = clusters_list[, 1]cluster_id = data.frame(cluster_id = as.character(clusters_list$cluster_id))rownames(cluster_id) = clusters_list[, 1]# 获取同一个突变位点在不同样本中的cellular_prevalence,然后画热图可视化library(tidyr)cellular_prevalence = spread(case1_loci[, c(1, 2, 4)], key = sample_id, value = cellular_prevalence)rownames(cellular_prevalence) = cellular_prevalence[, 1]cellular_prevalence = cellular_prevalence[,-1]sampe_id = colnames(cellular_prevalence)cellular_prevalence = as.data.frame(t(apply(cellular_prevalence, 1, as.numeric)))colnames(cellular_prevalence) = sampe_idpheatmap::pheatmap(cellular_prevalence,annotation_row = cluster_id,show_rownames = F,clustering_method = 'median',angle_col = 0)# 获取同一个突变位点在不同样本中的variant_allele_frequency,也就是vaf,同样可视化,为了聚类,采用了不同的聚类方法library(tidyr)variant_allele_frequency = spread(case1_loci[, c(1, 2, 6)], key = sample_id, value = variant_allele_frequency)rownames(variant_allele_frequency) = variant_allele_frequency[, 1]variant_allele_frequency = variant_allele_frequency[,-1]sampe_id = colnames(variant_allele_frequency)variant_allele_frequency = as.data.frame(t(apply(variant_allele_frequency, 1, as.numeric)))colnames(variant_allele_frequency) = sampe_idpheatmap::pheatmap(cellular_prevalence,annotation_row = cluster_id,show_rownames = F,clustering_method = 'average',angle_col = 0)
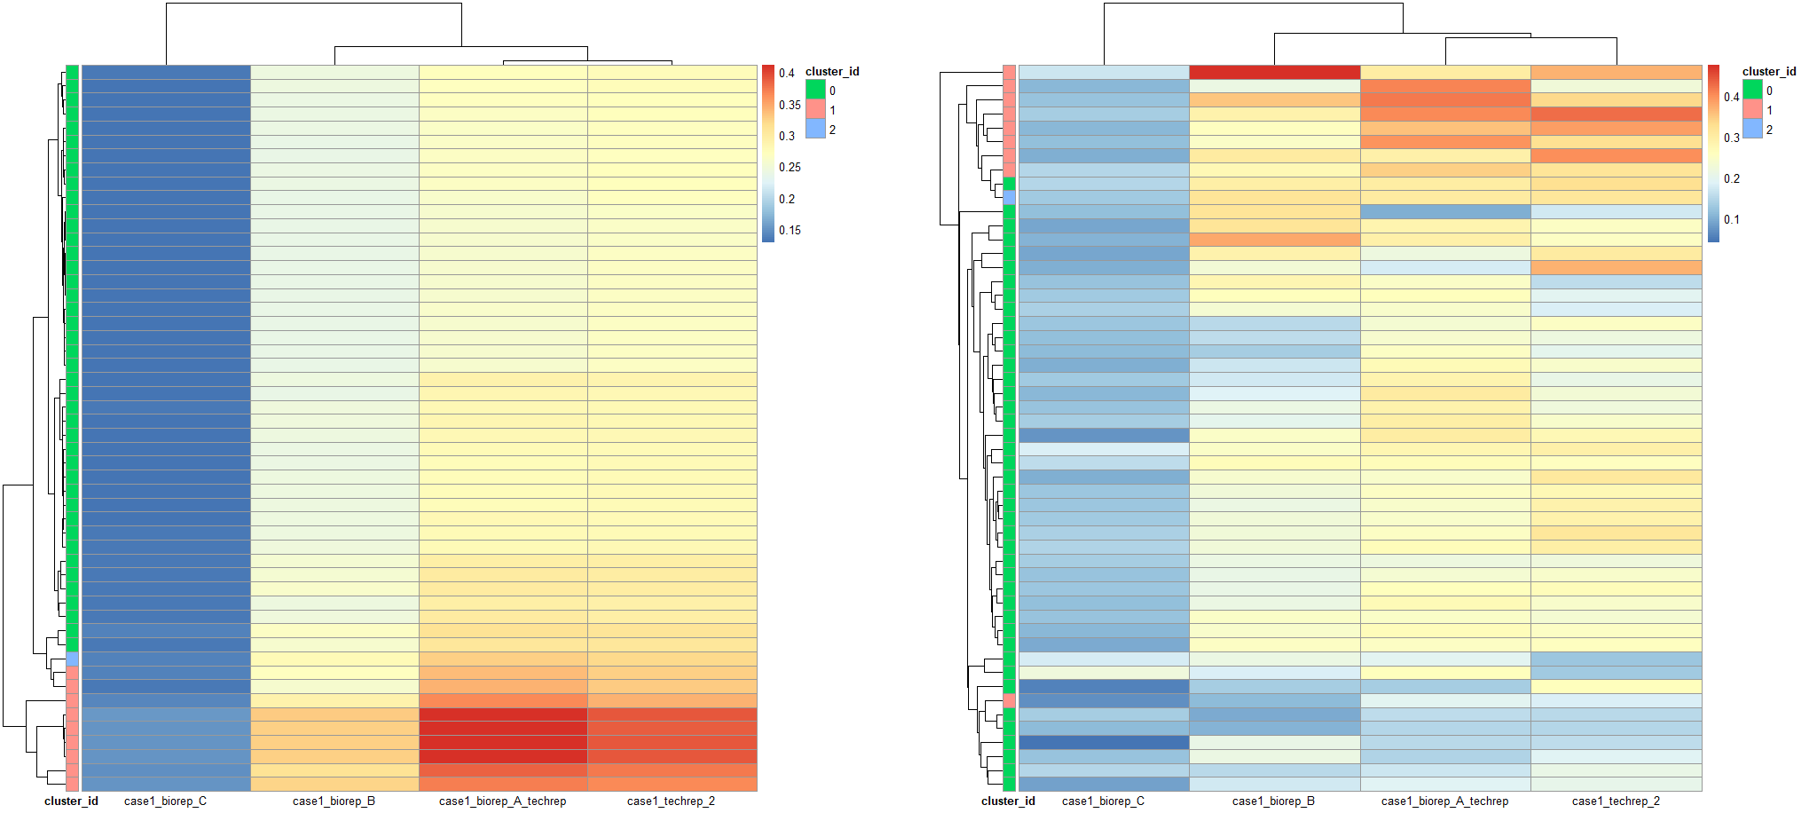
这个结果有点相似了,然后我拿作者的测试数据也画了热图比较:
# 看作者给的测试数据example_loci = read.table("~/wes_cancer/biosoft/pyclone/examples/pyclone_analysis/tables/loci.tsv", header = T)# 获取clusters 的分组信息clusters_list = unique(example_loci[, c(1, 3)])rownames(clusters_list) = clusters_list[, 1]cluster_id = data.frame(cluster_id = as.character(clusters_list$cluster_id))rownames(cluster_id) = clusters_list[, 1]# 获取同一个突变位点在不同样本中的cellular_prevalence,热图可视化library(tidyr)cellular_prevalence = spread(example_loci[, c(1, 2, 4)], key = sample_id, value = cellular_prevalence)rownames(cellular_prevalence) = cellular_prevalence[, 1]cellular_prevalence = cellular_prevalence[,-1]sampe_id = colnames(cellular_prevalence)cellular_prevalence = as.data.frame(t(apply(cellular_prevalence, 1, as.numeric)))colnames(cellular_prevalence) = sampe_idpheatmap::pheatmap(cellular_prevalence,annotation_row = cluster_id,show_rownames = F,angle_col = 0)# 获取同一个突变位点在不同样本中的variant_allele_frequency,热图可视化library(tidyr)variant_allele_frequency = spread(example_loci[, c(1, 2, 6)], key = sample_id, value = variant_allele_frequency)rownames(variant_allele_frequency) = variant_allele_frequency[, 1]variant_allele_frequency = variant_allele_frequency[,-1]sampe_id = colnames(variant_allele_frequency)variant_allele_frequency = as.data.frame(t(apply(variant_allele_frequency, 1, as.numeric)))colnames(variant_allele_frequency) = sampe_idpheatmap::pheatmap(variant_allele_frequency,annotation_row = cluster_id,show_rownames = F,angle_col = 0)
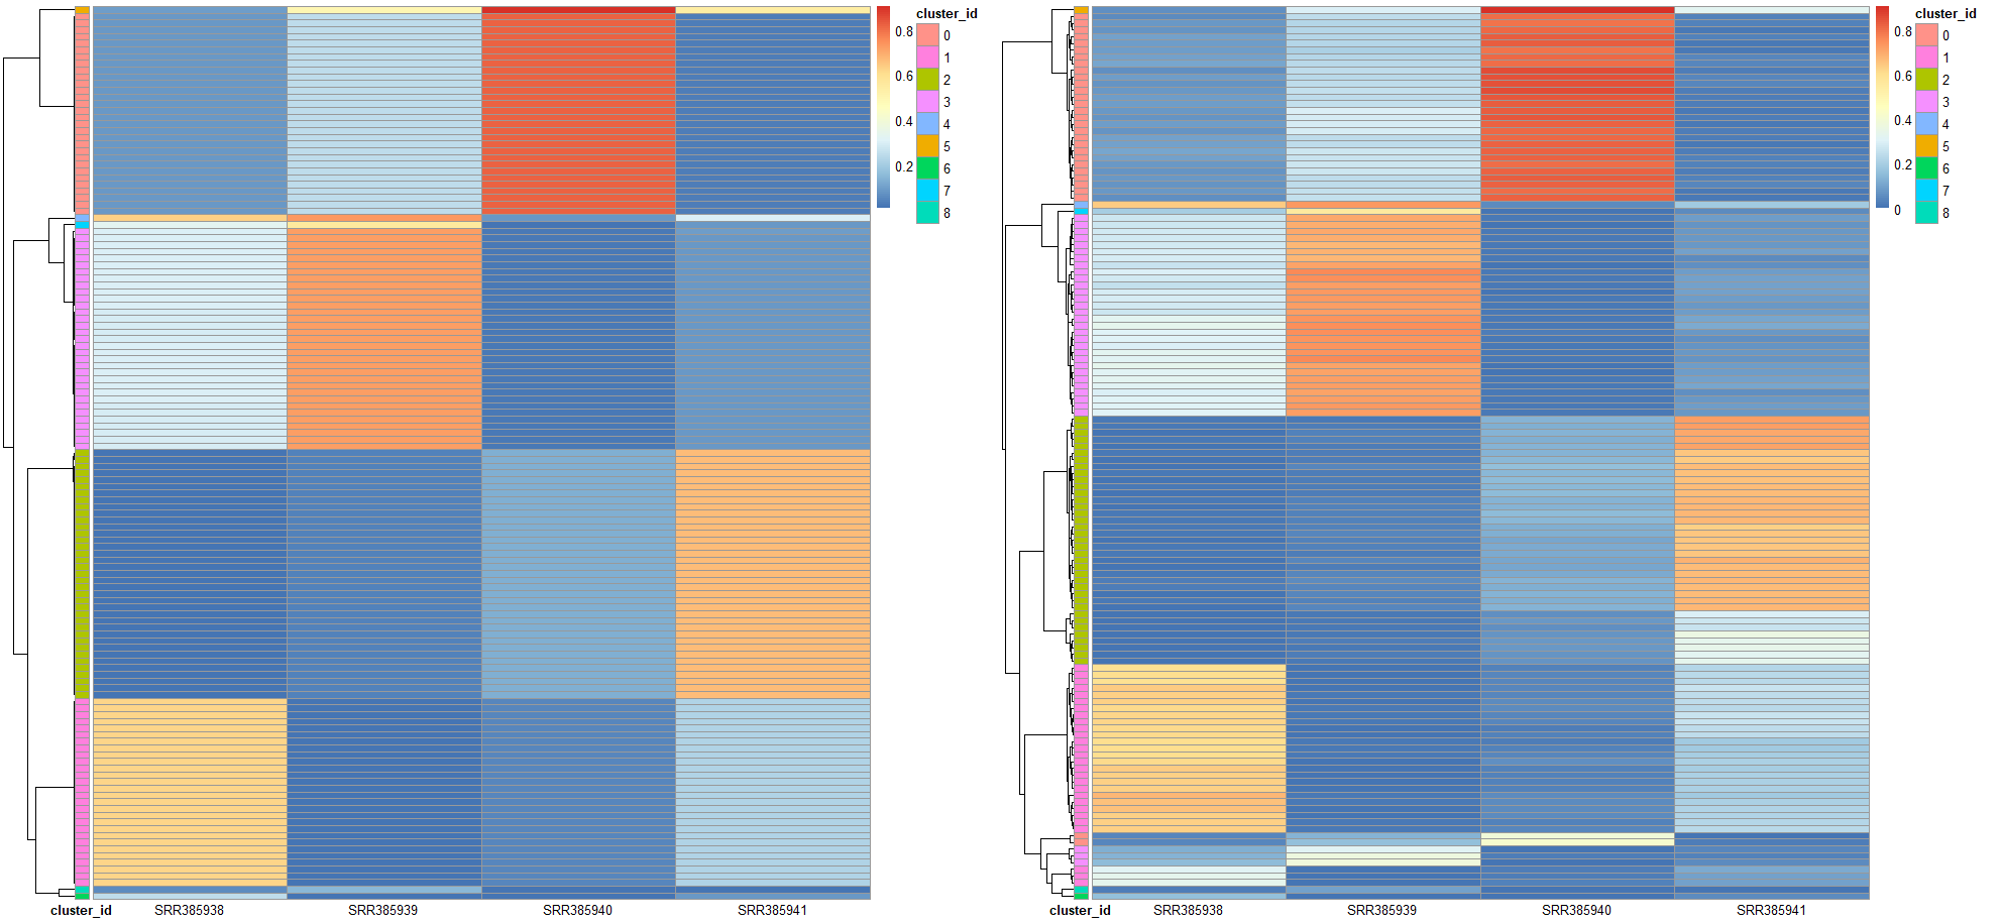
因为作者的数据是物理混合的样本,所以得到的结果非常整齐,而且基本上就可以确定,克隆结构的推断得到的 clusters 和突变频率 vaf 具有非常强的相关性:
> cor(case1_loci[,c(4,6)])# cellular_prevalence variant_allele_frequency# cellular_prevalence 1.0000000 0.7799067# variant_allele_frequency 0.7799067 1.0000000> cor(example_loci[,c(4,6)])# cellular_prevalence variant_allele_frequency# cellular_prevalence 1.0000000 0.9717476# variant_allele_frequency 0.9717476 1.0000000

