1.什么是异常检测
异常检测(Outlier Detection),顾名思义,是识别与正常数据不同的数据,与预期行为差异大的数
据。识别如信用卡欺诈,工业生产异常,网络流里的异常(网络侵入)等问题,针对的是少数的事件。
1.1异常的类别

1.2异常检测任务分类

1.3异常检测场景
- 故障检测
- 物联网异常检测
- 欺诈检测
- 工业异常检测
- 时间序列异常检测
- 视频异常检测
- 日志异常检测
- 医疗日常检测
- 网络入侵检测
2.异常检测常用方法
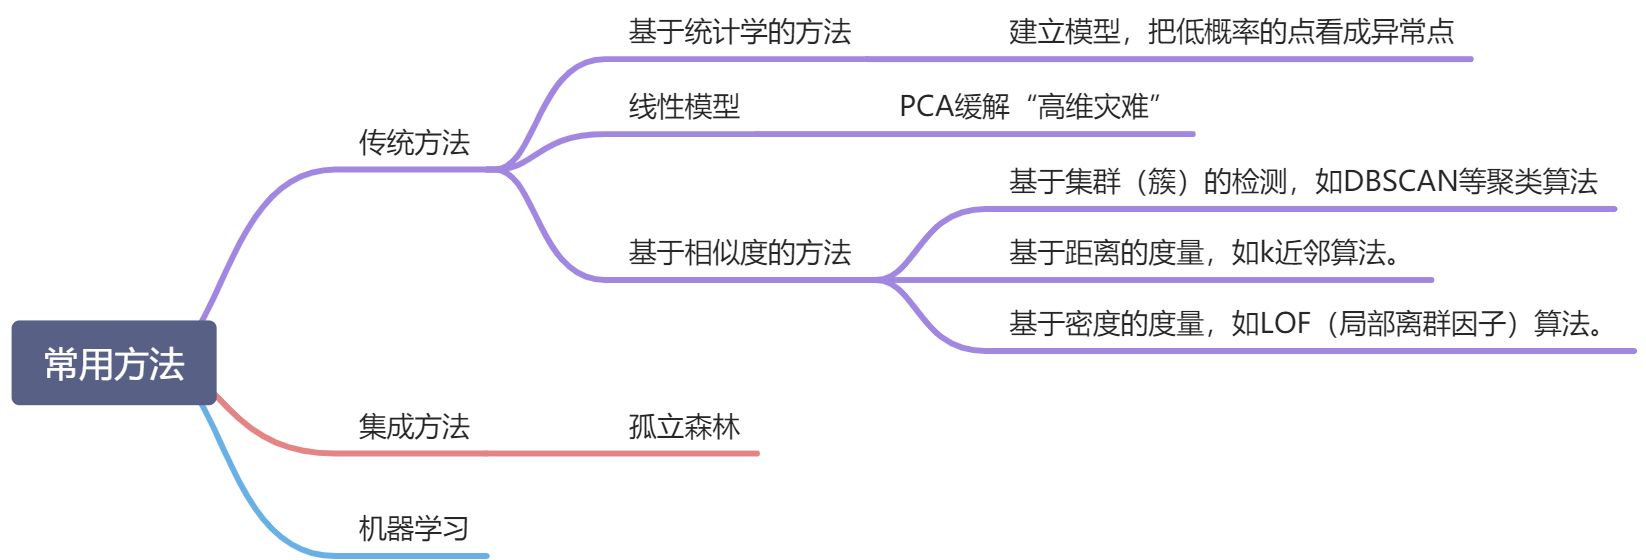
PCA算法数学实例
PCA(Principal Component Analysis)是一种常用的数据分析方法。PCA通过线性变换将原始数据变换为一组各维度线性无关的表示,可用于提取数据的主要特征分量,常用于高维数据的降维。详细来源来源实例:http://blog.codinglabs.org/articles/pca-tutorial.html
PCA的应用实例:https://blog.csdn.net/qq_15111861/article/details/94185363
DBSCAN和LOF的异同:http://blog.sina.com.cn/s/blog_ab089a840102ylin.html
3.异常检测常用开源库
Scikit-learn
Scikit-learn是一个Python语言的开源机器学习库。它具有各种分类,回归和聚类算法。也包含了一些
异常检测算法,例如LOF和孤立森林。
官网:https://scikit-learn.org/stable/
PyOD
Python Outlier Detection(PyOD)是当下最流行的Python异常检测工具库,其主要亮点包
括:
包括近20种常见的异常检测算法,比如经典的LOF/LOCI/ABOD以及最新的深度学习如对抗生
成模型(GAN)和集成异常检测(outlier ensemble)
支持不同版本的Python:包括2.7和3.5+;支持多种操作系统:windows,macOS和Linux
简单易用且一致的API,只需要几行代码就可以完成异常检测,方便评估大量算法
使用JIT和并行化(parallelization)进行优化,加速算法运行及扩展性(scalability),可以
处理大量数据。
官网:https://pyod.readthedocs.io/en/latest/
练习
学习pyod库基本操作。
from __future__ import divisionfrom __future__ import print_functionimport osimport sys# temporary solution for relative imports in case pyod is not installed# if pyod is installed, no need to use the following linesys.path.append(os.path.abspath(os.path.join(os.path.dirname("__file__"), '..')))from pyod.models.lof import LOFfrom pyod.utils.data import generate_datafrom pyod.utils.data import evaluate_printfrom pyod.utils.example import visualizeif __name__ == "__main__":contamination = 0.1 # percentage of outliersn_train = 200 # number of training pointsn_test = 100 # number of testing points# Generate sample dataX_train, y_train, X_test, y_test = \generate_data(n_train=n_train,n_test=n_test,n_features=2,contamination=contamination,random_state=42)# train LOF detectorclf_name = 'LOF'clf = LOF()clf.fit(X_train)# get the prediction labels and outlier scores of the training datay_train_pred = clf.labels_ # binary labels (0: inliers, 1: outliers)y_train_scores = clf.decision_scores_ # raw outlier scores# get the prediction on the test datay_test_pred = clf.predict(X_test) # outlier labels (0 or 1)y_test_scores = clf.decision_function(X_test) # outlier scores# evaluate and print the resultsprint("\nOn Training Data:")evaluate_print(clf_name, y_train, y_train_scores)print("\nOn Test Data:")evaluate_print(clf_name, y_test, y_test_scores)# visualize the resultsvisualize(clf_name, X_train, y_train, X_test, y_test, y_train_pred,y_test_pred, show_figure=True, save_figure=False)

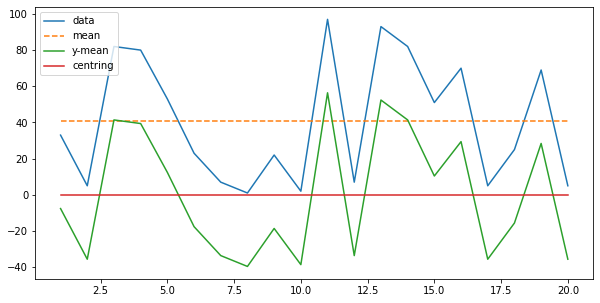
归一化的图例
import numpy as npimport pandas as pdimport matplotlib.pyplot as plty = np.random.randint(1,100,20)x = np.arange(1,21)mean = np.mean(y)plt.figure(figsize=(10, 5))data, = plt.plot(x,y)meanLine, = plt.plot(x,[mean]*20,linestyle = '--')translationLine, =plt.plot(x,y-mean)centringLine, = plt.plot(x,[np.mean(y-mean)]*20)plt.legend([data,meanLine,translationLine,centringLine], ["data", "mean","y-mean","centring"], loc='upper left')

若有收获,就点个赞吧
0 人点赞
