- 1.最基础的例子
- 3.可重复使用组件
- Run this app with
python app.pyand - http://127.0.0.1:8050/ in your web browser.">visit http://127.0.0.1:8050/ in your web browser.
- 5.Markdown
- 6.核心组件
- 总结
Dash应用程序由两部分组成。第一部分是布局(layout),描述应用程序的设计样式;第二部分描述了应用程序的交互性。
Dash为应用程序的所有可视化组件,提供了Python类,在dash_core_components库和dash_html_components库中,进行组件的维护。当然,也可以使用 JavaScript 和 React.js 构建自己的组件。
注: 在这篇文章中, Python中所有的代码通过app.py执行, 如果需要用Jupyter可以使用 JupyterDash。
1.最基础的例子
# -*- coding: utf-8 -*-# Run this app with `python app.py` and# visit http://127.0.0.1:8050/ in your web browser.import dashimport dash_core_components as dccimport dash_html_components as htmlimport plotly.express as pximport pandas as pdexternal_stylesheets = ['https://codepen.io/chriddyp/pen/bWLwgP.css']app = dash.Dash(__name__, external_stylesheets=external_stylesheets)# assume you have a "long-form" data frame# see https://plotly.com/python/px-arguments/ for more optionsdf = pd.DataFrame({"Fruit": ["Apples", "Oranges", "Bananas", "Apples", "Oranges", "Bananas"],"Amount": [4, 1, 2, 2, 4, 5],"City": ["SF", "SF", "SF", "Montreal", "Montreal", "Montreal"]})fig = px.bar(df, x="Fruit", y="Amount", color="City", barmode="group")app.layout = html.Div(children=[html.H1(children='Hello Dash'),html.Div(children='''Dash: A web application framework for Python.'''),dcc.Graph(id='example-graph',figure=fig)])if __name__ == '__main__':app.run_server(debug=True)
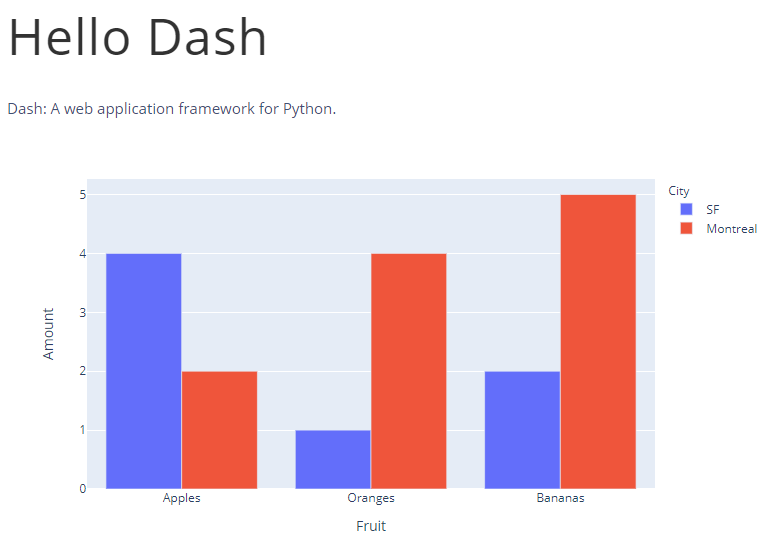
- 布局
**layout**由**html.Div**和**dcc.Graph**这样的组件树组成; - Dash是 声明式 的,通过关键字参数描述组件。即Dash主要通过属性描述应用,如
style、className、id等; children属性是特殊的。通常来说,他总是第一个属性。html.H1(children='Hello Dash')等同于html.H1('Hello Dash')。里面也可以用字符串、列表、单个组件构成;- 应用程序中的字体与这里显示的字体看起来有些不同。这个应用程序使用一个定制的CSS样式表来修改元素的默认样式。你可以在css教程中学习更多,但现在你可以用: ```python external_stylesheets = [‘https://codepen.io/chriddyp/pen/bWLwgP.css‘]
app = dash.Dash(name, external_stylesheets=external_stylesheets)
来定义样式。<br />当你指定`app.run_server(debug=True)`的时候。Dash就变成了一个热重载的组件,默认修改代码,浏览器跟着重新渲染。<a name="L6zbd"></a># 2.修改一些样式`dash_html_components`库包含每个HTML标记的组件类,以及所有HTML参数的关键字参数。<br />通过修改组件的内联样式来定制应用程序中的文本:```python# -*- coding: utf-8 -*-# Run this app with `python app.py` and# visit http://127.0.0.1:8050/ in your web browser.import dashimport dash_core_components as dccimport dash_html_components as htmlimport plotly.express as pximport pandas as pdexternal_stylesheets = ['https://codepen.io/chriddyp/pen/bWLwgP.css']app = dash.Dash(__name__, external_stylesheets=external_stylesheets)colors = {'background': '#111111','text': '#7FDBFF'}# assume you have a "long-form" data frame# see https://plotly.com/python/px-arguments/ for more optionsdf = pd.DataFrame({"Fruit": ["Apples", "Oranges", "Bananas", "Apples", "Oranges", "Bananas"],"Amount": [4, 1, 2, 2, 4, 5],"City": ["SF", "SF", "SF", "Montreal", "Montreal", "Montreal"]})fig = px.bar(df, x="Fruit", y="Amount", color="City", barmode="group")fig.update_layout(plot_bgcolor=colors['background'],paper_bgcolor=colors['background'],font_color=colors['text'])app.layout = html.Div(style={'backgroundColor': colors['background']}, children=[html.H1(children='Hello Dash',style={'textAlign': 'center','color': colors['text']}),html.Div(children='Dash: A web application framework for Python.', style={'textAlign': 'center','color': colors['text']}),dcc.Graph(id='example-graph-2',figure=fig)])if __name__ == '__main__':app.run_server(debug=True)
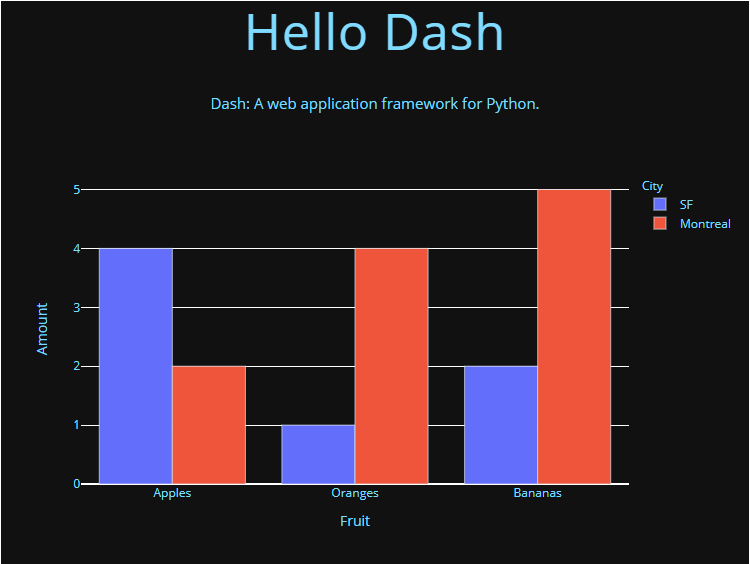
dash_html_components 和 HTML 有几个重要的区别
- HTML中的style属性是一个以分号分隔的字符串。在Dash中,是一个字典。
- 在Dash中,style字典键是驼峰式的命名法,而在HTML中是
-的形式如:textAlign和text-align - HTML 的 class 属性,对应Dash中的 className。
- HTML 的子项是通过 children关键字参数指定的,按照惯例,这始终是第一个参数,经常被省略;
- 除了上述外,其他所有HTML属性与标签,在Python中都有效。
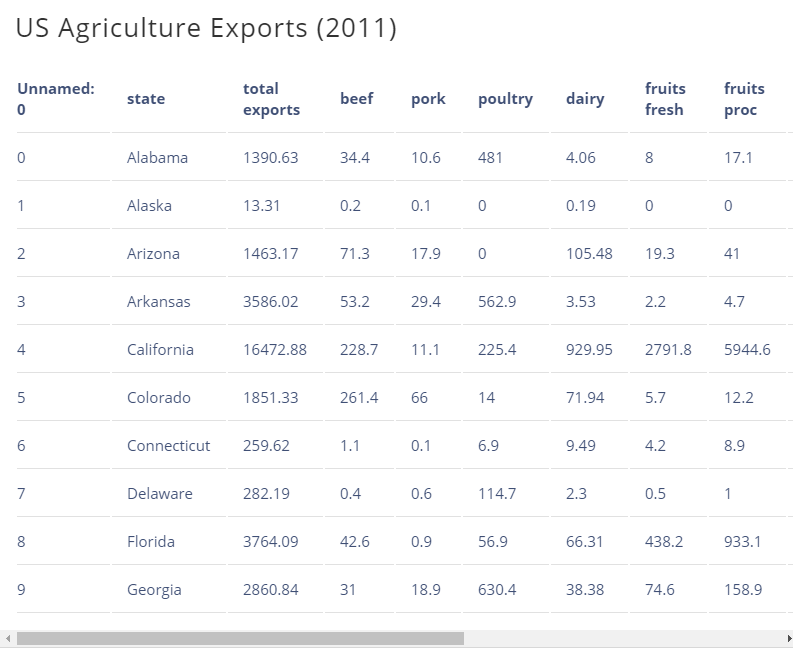
3.可重复使用组件
通过用Python编写标记,我们可以创建复杂的可重用组件,如表,而无需切换上下文或语言。 ```pythonRun this app with
python app.pyandvisit http://127.0.0.1:8050/ in your web browser.
import dash import dash_html_components as html import pandas as pd
df = pd.read_csv(‘https://gist.githubusercontent.com/chriddyp/c78bf172206ce24f77d6363a2d754b59/raw/c353e8ef842413cae56ae3920b8fd78468aa4cb2/usa-agricultural-exports-2011.csv‘)
def generate_table(dataframe, max_rows=10): return html.Table([ html.Thead( html.Tr([html.Th(col) for col in dataframe.columns]) ), html.Tbody([ html.Tr([ html.Td(dataframe.iloc[i][col]) for col in dataframe.columns ]) for i in range(min(len(dataframe), max_rows)) ]) ])
external_stylesheets = [‘https://codepen.io/chriddyp/pen/bWLwgP.css‘]
app = dash.Dash(name, external_stylesheets=external_stylesheets)
app.layout = html.Div(children=[ html.H4(children=’US Agriculture Exports (2011)’), generate_table(df) ])
if name == ‘main‘: app.run_server(debug=True)
> <a name="ySDyp"></a># 4.关于更多可视化**`dash_core_components`**库包含一个名为`**Graph**`的组件。<br />`Graph`使用开源的`plotly.js` `JavaScript`图形库呈现交互式数据可视化。js支持超过35种图表类型,用矢量质量的SVG和高性能的WebGL渲染图表。<br />**`dash_core_components`**中的图参数。图形组件与**`plotly`**使用的图形参数相同。**`Plotly`**的开源Python图形库。请查看plotly.py文档和图库以了解更多信息。Check out the [plotly.py documentation and gallery](https://plotly.com/python) to learn more.```python# Run this app with `python app.py` and# visit http://127.0.0.1:8050/ in your web browser.import dashimport dash_core_components as dccimport dash_html_components as htmlimport plotly.express as pximport pandas as pdexternal_stylesheets = ['https://codepen.io/chriddyp/pen/bWLwgP.css']app = dash.Dash(__name__, external_stylesheets=external_stylesheets)df = pd.read_csv('https://gist.githubusercontent.com/chriddyp/5d1ea79569ed194d432e56108a04d188/raw/a9f9e8076b837d541398e999dcbac2b2826a81f8/gdp-life-exp-2007.csv')fig = px.scatter(df, x="gdp per capita", y="life expectancy",size="population", color="continent", hover_name="country",log_x=True, size_max=60)app.layout = html.Div([dcc.Graph(id='life-exp-vs-gdp',figure=fig)])if __name__ == '__main__':app.run_server(debug=True)
这些图形是交互式和响应性的。将鼠标悬停在点上可以看到它们的值,单击图例项目可以切换轨迹,单击并拖动可以缩放,按住shift键,单击并拖动可以平移。
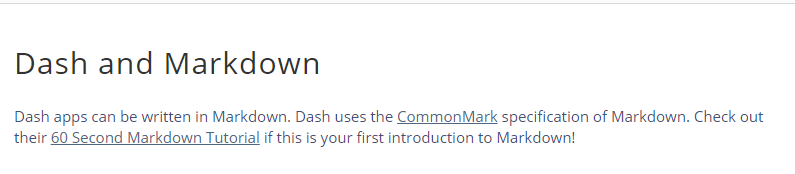
5.Markdown
虽然Dash通过dash_html_components库显示**HTML**,但用HTML编写副本可能会很乏味。为了编写文本块,可以使用dash_core_components库中的Markdown组件。代码如下:
# Run this app with `python app.py` and# visit http://127.0.0.1:8050/ in your web browser.import dashimport dash_core_components as dccimport dash_html_components as htmlexternal_stylesheets = ['https://codepen.io/chriddyp/pen/bWLwgP.css']app = dash.Dash(__name__, external_stylesheets=external_stylesheets)markdown_text = '''### Dash and MarkdownDash apps can be written in Markdown.Dash uses the [CommonMark](http://commonmark.org/)specification of Markdown.Check out their [60 Second Markdown Tutorial](http://commonmark.org/help/)if this is your first introduction to Markdown!'''app.layout = html.Div([dcc.Markdown(children=markdown_text)])if __name__ == '__main__':app.run_server(debug=True)
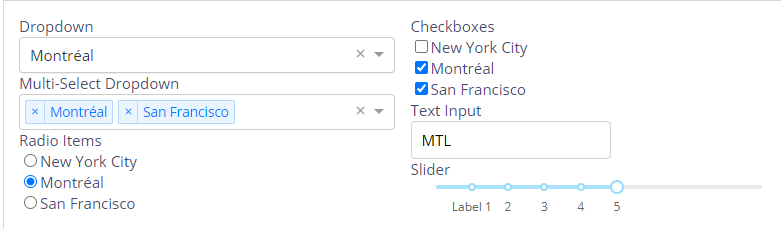
6.核心组件
dash_core_components包括一组更高级的组件,如下拉列表、图表、markdown块等。
像所有的Dash组件一样,它们都是用声明的方式描述的。每个可配置的选项都可以作为组件的关键字参数。
可以在【 Dash Core Components Gallery】网站中,查看所有的核心组件。
# -*- coding: utf-8 -*-# Run this app with `python app.py` and# visit http://127.0.0.1:8050/ in your web browser.import dashimport dash_core_components as dccimport dash_html_components as htmlexternal_stylesheets = ['https://codepen.io/chriddyp/pen/bWLwgP.css']app = dash.Dash(__name__, external_stylesheets=external_stylesheets)app.layout = html.Div([html.Label('Dropdown'),dcc.Dropdown(options=[{'label': 'New York City', 'value': 'NYC'},{'label': u'Montréal', 'value': 'MTL'},{'label': 'San Francisco', 'value': 'SF'}],value='MTL'),html.Label('Multi-Select Dropdown'),dcc.Dropdown(options=[{'label': 'New York City', 'value': 'NYC'},{'label': u'Montréal', 'value': 'MTL'},{'label': 'San Francisco', 'value': 'SF'}],value=['MTL', 'SF'],multi=True),html.Label('Radio Items'),dcc.RadioItems(options=[{'label': 'New York City', 'value': 'NYC'},{'label': u'Montréal', 'value': 'MTL'},{'label': 'San Francisco', 'value': 'SF'}],value='MTL'),html.Label('Checkboxes'),dcc.Checklist(options=[{'label': 'New York City', 'value': 'NYC'},{'label': u'Montréal', 'value': 'MTL'},{'label': 'San Francisco', 'value': 'SF'}],value=['MTL', 'SF']),html.Label('Text Input'),dcc.Input(value='MTL', type='text'),html.Label('Slider'),dcc.Slider(min=0,max=9,marks={i: 'Label {}'.format(i) if i == 1 else str(i) for i in range(1, 6)},value=5,),], style={'columnCount': 2})if __name__ == '__main__':app.run_server(debug=True)
总结
Dash应用程序的**layout**描述了应用程序的外观。**layout**是一个组件的分层树。dash_html_components库为所有HTML标记提供了类,关键字参数描述了HTML属性,如layout、ClassName和id。dash_core_components库生成高级组件,如控件和图形

若有收获,就点个赞吧
0 人点赞
