- 部件:Charts -> Timeseries -> State Chart
- 问题:将多台设备的遥测温度展示到图表(State Chart)时候,无法区分到底是哪个设备的数据!
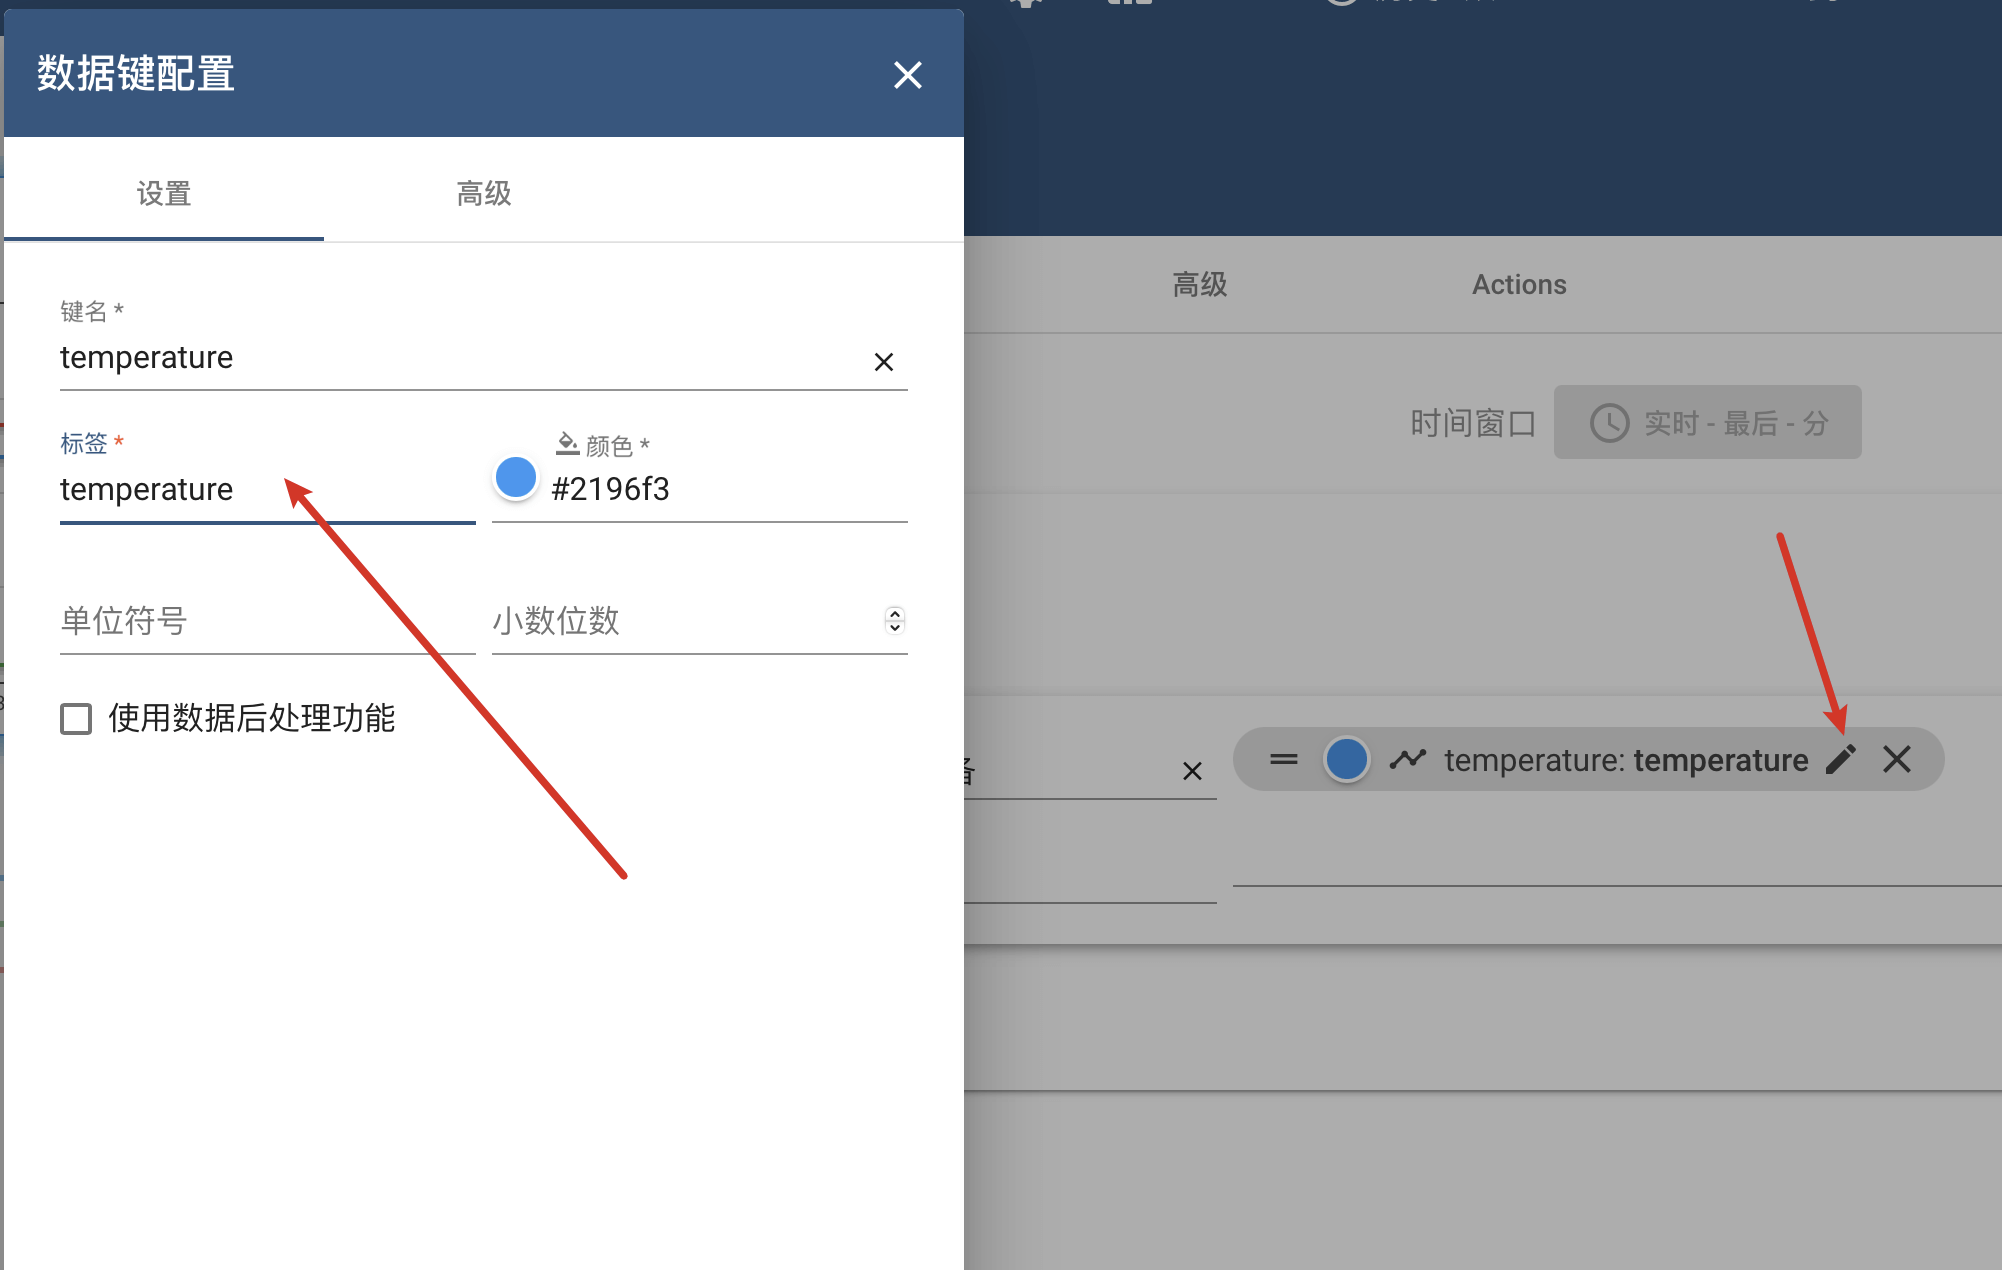
- 改造:右侧的遥测字段label前,自动加上设备名称。
- 备注:也有手动一个个设置的方式,设备多了太心累。
效果说明
原版效果
无法区分绿色蓝色线条分别是哪个设备的数据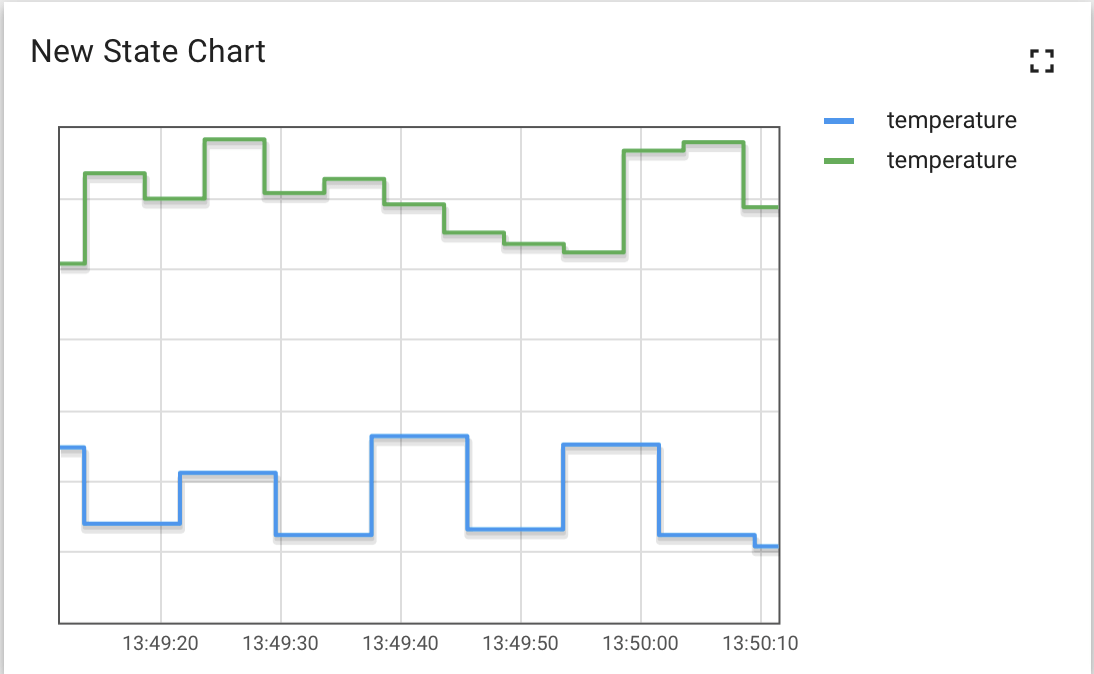
改造效果
自动在label前加设备名称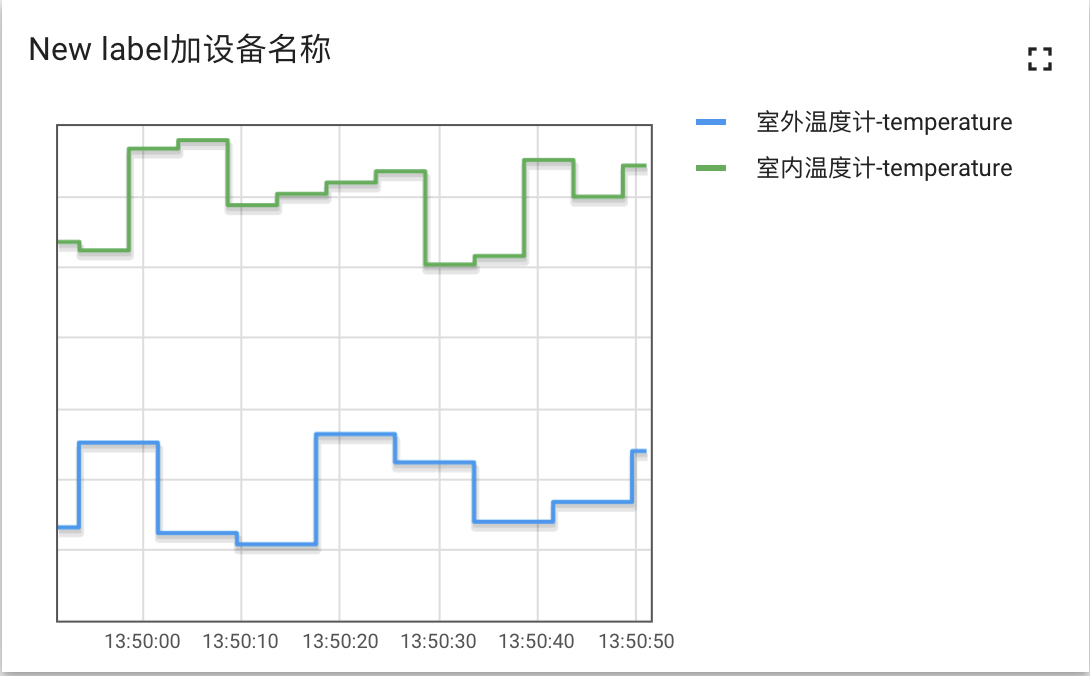
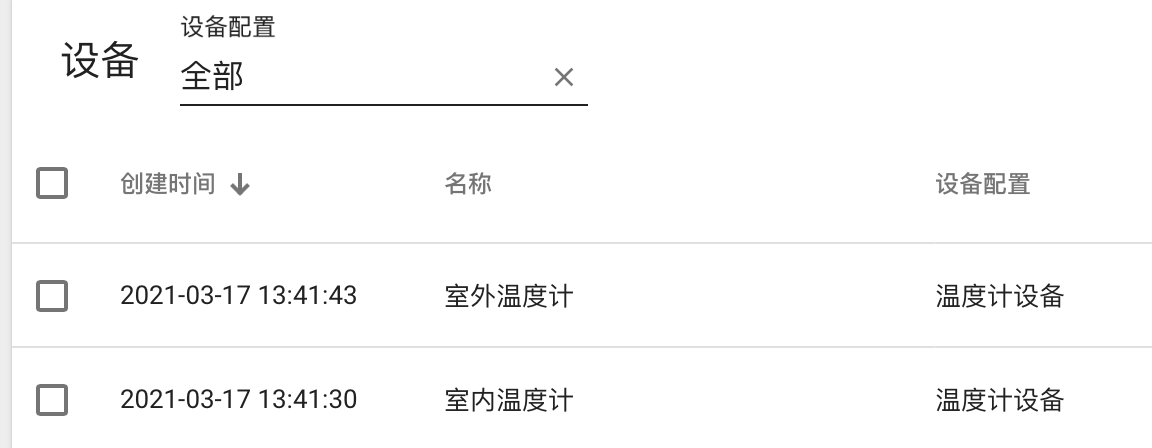
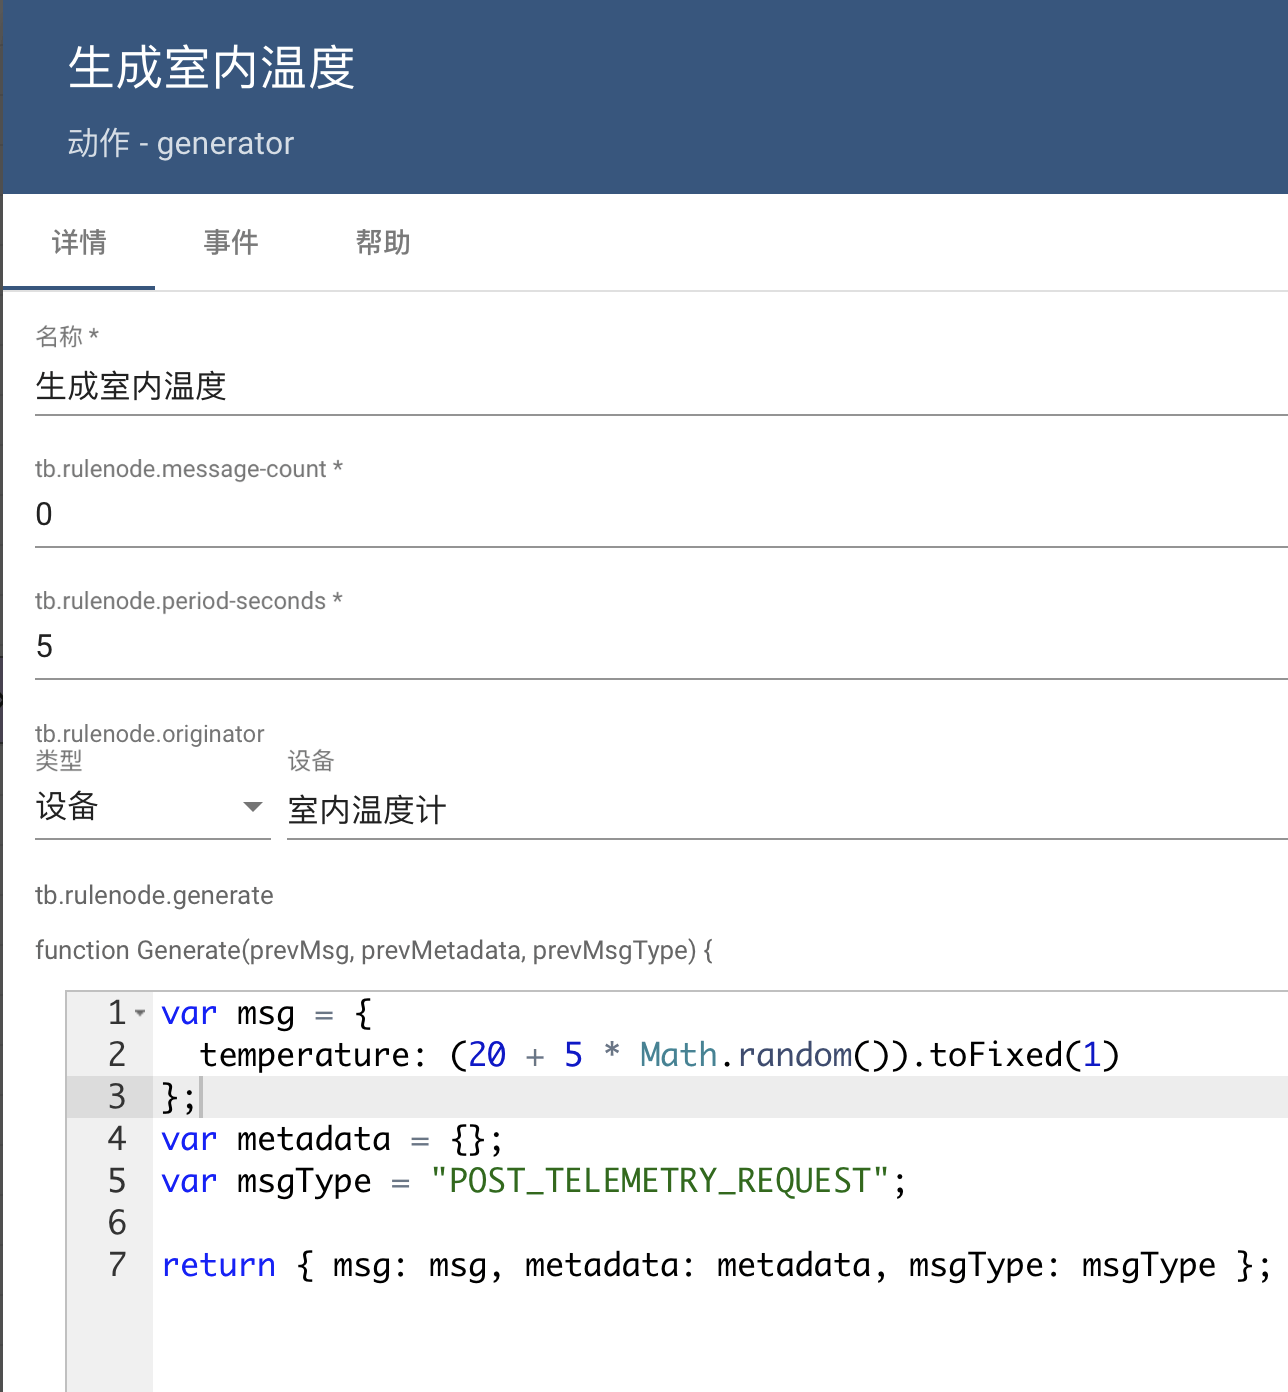
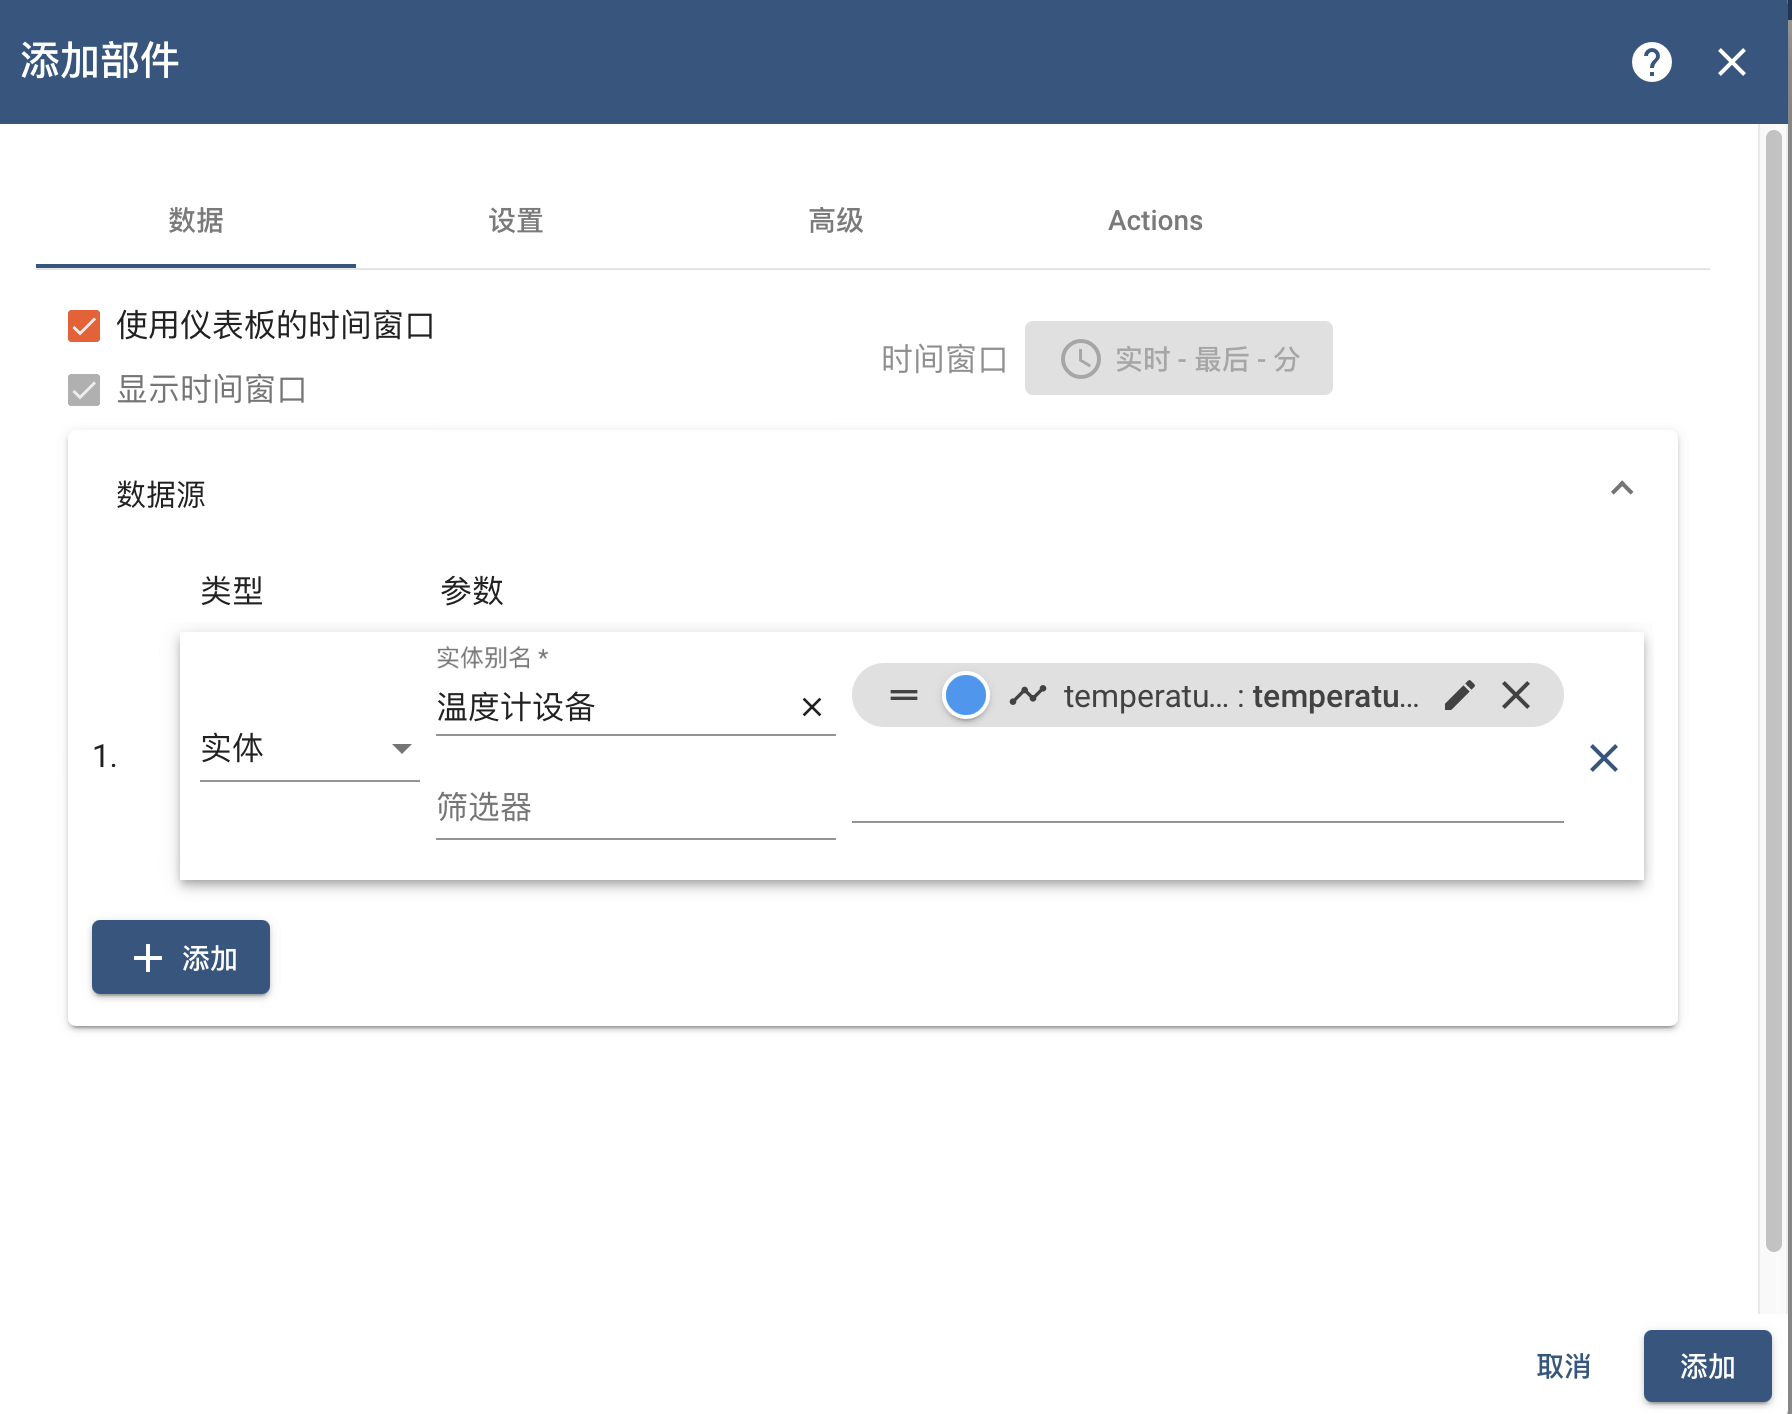
准备数据
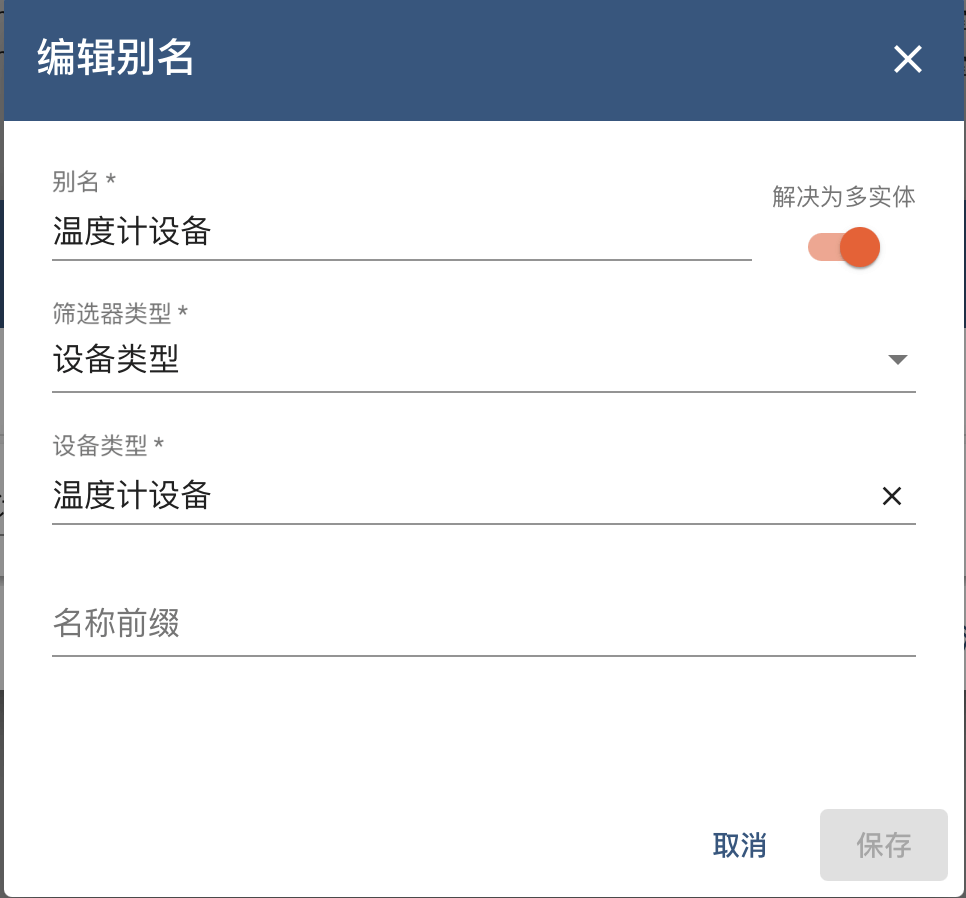
添加俩个温度计,分别为室内和室外。
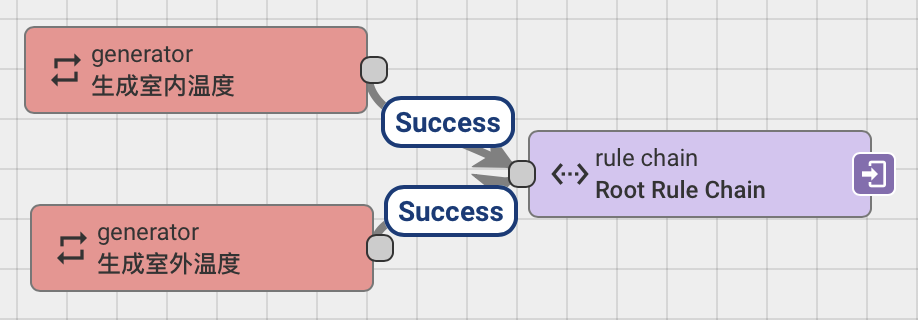
添加规则链自动生成遥测数据
添加一个部件库
Charts(label add device name)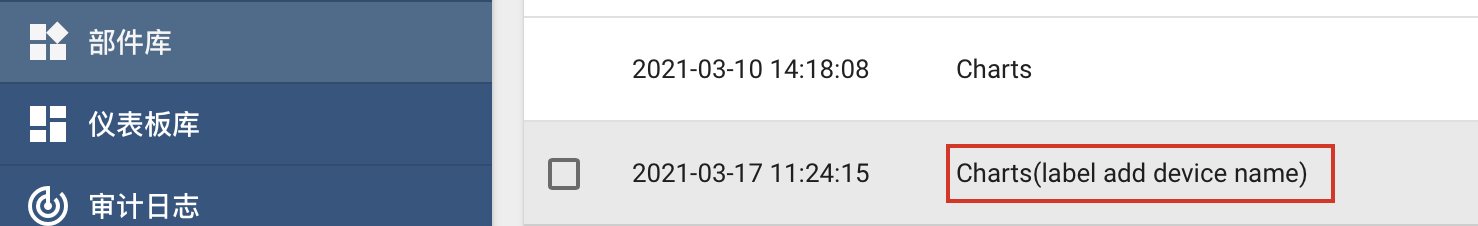
改造自带Charts
在部件库中找到Charts,点击编辑,修改后会另存到之前添加的部件库。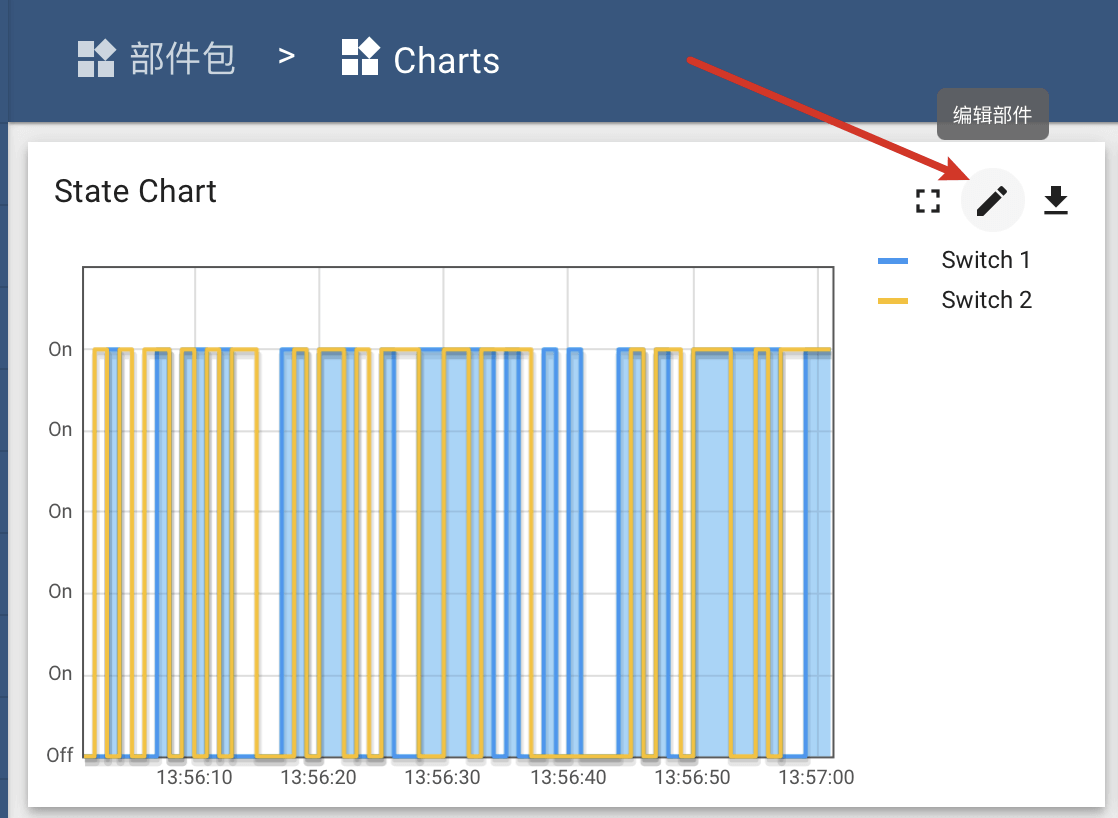
JavaScript中改为下面代码
只改变了onInit和onDataUpdated,也可以都写到onInit中
//标记是否已经加上设备名称var changed = false;self.onInit = function() {self.ctx.flot = new TbFlot(self.ctx, 'state');self.ctx.$scope.data = self.ctx.defaultSubscription.data;// console.log(JSON.stringify(self.ctx.defaultSubscription.data.datasource));//datasourceData是为了过滤self.ctx.defaultSubscription.data中的重复datasource数据//感兴趣的可以打开console.log注释对比前后差别。self.ctx.$scope.datasourceData = [];var currentDatasource = null;var currentDatasourceIndex = -1;for (var i=0;i<self.ctx.$scope.data.length;i++) {var dataKeyData = self.ctx.$scope.data[i];if (dataKeyData.datasource != currentDatasource) {currentDatasource = dataKeyData.datasourcecurrentDatasourceIndex++;self.ctx.$scope.datasourceData[currentDatasourceIndex] = dataKeyData;}}// console.log(JSON.stringify(self.ctx.$scope.datasourceData));}self.onDataUpdated = function() {if(!changed){changed = true;for (var j=0;j<self.ctx.$scope.datasourceData.length;j++) {for(var k = 0;k<self.ctx.$scope.datasourceData[j].datasource.dataKeys.length;k++){self.ctx.$scope.datasourceData[j].datasource.dataKeys[k].label= self.ctx.$scope.datasourceData[j].datasource.name + "-"+ self.ctx.$scope.datasourceData[j].datasource.dataKeys[k].label;}}//只会打印一次,不会每次数据更新都调用!也可以写到onInit中console.log("change label");}self.ctx.flot.update();}self.onResize = function() {self.ctx.flot.resize();}self.typeParameters = function() {return {stateData: true};}self.onEditModeChanged = function() {self.ctx.flot.checkMouseEvents();}self.onMobileModeChanged = function() {self.ctx.flot.checkMouseEvents();}self.getSettingsSchema = function() {return TbFlot.settingsSchema('graph');}self.getDataKeySettingsSchema = function() {return TbFlot.datakeySettingsSchema(true, 'graph');}self.onDestroy = function() {self.ctx.flot.destroy();}
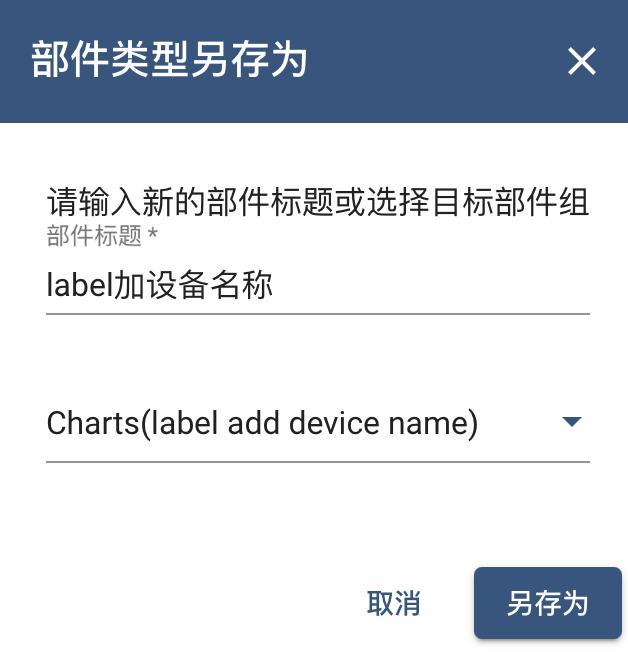
另存为部件
另存为 -> 输入部件标题 -> 选择部件库(这里选择之前创建的那个部件库)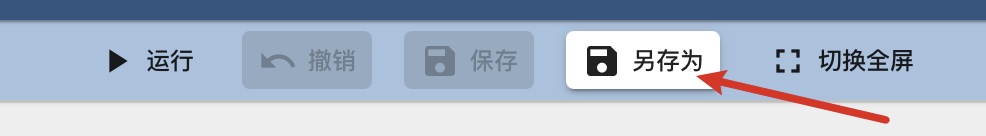
展示数据
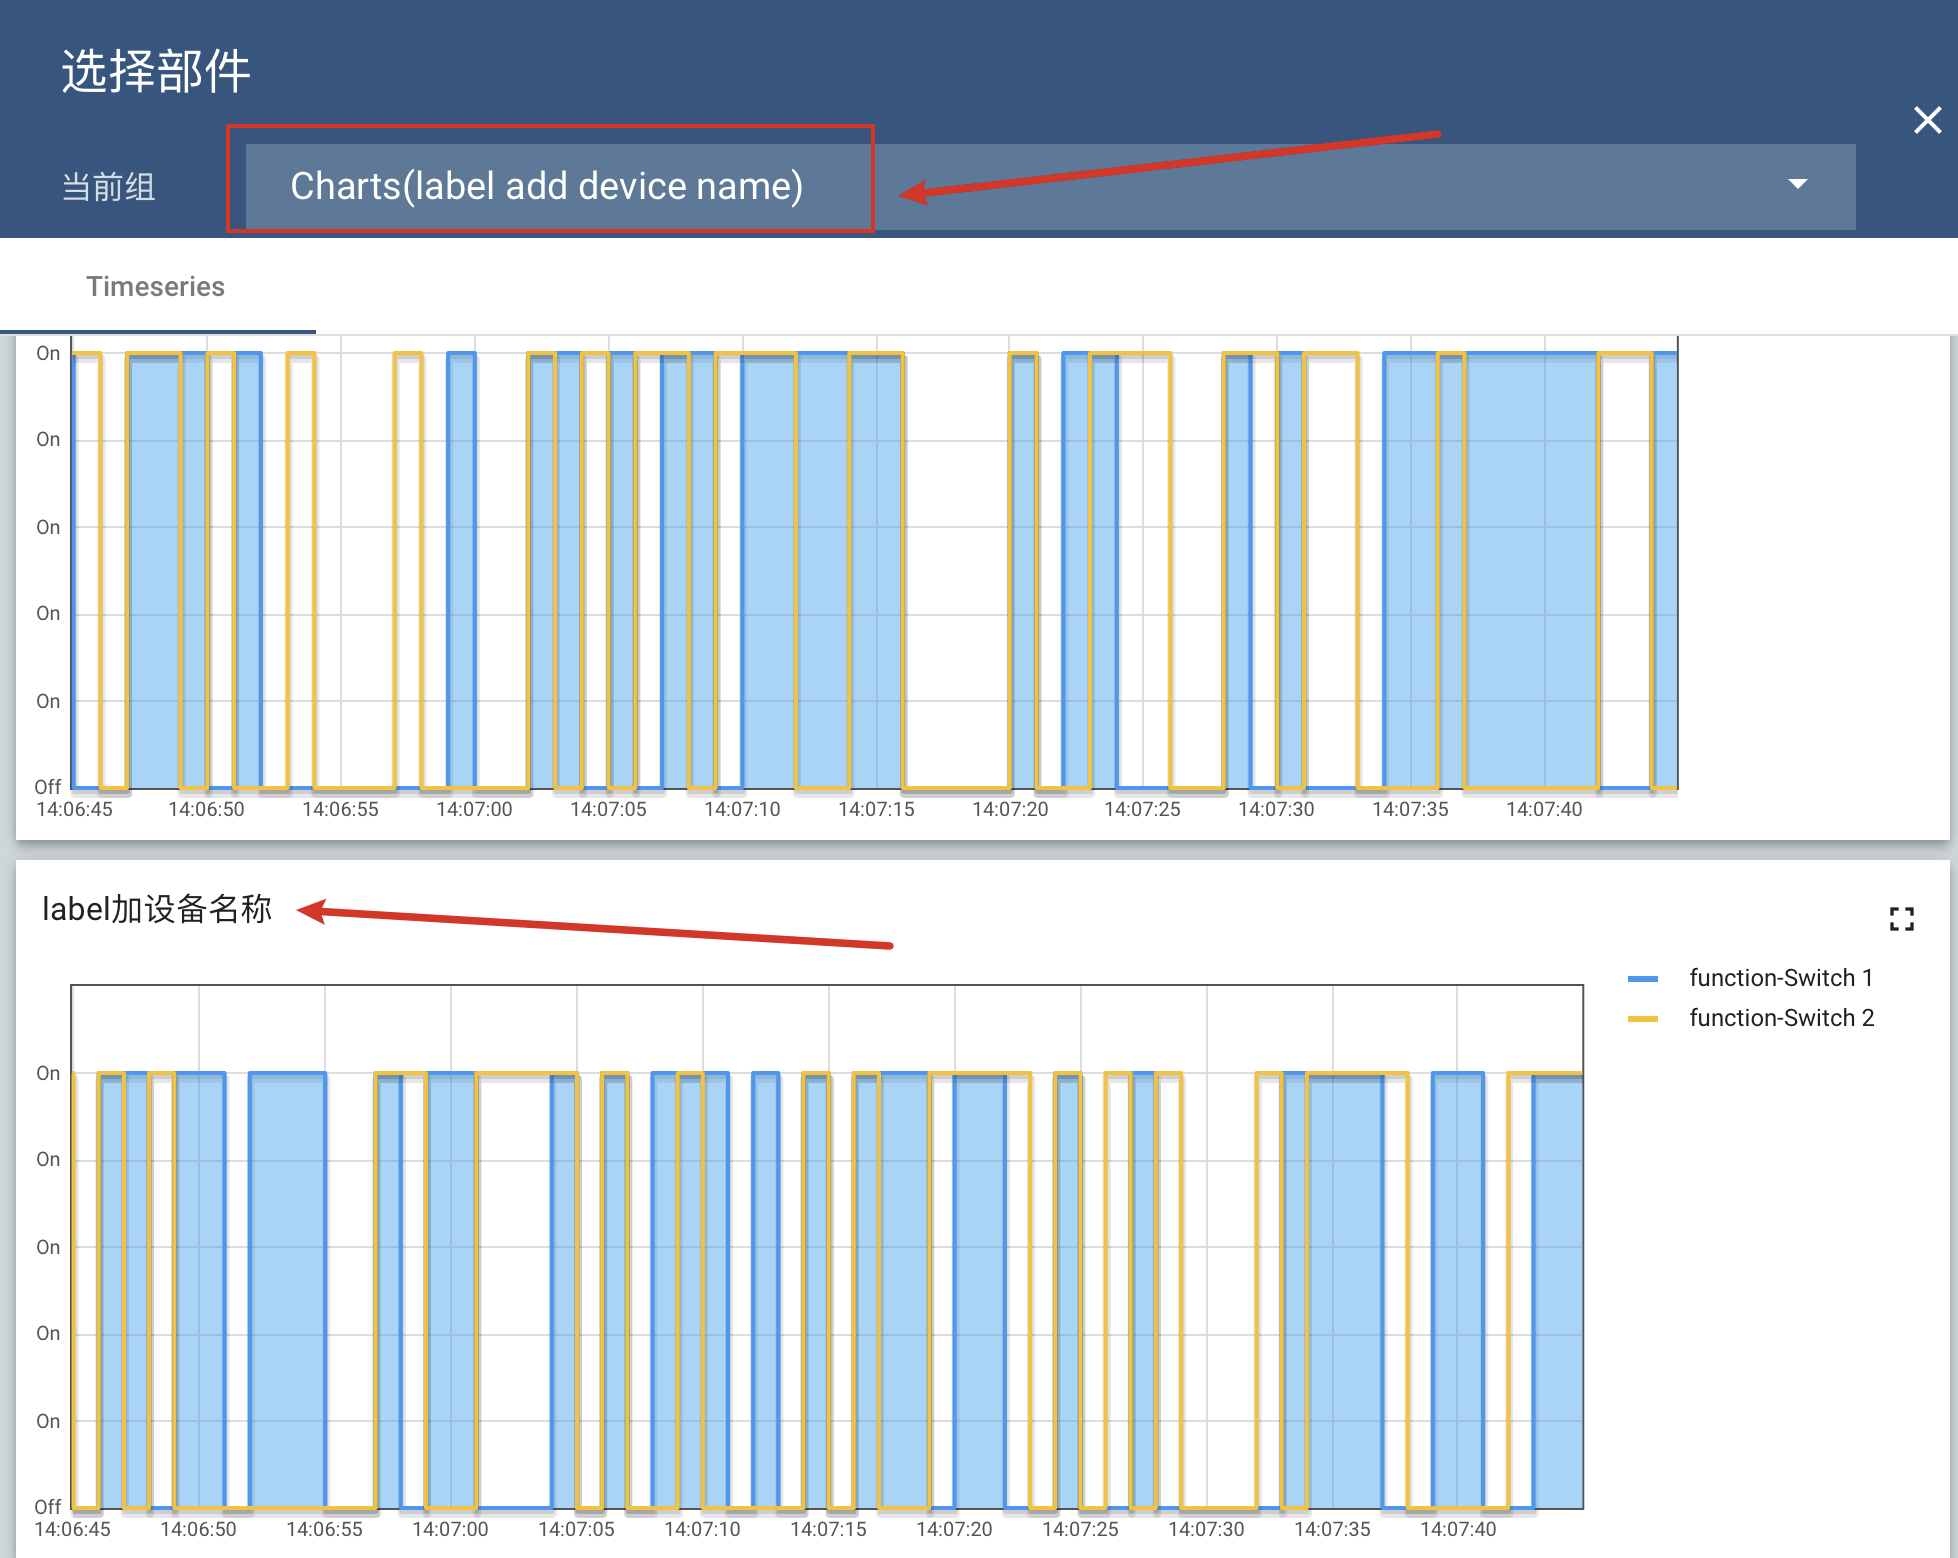
再加上自带的State Chart作比较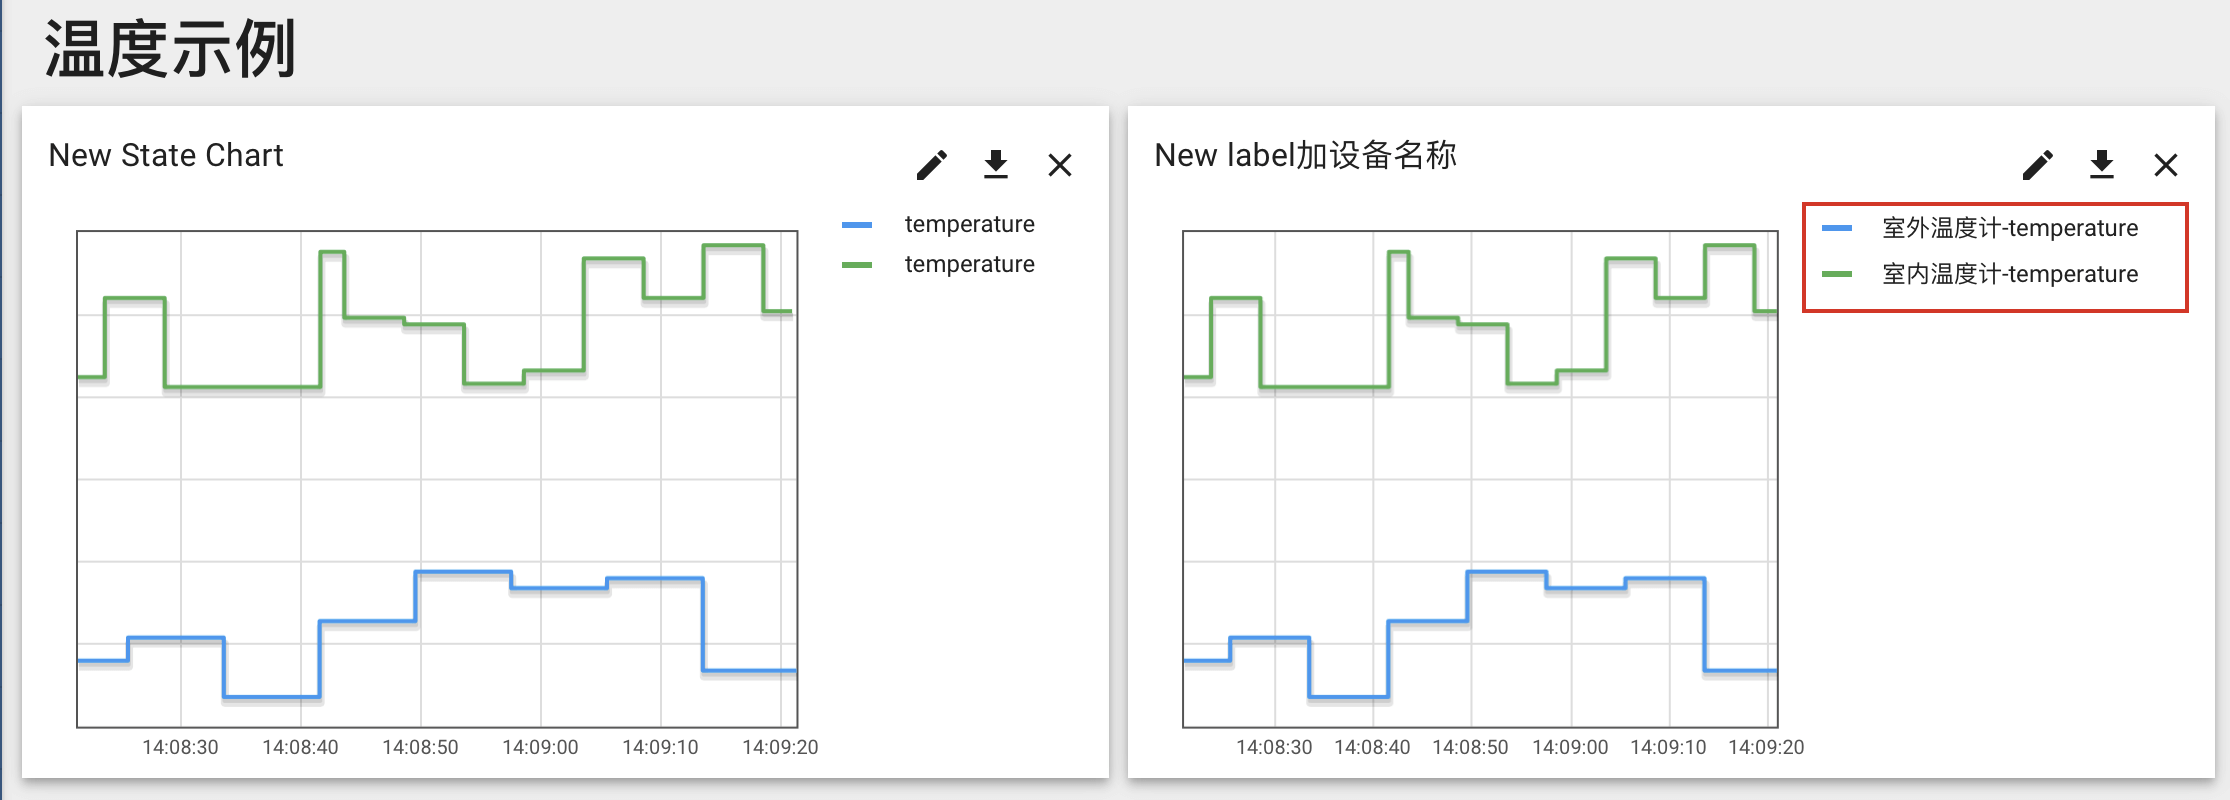
再添加一个温度计设备,会自动加入图表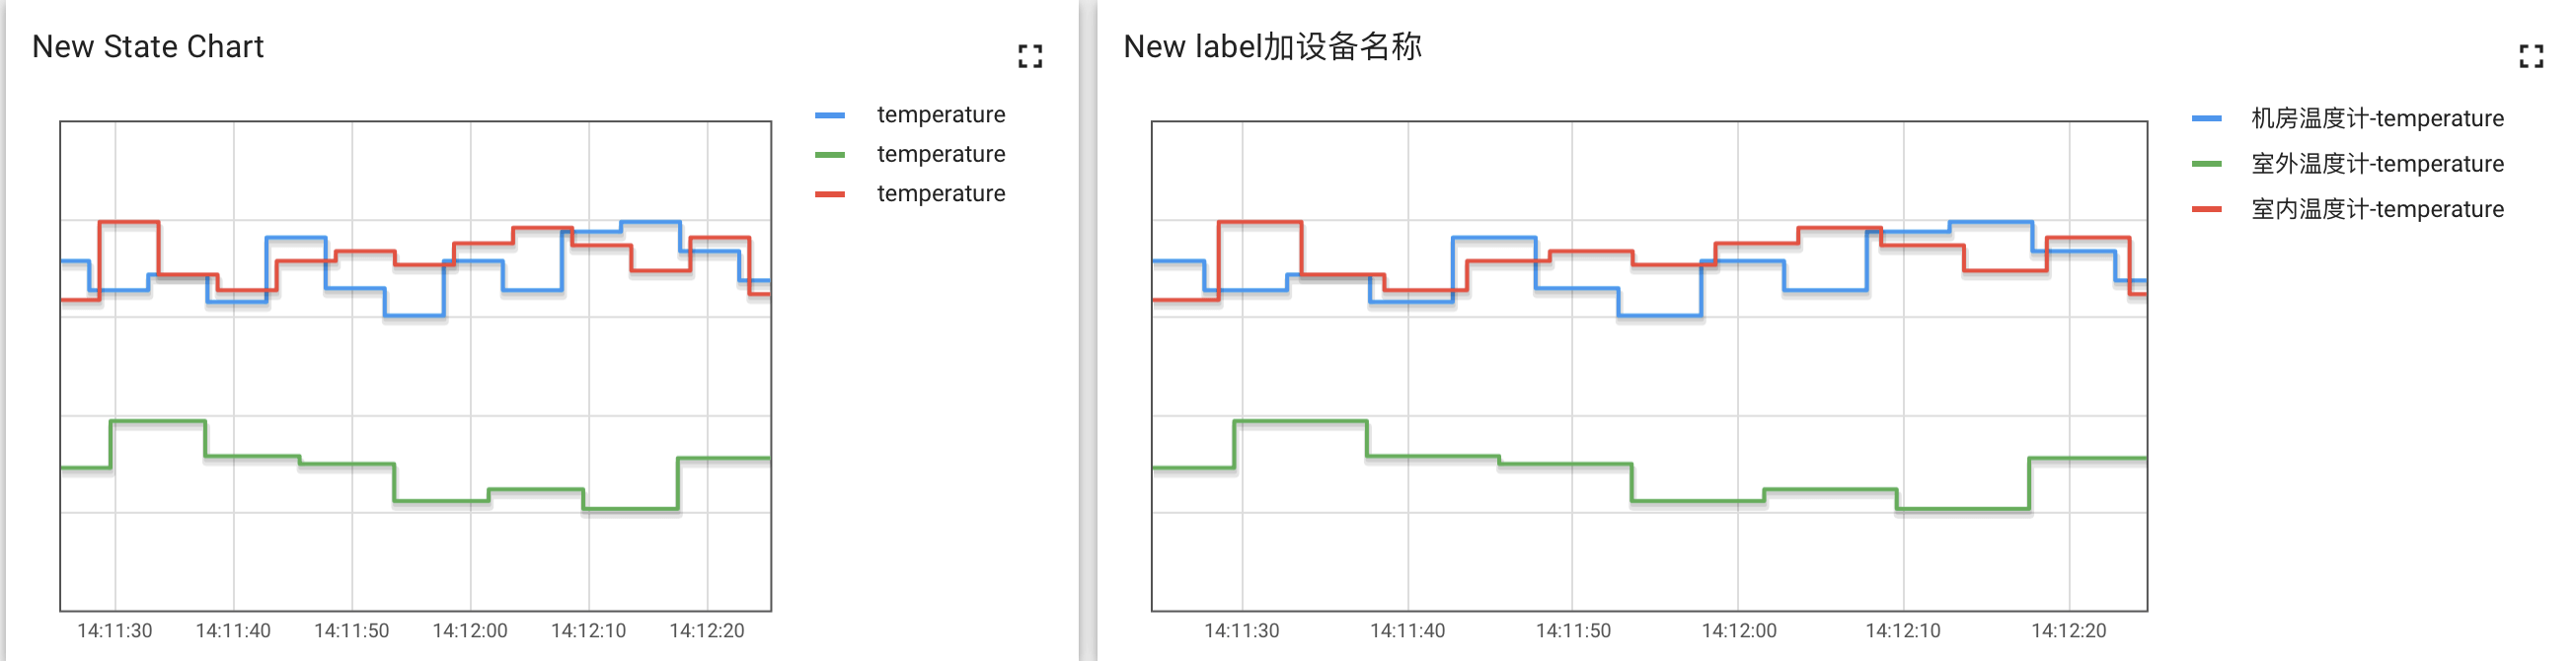
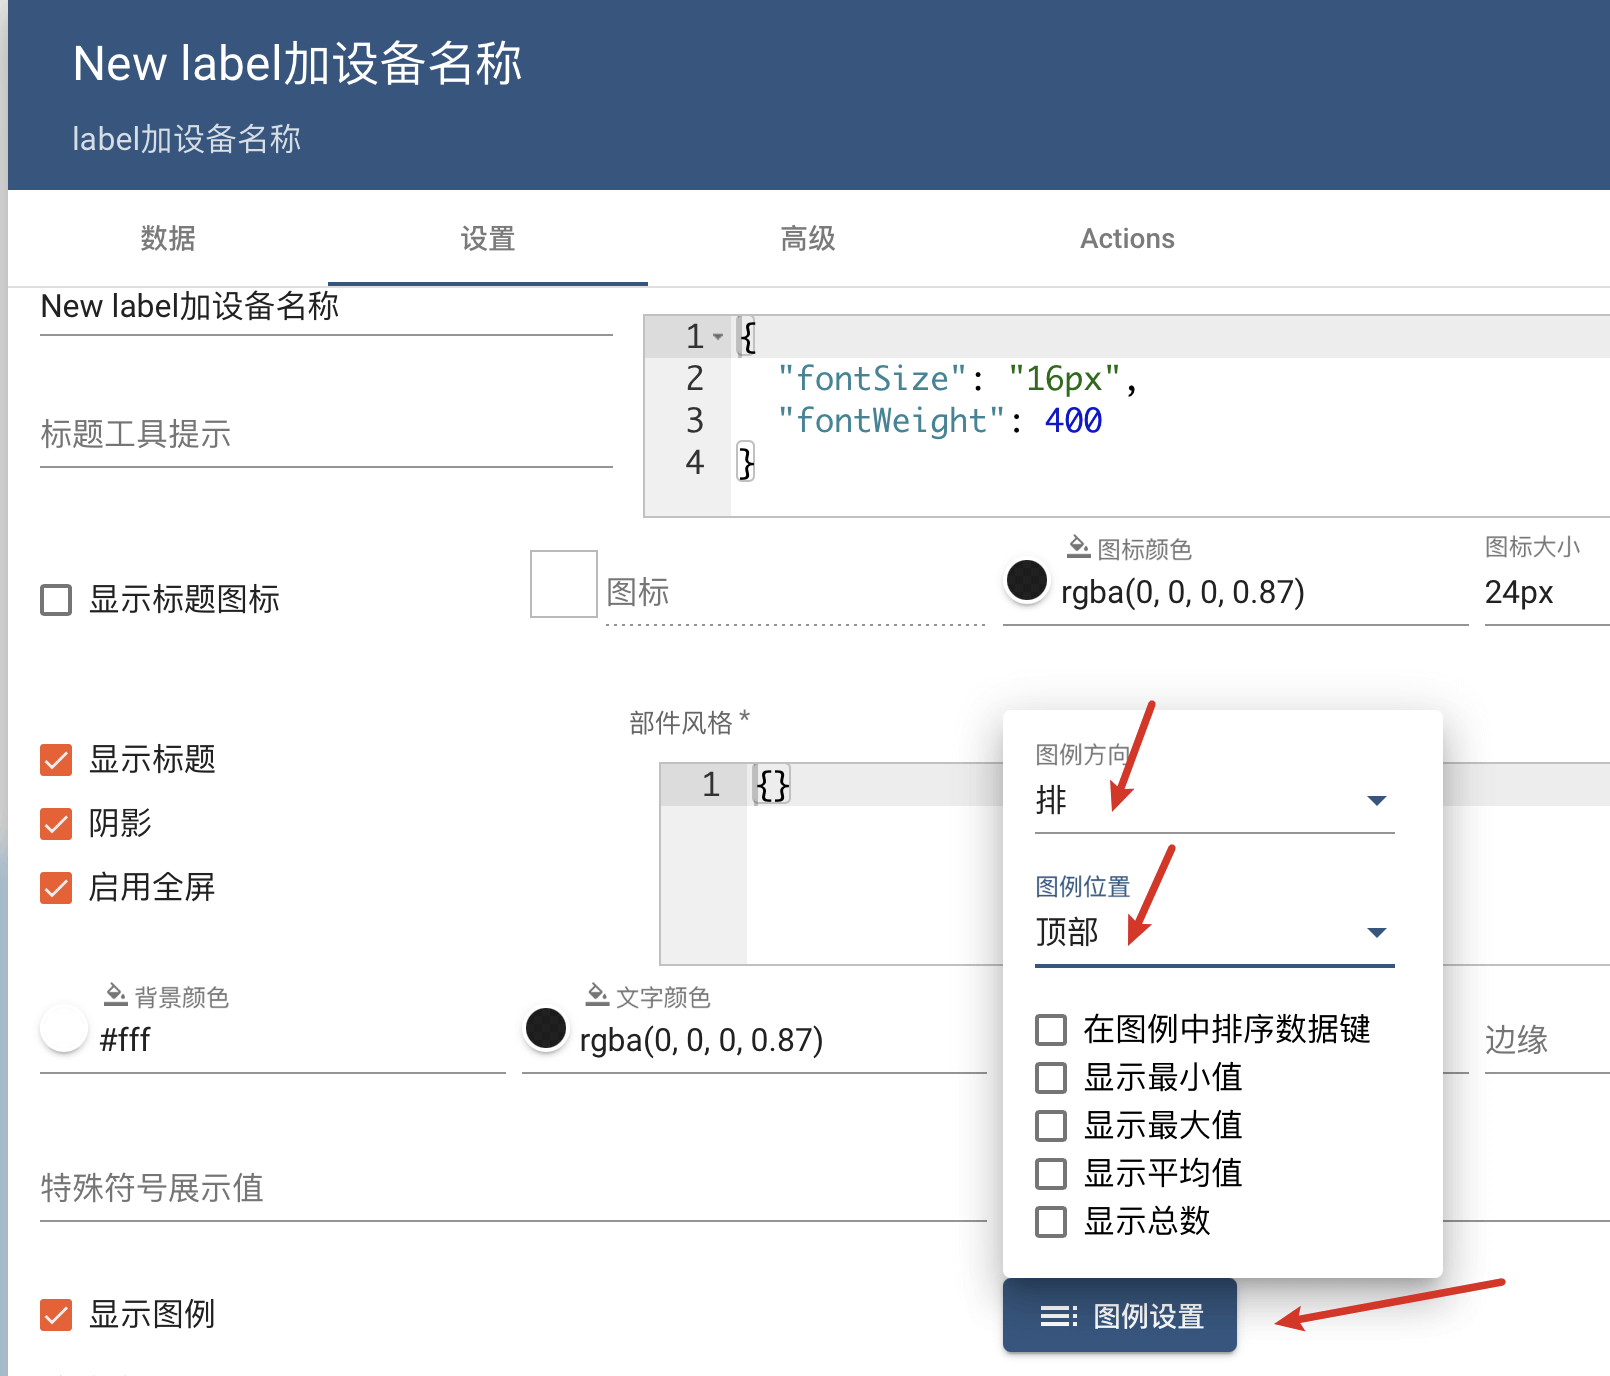
也可以改变图例位置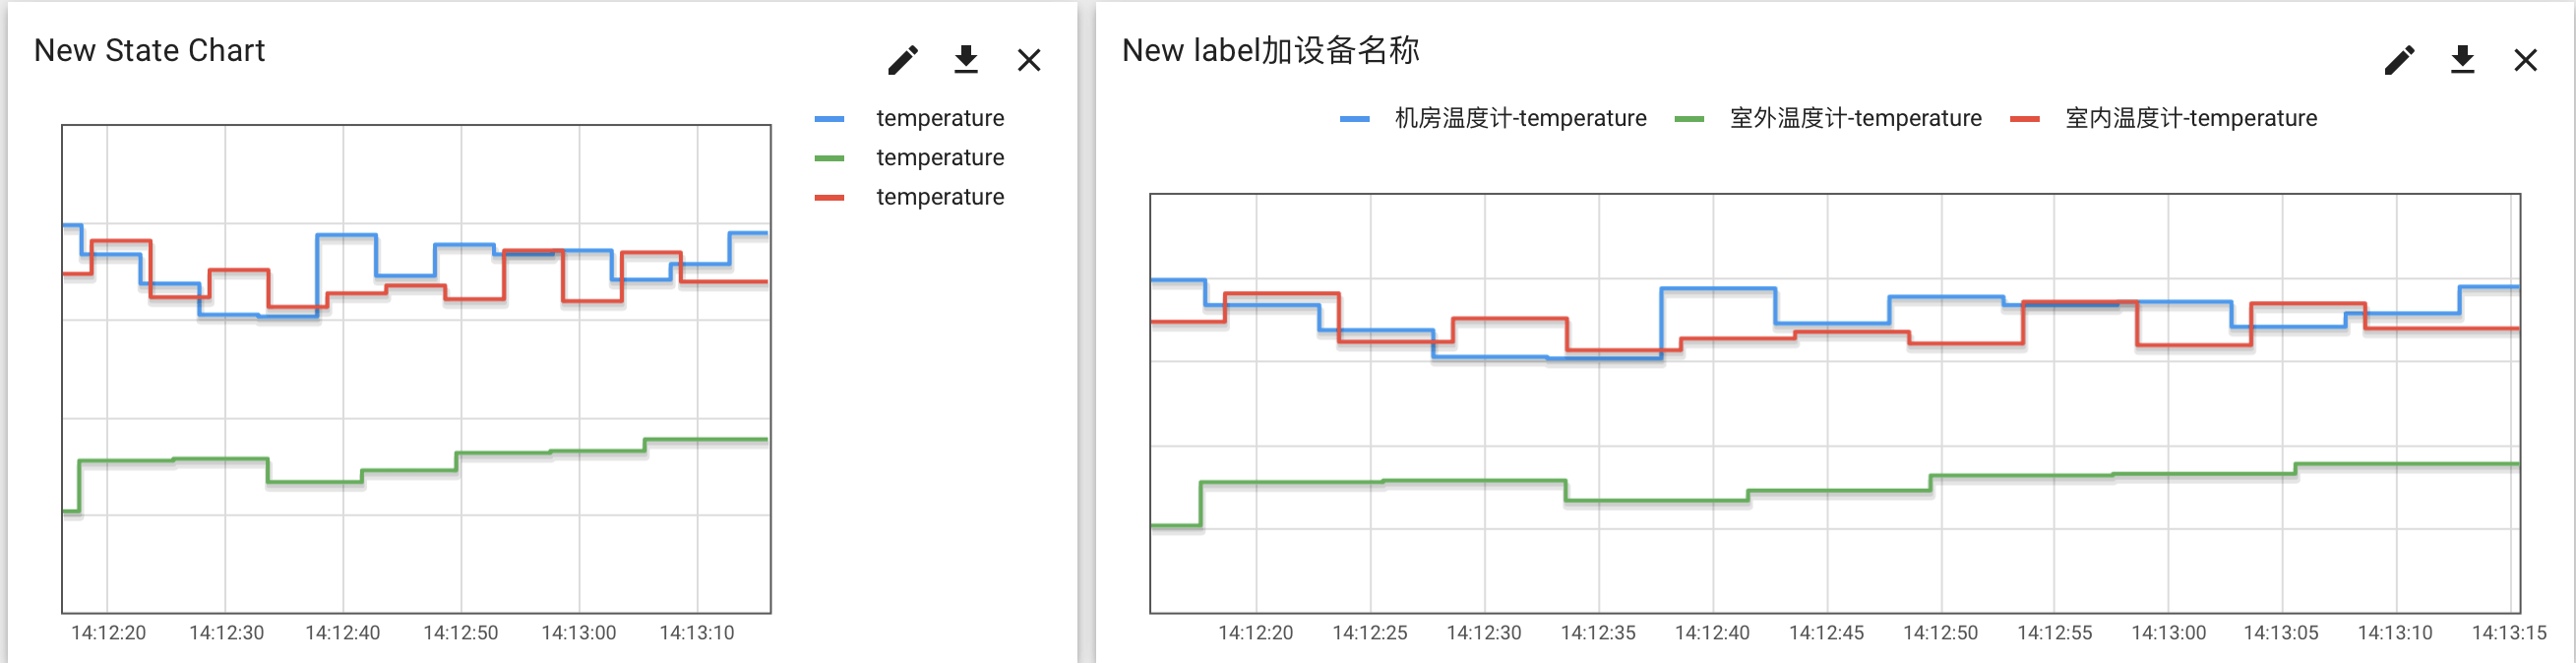
手动设置
这个也可以关注一下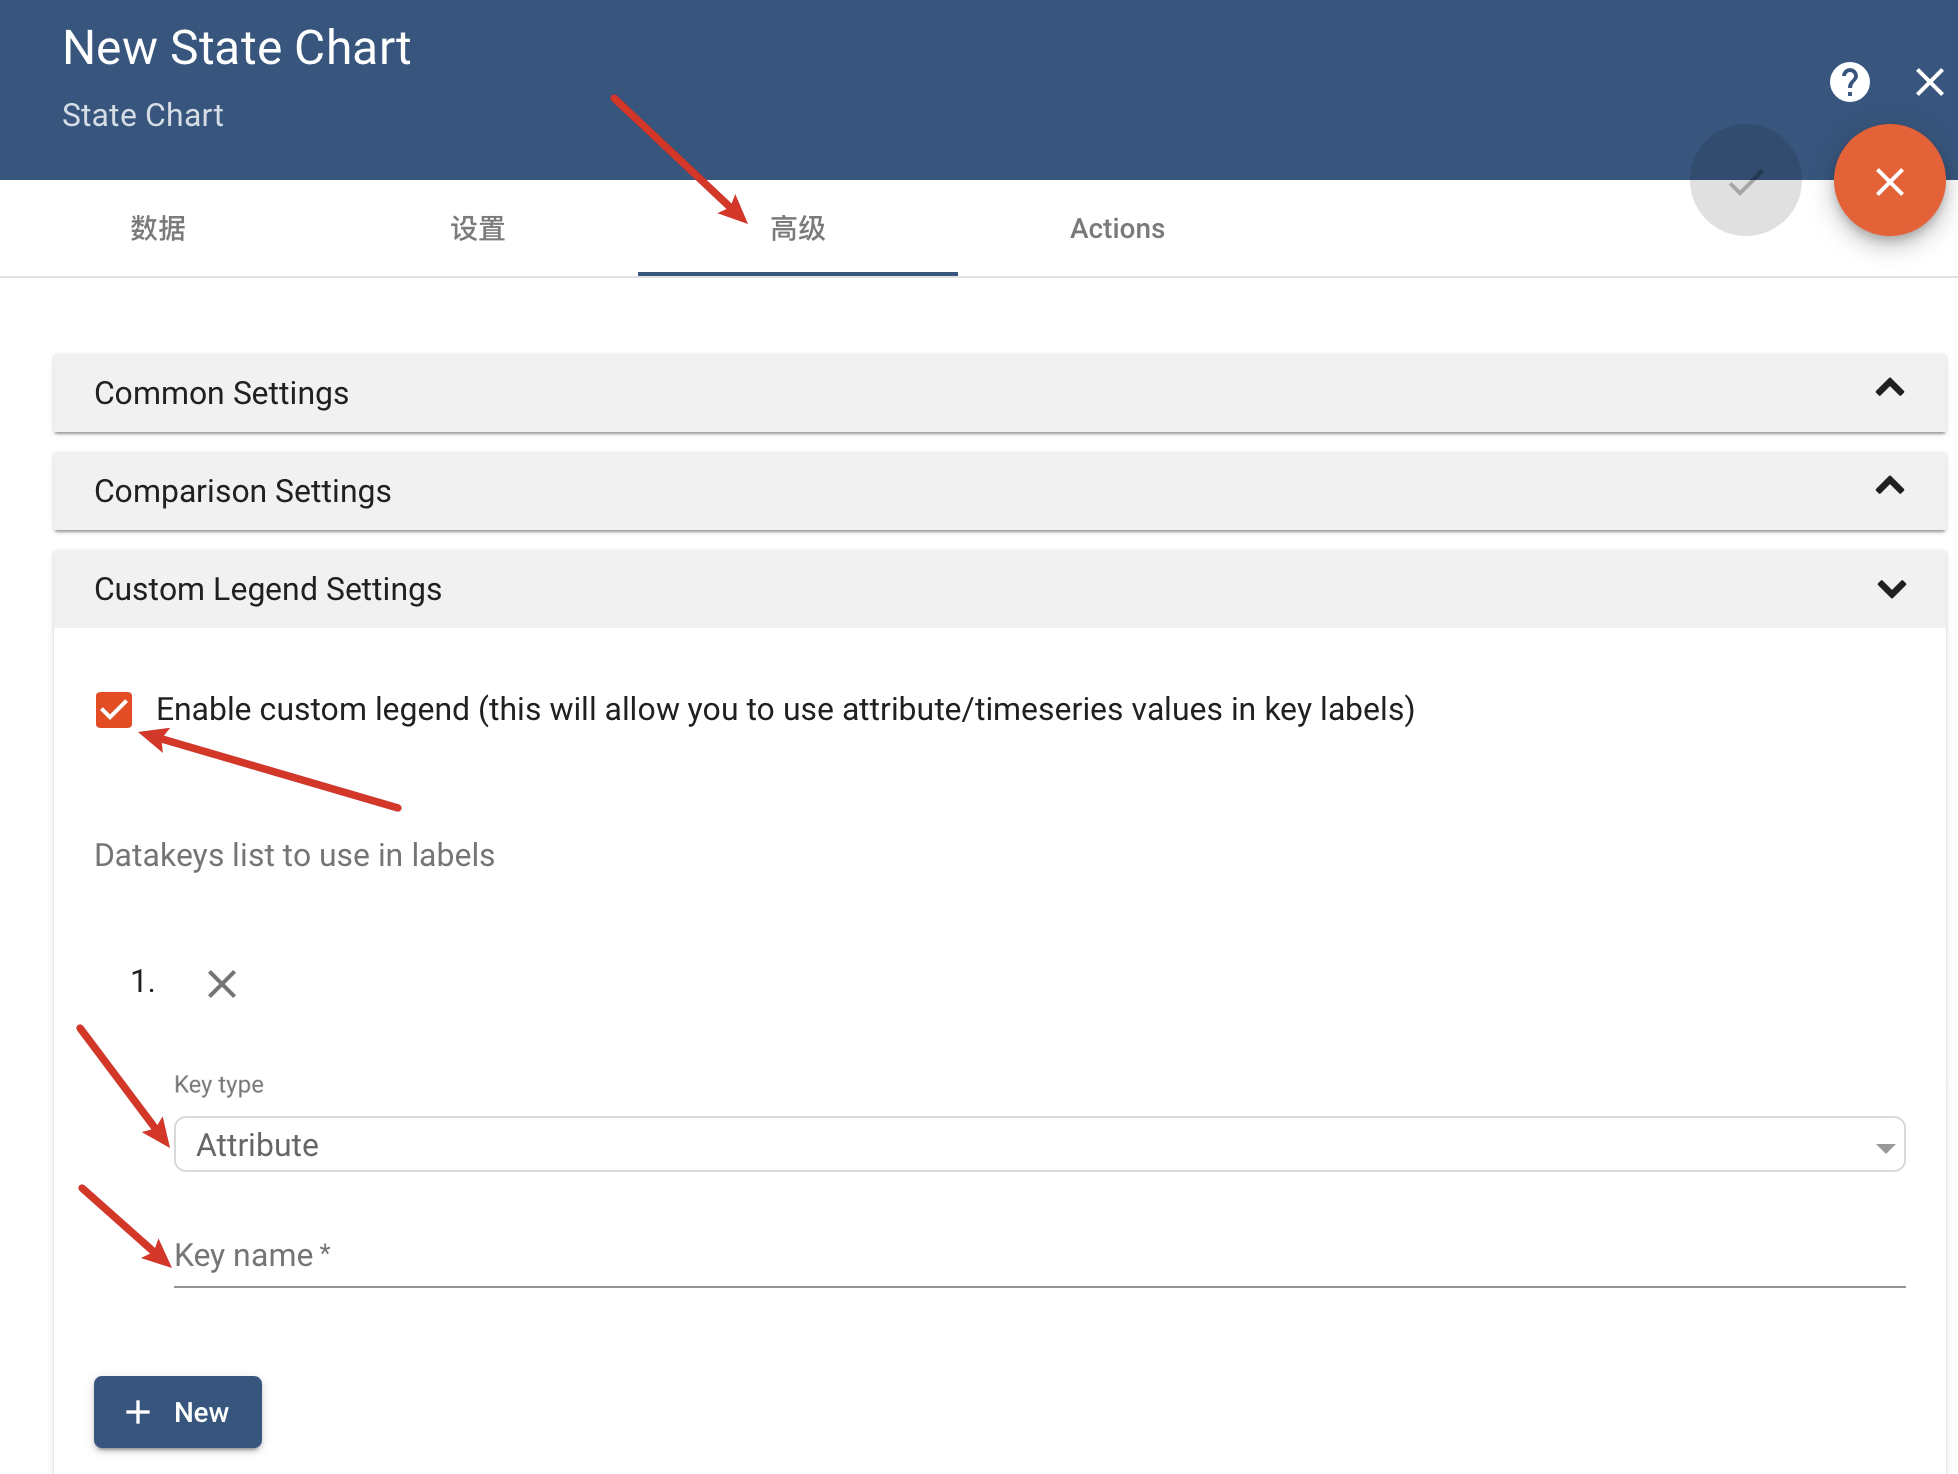


若有收获,就点个赞吧
0 人点赞
