1.简介
一个程序,完成它预设的功能,并不能说明它是一个优良的程序。好的程序,应该是对资源的合理利用,亦或是
用更少的资源(使用合理的算法),实现更多有效的产出。
影响程序的资源一般而言分为4个:CPU、内存、IO、网络。本文着重讲解一下在linux系统下,如何查看高CPU占用率的进程,线程。
2.python代码
为了模拟真实场景,我们用python程序模拟一个高CPU占用的情景,即开大量的线程,线程内部也使用无限循环(空跑),以下为python代码cpu.py:
1. #-*- coding:utf-8 -*-2. import time, threading3.4. #测试线程的个数5. num = 5006.7. def loop():8. print 'thread %s is running...' % threading.current_thread().name9. k = 010. while k < 500:11. k += 112. time.sleep(1)13.14.15. def special():16. print 'thread %s is running...' % threading.current_thread().name17. while True:18. pass19.20. #启动一些普通线程21. for i in range(num):22. t = threading.Thread(target=loop, name='normal-' + str(i))23. t.start()24.25. t = threading.Thread(target=special, name='special')26. t.start()
在linux系统中,使用 python cpu.py 运行该程序。
3.问题排查时使用的命令
如何确定高cpu消耗的进程:
方法1 用top简单看一下:
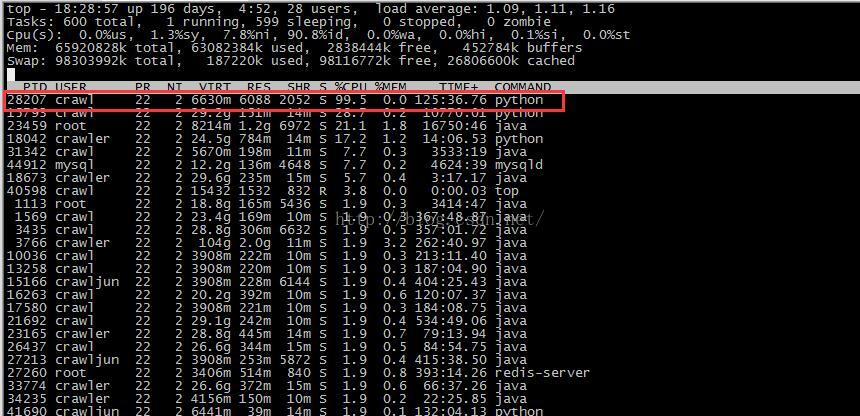
标红的部分,很明显能发现较高的cpu占用情况。
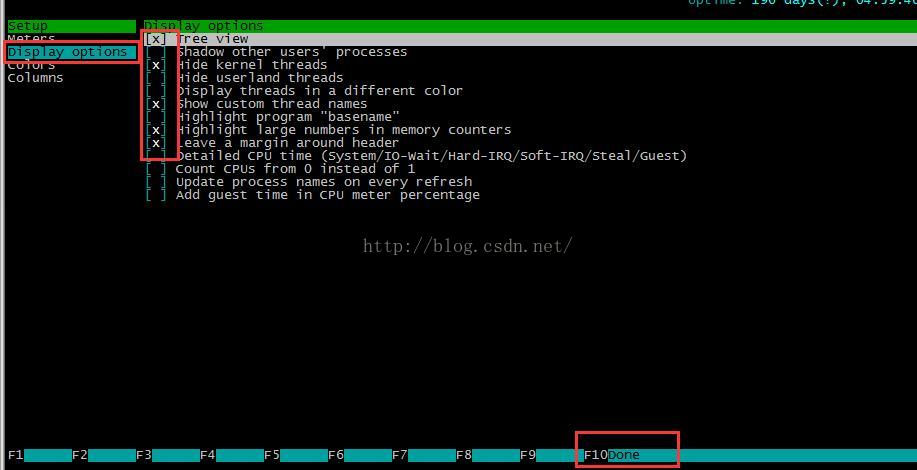
方法2 用ps -eo pid,pcpu | sort -n -k 2 (当然,可以tail一下)<br /> 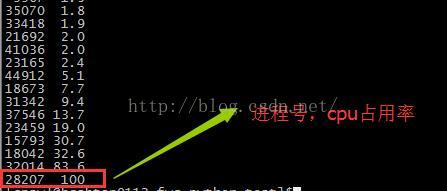如何确定高cpu消耗的线程:<br /> 方法1 用top -H<br /> 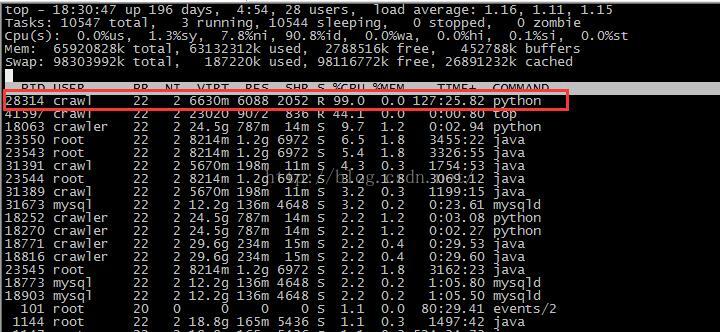<br /> 标红的部分就是高cpu消耗的线程信息。<br /> <br /> 方法2 用ps H -eo pid,tid,pcpu | sort -n -k 3<br /> 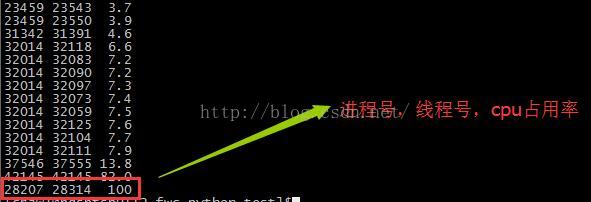假如我知道高cpu消耗的进程号是多少了,查看它的线程信息的方法为:<br /> 方法 1: pstree -p pid<br /> 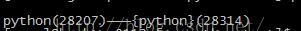<br /> <br /> 方法 2: 查看线程的详细信息:cat /proc/进程号/task/线程号/status<br /> 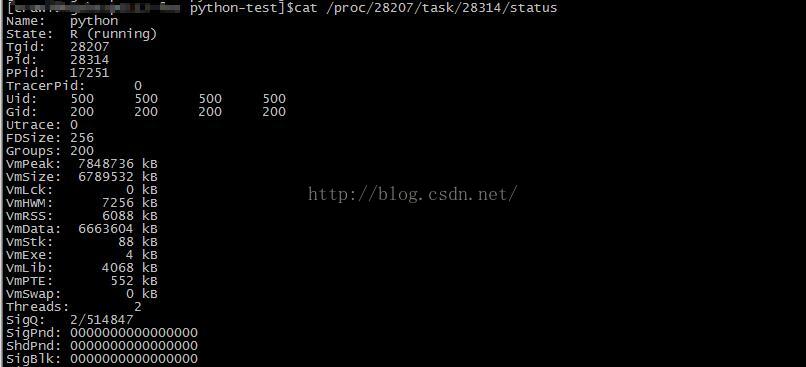<br /> <br /> 方法 3: 实时显示 top -H -p pid<br /> 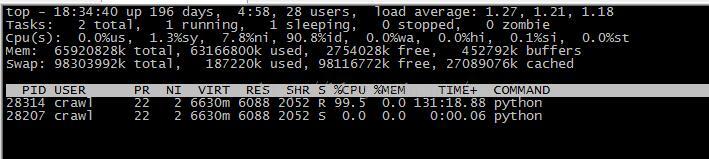<br /> <br /> 方法 4: htop,通过htop查看单个进程的线程,然后按<F2>来进入htop的设置菜单。选择“设置”栏下<br /> 面的“显示选项”,然后开启“树状视图”和“显示自定义线程名”选项。按<F10>退出设置。<br /> 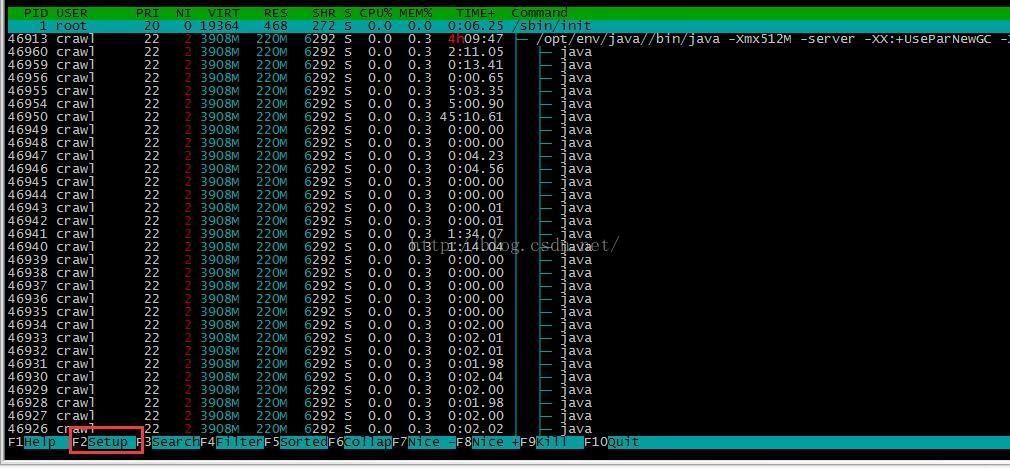
方法 5: 查看该进程下所有的线程 ps -efL | grep pid

https://blog.csdn.net/hrn1216/article/details/51426741
一行命令让CPU占用率达到100%,满负载测试
for i in seq 1 $(cat /proc/cpuinfo |grep "physical id" |wc -l); do dd if=/dev/zero of=/dev/null & done

若有收获,就点个赞吧
0 人点赞
