• Linear regression
A prediction method for regression tasks whose predicted variable is numeric.
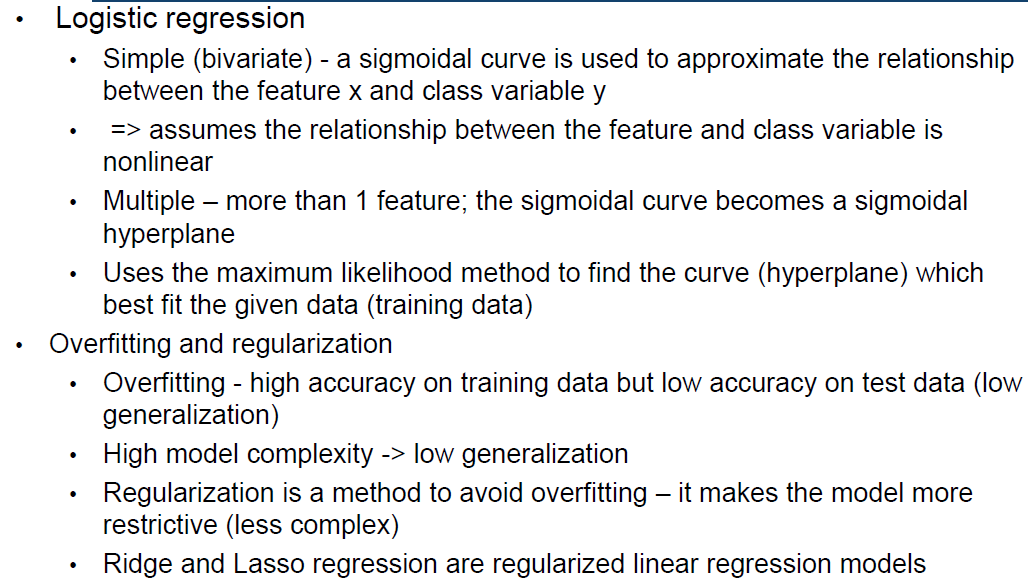
• Logistic regression
An extension of linear regression for classification tasks whose predicted variable is nominal.
• Overfitting and regularization
• Ridge and Lasso regression
Simple(bivariate) regression
x: independent variable
y: dependent variable
Goal: 1) Prediction 2) Descriptive analysis - assess the relationship between x and y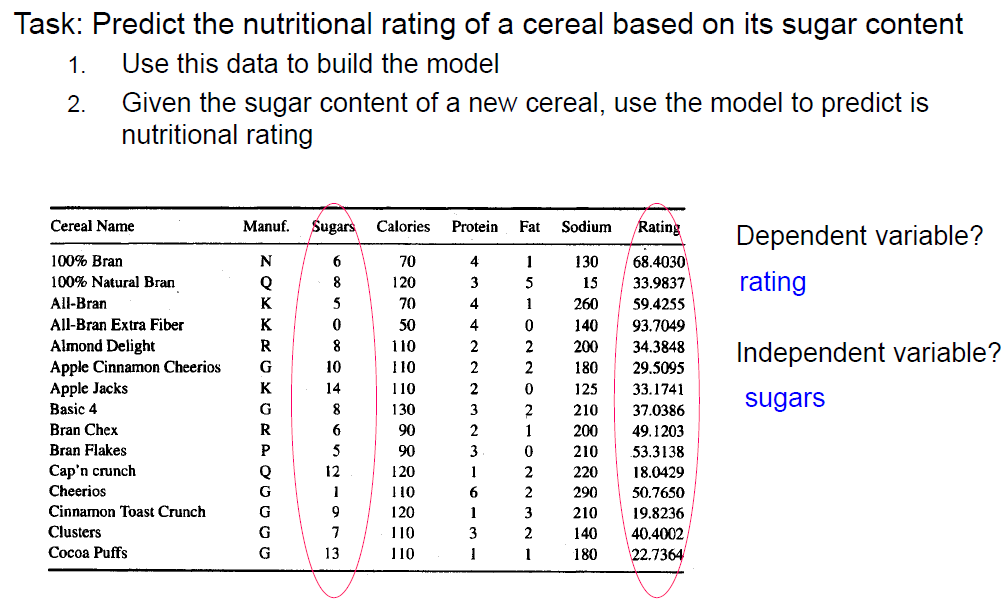

b0 is intercept(截断)
b1 is slope(斜率)
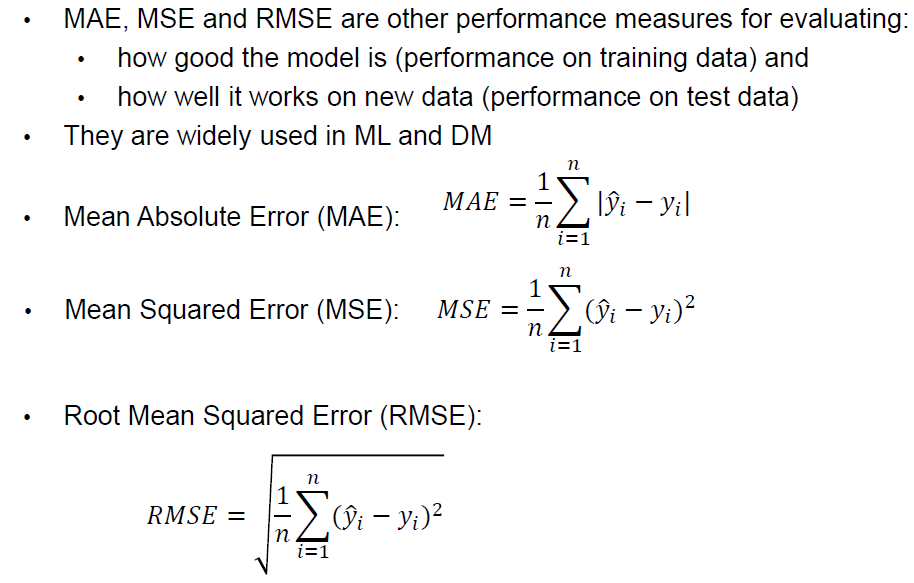
The difference between actual value and predicted value is prediction error or residual .
SSE is the sum of squared prediction errors 
the least squares method (最小二乘法)

This solution is obtained by minimizing SSE using differential calculus
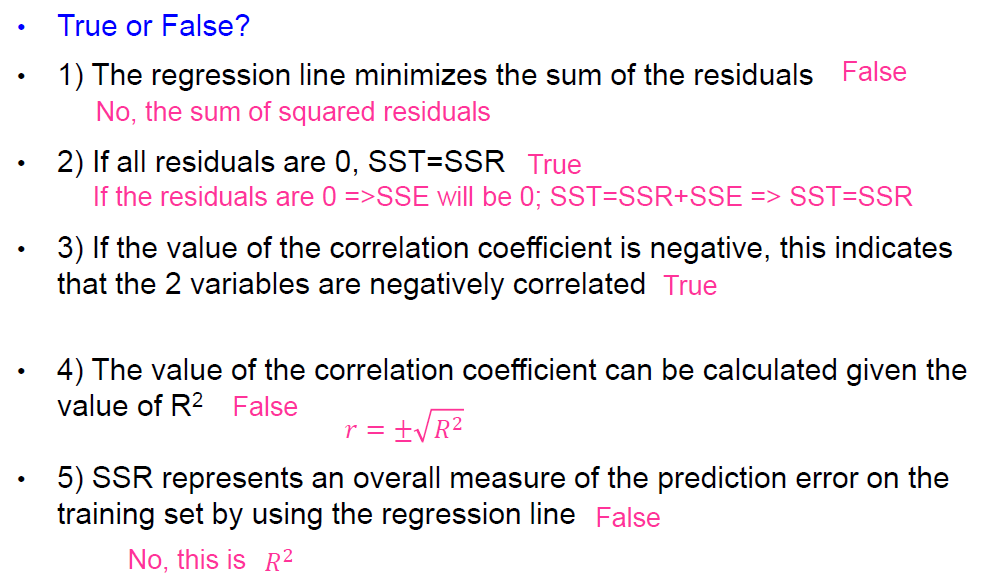
R2 measures the goodness of fit of the regression line found by theleast squares method: SST: SSR:

• Hence, SST measures the prediction error when the predicted value is the mean value
• SST is a function of the variance of y (variance = standard deviation^2) => SST is a measure of the variability of y, without considering x and can be used as a baseline -predicting y without knowing x
Values between 0 and 1; the higher the better
• = 1: the regression line fits perfectly the training data
• close to 0: poor fit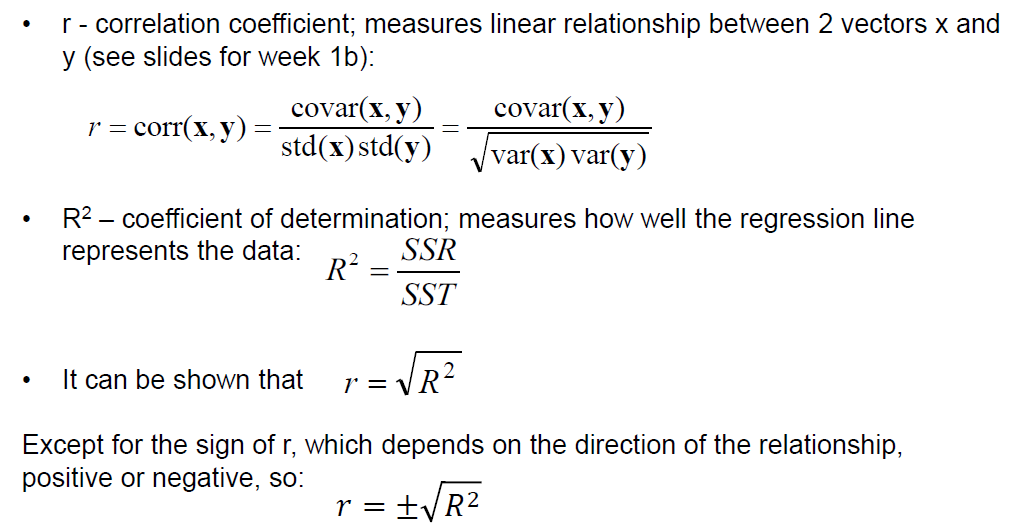
- If there is an outstanding value far higher or lower than others, how does the linear regression perform?
If a value is super good, the value may cause the regression line entirely moving up, and lead to a bad fitting effect. Otherwise, the regression line will entirely move down, and lead to a bad fitting effect.
Multiple regression %22%20aria-hidden%3D%22true%22%3E%0A%20%3Cuse%20xlink%3Ahref%3D%22%23E1-MJMATHI-52%22%20x%3D%220%22%20y%3D%220%22%3E%3C%2Fuse%3E%0A%20%3Cuse%20transform%3D%22scale(0.707)%22%20xlink%3Ahref%3D%22%23E1-MJMAIN-32%22%20x%3D%221074%22%20y%3D%22583%22%3E%3C%2Fuse%3E%0A%3C%2Fg%3E%0A%3C%2Fsvg%3E#card=math&code=R%5E2&id=IBCiy): multiple coefficient of determination
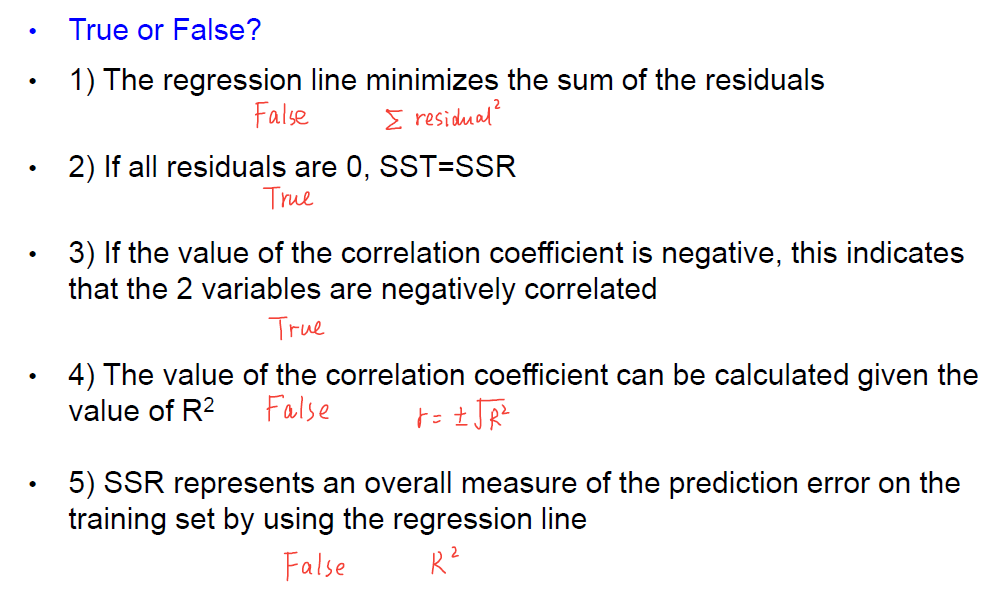
Logistic Regression 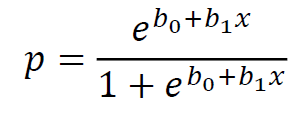
• It gives a value between 0 and 1 that is interpreted as the probability for class membership:
• p is the probability for class 1 and 1-p is the probability for class 0
• It uses the maximum likelihood method (极大似然估计) to find the parameters b0 and b1 - the curve that best fits the data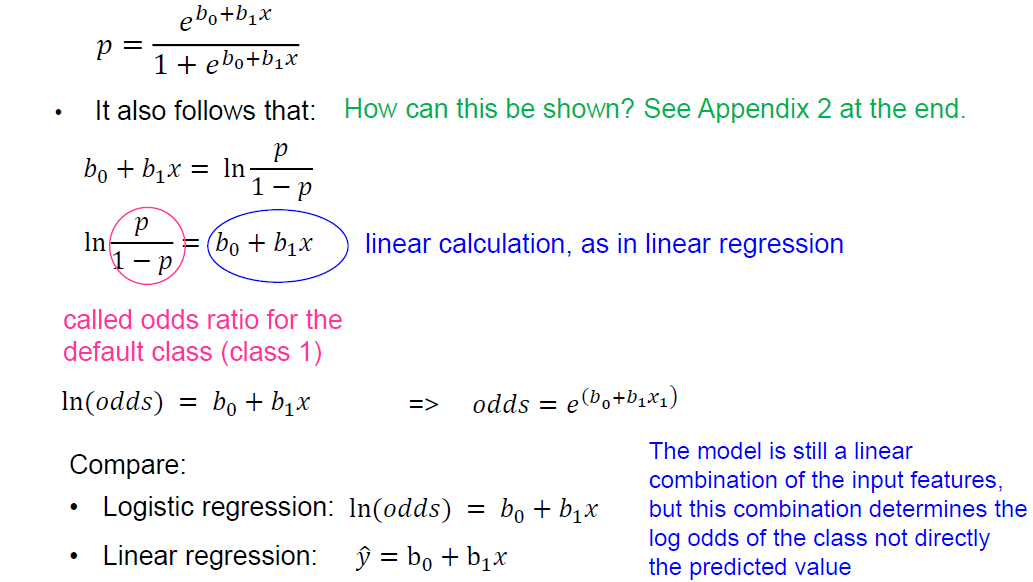
Overfitting and Regularization
• Overfitting:
• Small error on the training set but high error on test set (new examples)
• The classifier has memorized the training examples but has not learned to generalize to new examples!
• It occurs when
• we fit a model too closely to the particularities of the training set – the resulting model is too specific, works well on the training data but doesn’t work well on new data
• Various reasons, e.g.
• Issues with the data
• Noise in the training data
• Too small training set – does not contain enough representative examples
• How the algorithm operates
• Some algorithms are more susceptible to overfitting than others
• Different algorithms have different strategies to deal with overfitting, e.g.
• Decision tree – prune the tree
• Neural networks – early stopping of the training
• …
• Underfitting:
• The model is too simple and doesn’t capture all important aspectsof the data
• It performs badly on both training and test data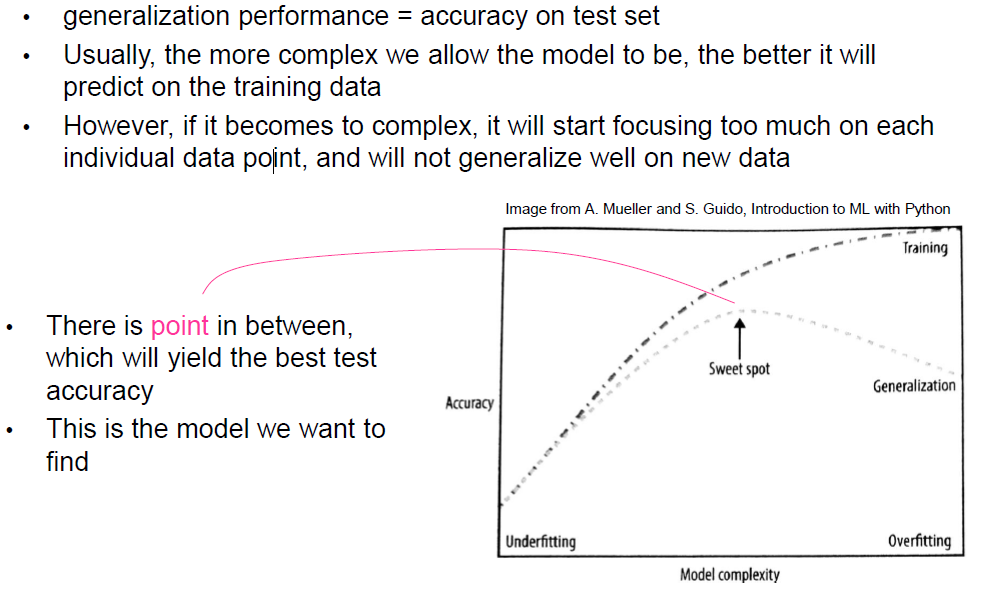
Regularization
• Regularization means explicitly restricting a model to avoid overfitting
• It is used in some regression models (e.g. Ridge and Lasso regression) and in some neural
networks
Ridge Regression
• A regularized version of the standard Linear Regression (LR)
• Also called Tikhonov regularization
• Uses the same equation as LR to make predictions
• However, the regression coefficients w are chosen so that they not only fit well the training data (as in LR) but also satisfy an additional constraint:
• the magnitude of the coefficients is as small as possible, i.e. close to 0
• Small values of the coefficients means
• each feature will have little effect on the outcome
• small slope of the regression line
• Rationale: a more restricted model (less complex) is less likely to overfit
• Ridge regression uses the so called L2 regularization (L2 norm of the weight vector)
MSE regularization term
Goal: high accuracy on training data (low MSE)
• Parameter α controls the trade-off between the performance on training set and model complexity
low complexity model – w close to 0
• Parameter α controls the trade-off between the performance ontraining set and model complexity
• Increasing α makes the coefficientssmaller (close to 0); this typically decreases the performance on the raining set but may improve the performance on the test set
• Decreasing α means less restricted coefficients. For very small α , Ridge Regression will behave similarly to LR
Lasso regression
• Consequence of using L1 – some w will become exactly 0
• => some features will be completely ignored by the model – a form of automatic feature selection
• Less features – simpler model, easier to interpret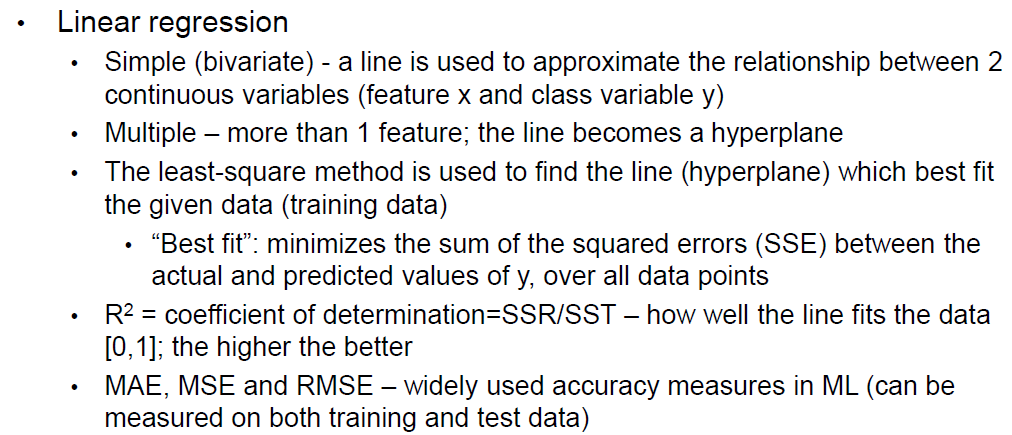

若有收获,就点个赞吧
0 人点赞
