配置webhook加速CD过程
Argo CD每三分钟轮询一次Git存储库,以检测清单的变化。为了消除轮询带来的延迟,可以将API服务器配置为接收Webhook事件。Argo CD支持来自GitHub,GitLab,Bitbucket,Bitbucket Server和Gogs的Git Webhook通知,更多点击官网。
这里使用Gitlab作为仓库地址。
(1)在argocd中配置webhook token
使用kubectl edit secret argocd-secret -n argocd命令进行配置:
apiVersion: v1kind: Secretmetadata:name: argocd-secretnamespace: argocdtype: Opaquedata:...stringData:# gitlab webhook secretwebhook.gitlab.secret: coolops
配置完点击保存会自动生成一个secret,如下:
# kubectl describe secret argocd-secret -n argocdName: argocd-secretNamespace: argocdLabels: app.kubernetes.io/name=argocd-secretapp.kubernetes.io/part-of=argocdAnnotations:Type: OpaqueData====admin.passwordMtime: 20 bytesserver.secretkey: 44 bytestls.crt: 1237 bytestls.key: 1679 byteswebhook.gitlab.secret: 7 bytesadmin.password: 60 bytes
(2)在gitlab的代码仓库配置webhook,如下: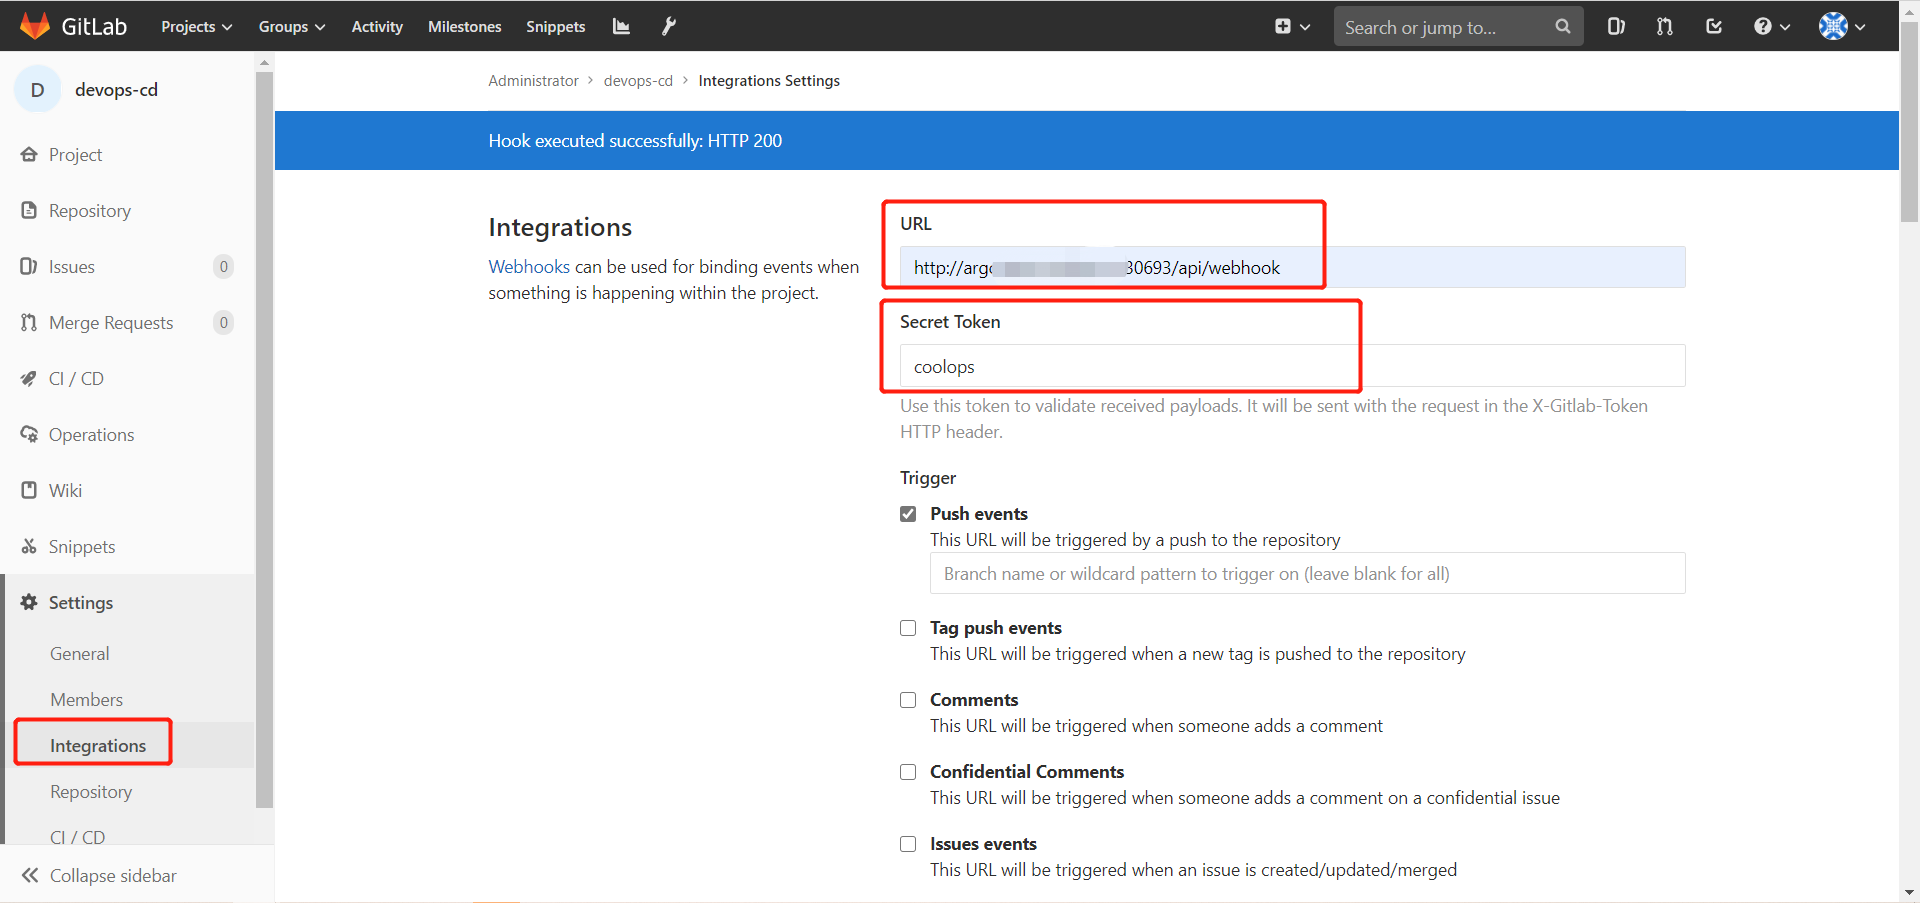
由于集群内部证书是无效证书,所有要把Enabled SSL去掉,如下: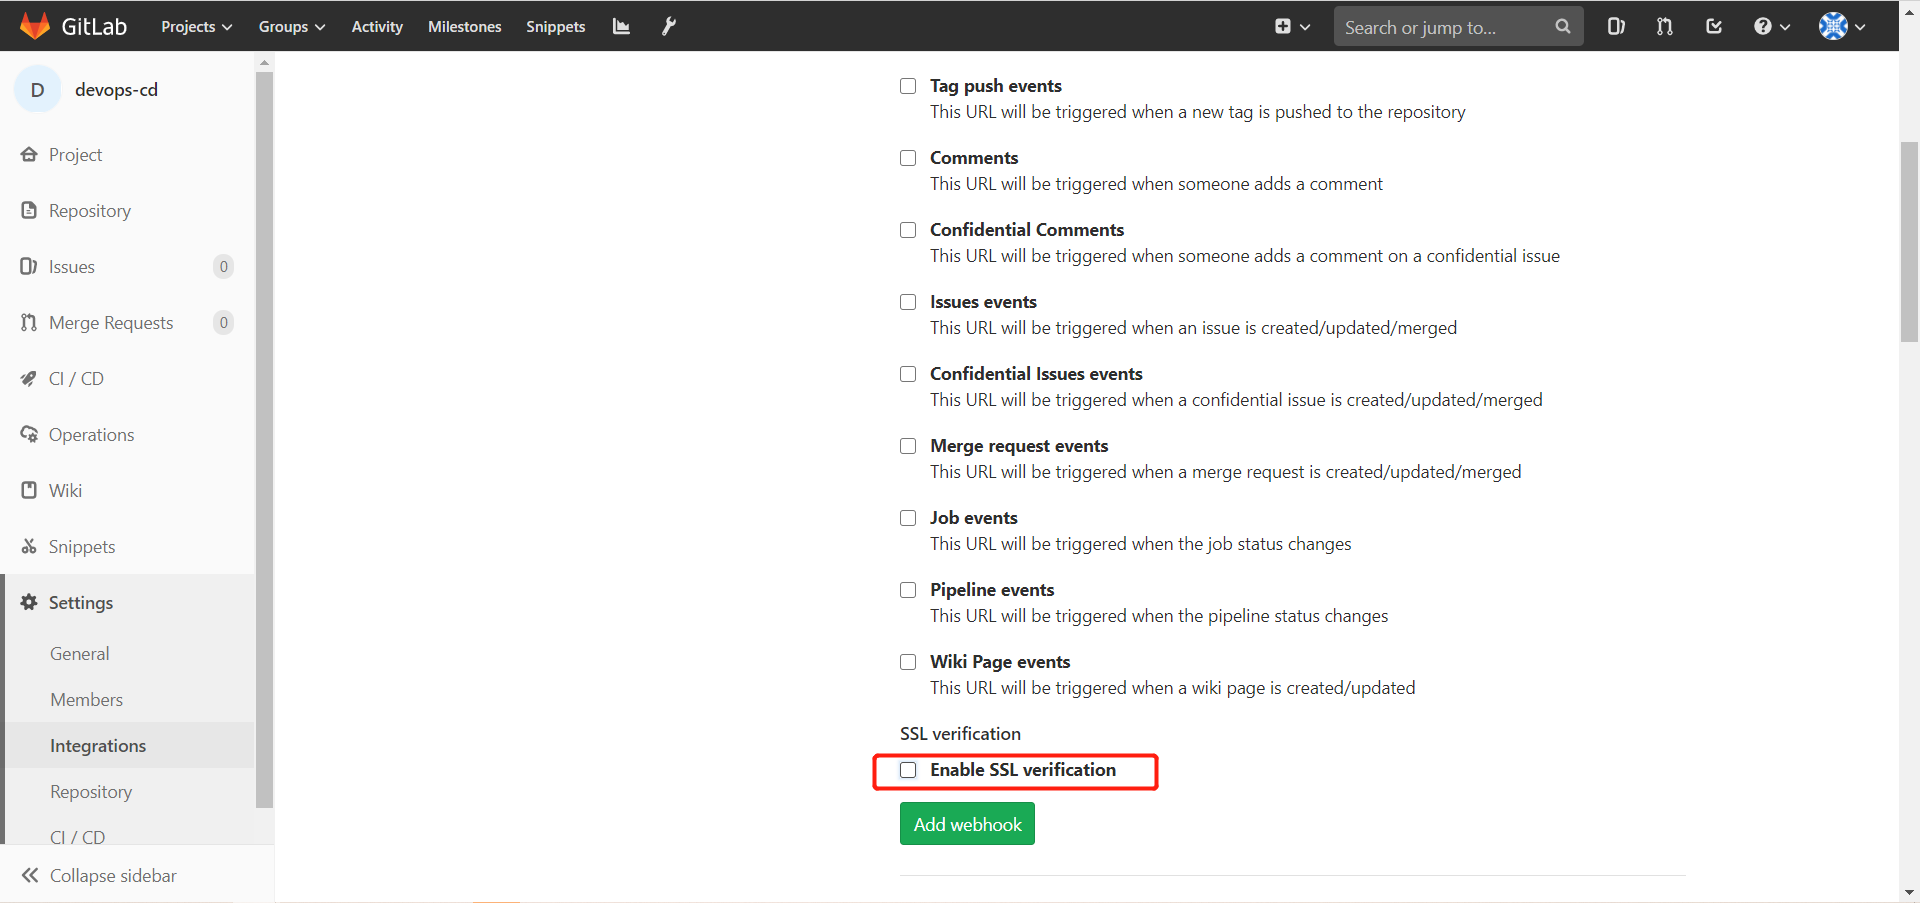
然后点击保存,点击测试,看是否链接成功。如果有如下提示则表示webhook配置没问题了。
现在可以进行修改gitlab仓库,观察是否一提交,argocd那边就可以响应了。
配置监控
集群监控Prometheus是通过Prometheus-operator部署的,所以直接创建两个serviceMonitor即可,如下:
apiVersion: monitoring.coreos.com/v1kind: ServiceMonitormetadata:name: argocd-metricsnamespace: monitoringlabels:k8s-app: prometheus-operatorspec:selector:matchLabels:app.kubernetes.io/name: argocd-metricsapp.kubernetes.io/component: metricsendpoints:- port: metricsinterval: 30sscheme: httpnamespaceSelector:matchNames:- argocd---apiVersion: monitoring.coreos.com/v1kind: ServiceMonitormetadata:name: argocd-server-metricsnamespace: monitoringlabels:k8s-app: prometheus-operatorspec:selector:matchLabels:app.kubernetes.io/name: argocd-server-metricsendpoints:- port: metricsinterval: 30sscheme: httpnamespaceSelector:matchNames:- argocd
然后可以在Prometheus的UI界面查看是否监控成功,如下即为成功。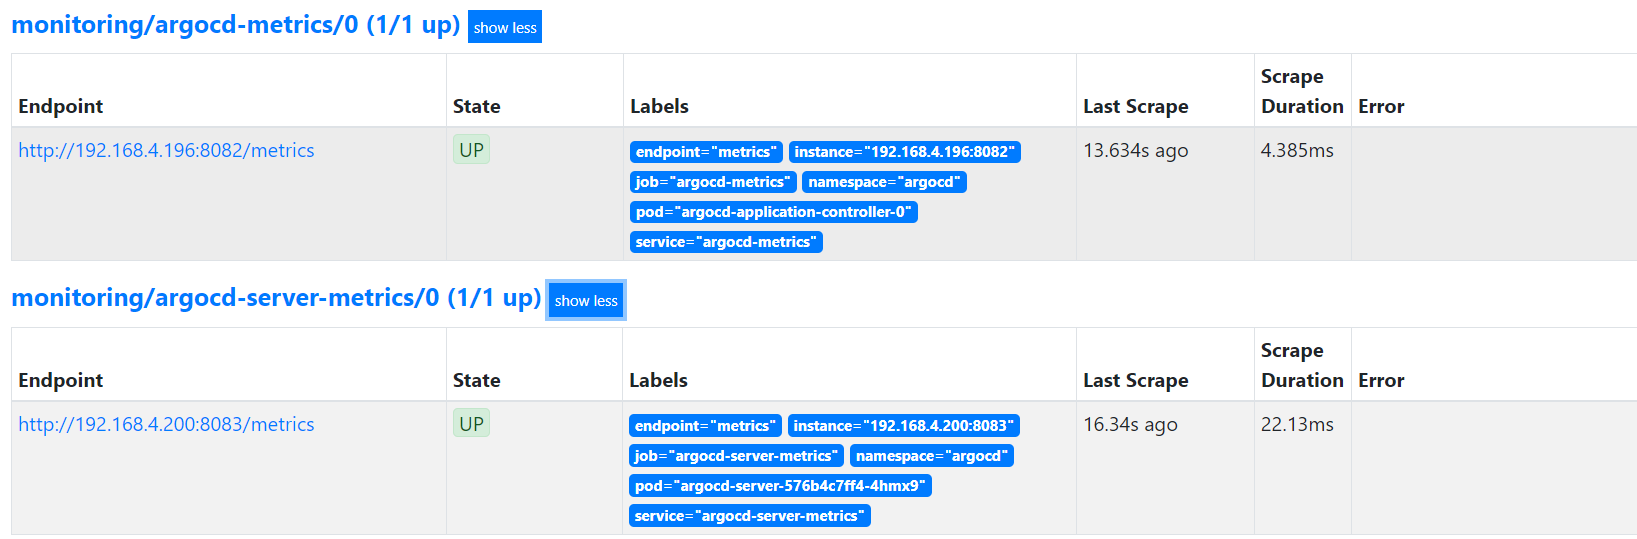
然后在Grafana上导入以下json内容,即可在面板查看信息: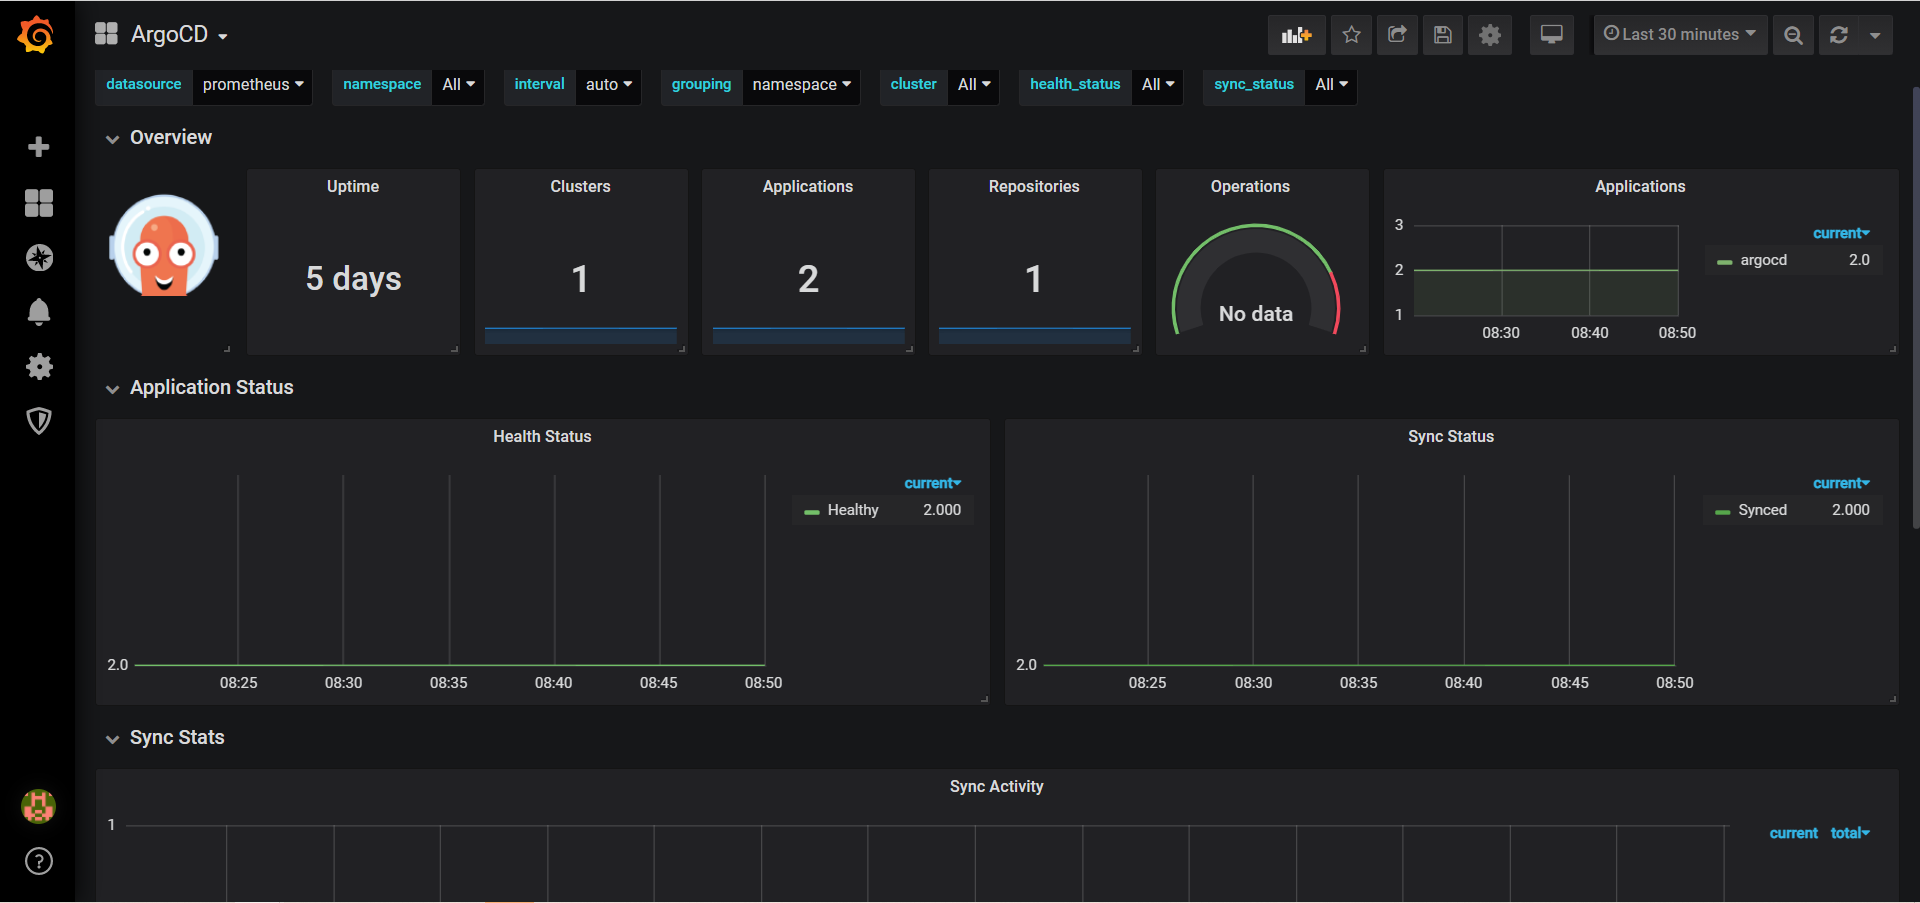

若有收获,就点个赞吧
0 人点赞
