一、架构
为了增加es的扩展性,按角色功能分为master节点、data数据节点、client客户端节点。其整体架构如下: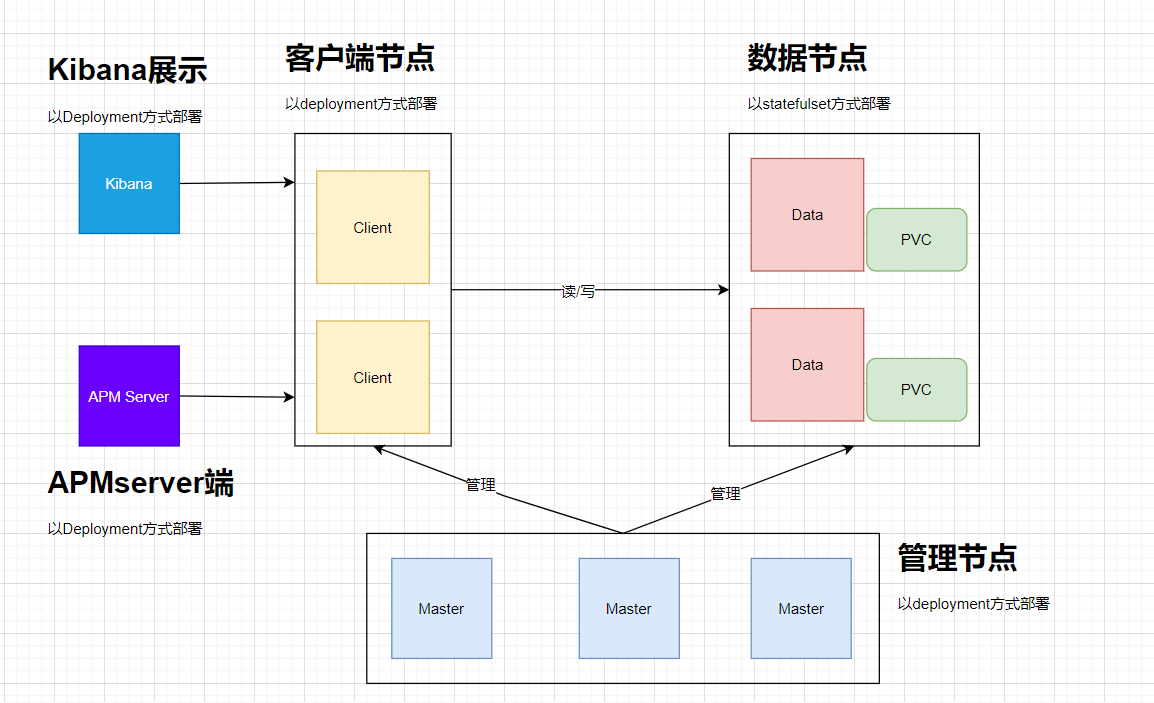
其中:
- Elasticsearch数据节点Pods被部署为一个有状态集(StatefulSet)
- Elasticsearch master节点Pods被部署为一个Deployment
- Elasticsearch客户端节点Pods是以Deployment的形式部署的,其内部服务将允许访问R/W请求的数据节点
- Kibana和APMServer部署为Deployment,其服务可在Kubernetes集群外部访问
1.1、版本说明
| 软件 | 版本 |
|---|---|
| Kibana | 7.8.0 |
| Elasticsearch | 7.8.0 |
| Filebeat | 7.8.0 |
| Kubernetes | 1.17.2 |
| APM-Server | 7.8.0 |
二、部署ES
先创建estatic的命名空间(es-ns.yaml):
apiVersion: v1kind: Namespacemetadata:name: elastic
执行kubectl apply -f es-ns.yaml
2.1、生成证书
启动es的xpack功能,传输需要加密传输。
脚本如下(es-create-ca.sh):
#!/bin/bash# 指定 elasticsearch 版本RELEASE=7.8.0# 运行容器生成证书docker run --name elastic-charts-certs -i -w /app \elasticsearch:${RELEASE} \/bin/sh -c " \elasticsearch-certutil ca --out /app/elastic-stack-ca.p12 --pass '' && \elasticsearch-certutil cert --name security-master --dns security-master --ca /app/elastic-stack-ca.p12 --pass '' --ca-pass '' --out /app/elastic-certificates.p12" && \# 从容器中将生成的证书拷贝出来docker cp elastic-charts-certs:/app/elastic-certificates.p12 ./ && \# 证书生成成功该容器删除docker rm -f elastic-charts-certs && \openssl pkcs12 -nodes -passin pass:'' -in elastic-certificates.p12 -out elastic-certificate.pem
生成证书:
chmod +x es-create-ca.sh && ./es-create-ca.sh
然后会在本地生成两个文件,如下:
# ll-rw-r--r-- 1 root root 4650 Oct 14 16:54 elastic-certificate.pem-rw------- 1 root root 3513 Oct 14 16:54 elastic-certificates.p12
将证书以secret得方式保存在集群中,如下:
kubectl create secret -n elastic generic elastic-certificates --from-file=elastic-certificates.p12kubectl create secret -n elastic generic elastic-certificate-pem --from-file=elastic-certificate.pem
2.1、部署es master节点
配置清单如下(es-master.yaml):
---apiVersion: v1kind: ConfigMapmetadata:namespace: elasticname: elasticsearch-master-configlabels:app: elasticsearchrole: masterdata:elasticsearch.yml: |-cluster.name: ${CLUSTER_NAME}node.name: ${NODE_NAME}discovery.seed_hosts: ${NODE_LIST}cluster.initial_master_nodes: ${MASTER_NODES}network.host: 0.0.0.0node:master: truedata: falseingest: falsexpack.security.enabled: truexpack.monitoring.collection.enabled: truexpack.security.transport.ssl.enabled: truexpack.security.transport.ssl.verification_mode: certificatexpack.security.transport.ssl.keystore.path: /usr/share/elasticsearch/config/certs/elastic-certificates.p12xpack.security.transport.ssl.truststore.path: /usr/share/elasticsearch/config/certs/elastic-certificates.p12xpack.ml.enabled: truexpack.license.self_generated.type: basicxpack.monitoring.exporters.my_local:type: localuse_ingest: false---apiVersion: v1kind: Servicemetadata:namespace: elasticname: elasticsearch-masterlabels:app: elasticsearchrole: masterspec:ports:- port: 9300name: transportselector:app: elasticsearchrole: master---apiVersion: apps/v1kind: Deploymentmetadata:namespace: elasticname: elasticsearch-masterlabels:app: elasticsearchrole: masterspec:replicas: 1selector:matchLabels:app: elasticsearchrole: mastertemplate:metadata:labels:app: elasticsearchrole: masterspec:initContainers:- name: init-sysctlimage: busybox:1.27.2command:- sysctl- -w- vm.max_map_count=262144securityContext:privileged: truecontainers:- name: elasticsearch-masterimage: docker.elastic.co/elasticsearch/elasticsearch:7.8.0env:- name: CLUSTER_NAMEvalue: elasticsearch- name: NODE_NAMEvalue: elasticsearch-master- name: NODE_LISTvalue: elasticsearch-master,elasticsearch-data,elasticsearch-client- name: MASTER_NODESvalue: elasticsearch-master- name: "ES_JAVA_OPTS"value: "-Xms512m -Xmx512m"ports:- containerPort: 9300name: transportvolumeMounts:- name: configmountPath: /usr/share/elasticsearch/config/elasticsearch.ymlreadOnly: truesubPath: elasticsearch.yml- name: storagemountPath: /usr/share/elasticsearch/data- name: localtimemountPath: /etc/localtime- name: keystoremountPath: /usr/share/elasticsearch/config/certs/elastic-certificates.p12readOnly: truesubPath: elastic-certificates.p12volumes:- name: configconfigMap:name: elasticsearch-master-config- name: "storage"emptyDir:medium: ""- name: localtimehostPath:path: /etc/localtime- name: keystoresecret:secretName: elastic-certificatesdefaultMode: 044
然后执行kubectl apply -f ``es-master.yaml创建配置清单,然后pod变为running状态即为部署成功。
# kubectl get pod -n elasticNAME READY STATUS RESTARTS AGEelasticsearch-master-77d5d6c9db-xt5kq 1/1 Running 0 67s
2.2、部署es data节点
配置清单如下(es-data.yaml):
---apiVersion: v1kind: ConfigMapmetadata:namespace: elasticname: elasticsearch-data-configlabels:app: elasticsearchrole: datadata:elasticsearch.yml: |-cluster.name: ${CLUSTER_NAME}node.name: ${NODE_NAME}discovery.seed_hosts: ${NODE_LIST}cluster.initial_master_nodes: ${MASTER_NODES}network.host: 0.0.0.0node:master: falsedata: trueingest: falsexpack.security.enabled: truexpack.monitoring.collection.enabled: truexpack.security.transport.ssl.enabled: truexpack.security.transport.ssl.verification_mode: certificatexpack.security.transport.ssl.keystore.path: /usr/share/elasticsearch/config/certs/elastic-certificates.p12xpack.security.transport.ssl.truststore.path: /usr/share/elasticsearch/config/certs/elastic-certificates.p12xpack.ml.enabled: truexpack.license.self_generated.type: basicxpack.monitoring.exporters.my_local:type: localuse_ingest: false---apiVersion: v1kind: Servicemetadata:namespace: elasticname: elasticsearch-datalabels:app: elasticsearchrole: dataspec:ports:- port: 9300name: transportselector:app: elasticsearchrole: data---apiVersion: apps/v1kind: StatefulSetmetadata:namespace: elasticname: elasticsearch-datalabels:app: elasticsearchrole: dataspec:serviceName: "elasticsearch-data"selector:matchLabels:app: elasticsearchrole: datatemplate:metadata:labels:app: elasticsearchrole: dataspec:initContainers:- name: init-sysctlimage: busybox:1.27.2command:- sysctl- -w- vm.max_map_count=262144securityContext:privileged: truecontainers:- name: elasticsearch-dataimage: docker.elastic.co/elasticsearch/elasticsearch:7.8.0env:- name: CLUSTER_NAMEvalue: elasticsearch- name: NODE_NAMEvalue: elasticsearch-data- name: NODE_LISTvalue: elasticsearch-master,elasticsearch-data,elasticsearch-client- name: MASTER_NODESvalue: elasticsearch-master- name: "ES_JAVA_OPTS"value: "-Xms1024m -Xmx1024m"ports:- containerPort: 9300name: transportvolumeMounts:- name: configmountPath: /usr/share/elasticsearch/config/elasticsearch.ymlreadOnly: truesubPath: elasticsearch.yml- name: elasticsearch-data-persistent-storagemountPath: /usr/share/elasticsearch/data- name: keystoremountPath: /usr/share/elasticsearch/config/certs/elastic-certificates.p12readOnly: truesubPath: elastic-certificates.p12volumes:- name: configconfigMap:name: elasticsearch-data-config- name: keystoresecret:secretName: elastic-certificatesdefaultMode: 044volumeClaimTemplates:- metadata:name: elasticsearch-data-persistent-storagespec:accessModes: [ "ReadWriteOnce" ]storageClassName: managed-nfs-storageresources:requests:storage: 20Gi---
执行kubectl apply -f es-data.yaml创建配置清单,其状态变为running即为部署成功。
# kubectl get pod -n elasticNAME READY STATUS RESTARTS AGEelasticsearch-data-0 1/1 Running 0 4selasticsearch-master-77d5d6c9db-gklgd 1/1 Running 0 2m35selasticsearch-master-77d5d6c9db-gvhcb 1/1 Running 0 2m35selasticsearch-master-77d5d6c9db-pflz6 1/1 Running 0 2m35s
2.3、部署es client节点
配置清单如下(es-client.yaml):
---apiVersion: v1kind: ConfigMapmetadata:namespace: elasticname: elasticsearch-client-configlabels:app: elasticsearchrole: clientdata:elasticsearch.yml: |-cluster.name: ${CLUSTER_NAME}node.name: ${NODE_NAME}discovery.seed_hosts: ${NODE_LIST}cluster.initial_master_nodes: ${MASTER_NODES}network.host: 0.0.0.0node:master: falsedata: falseingest: truexpack.security.enabled: truexpack.monitoring.collection.enabled: truexpack.security.transport.ssl.enabled: truexpack.security.transport.ssl.verification_mode: certificatexpack.security.transport.ssl.keystore.path: /usr/share/elasticsearch/config/certs/elastic-certificates.p12xpack.security.transport.ssl.truststore.path: /usr/share/elasticsearch/config/certs/elastic-certificates.p12xpack.ml.enabled: truexpack.license.self_generated.type: basicxpack.monitoring.exporters.my_local:type: localuse_ingest: false---apiVersion: v1kind: Servicemetadata:namespace: elasticname: elasticsearch-clientlabels:app: elasticsearchrole: clientspec:ports:- port: 9200name: client- port: 9300name: transportselector:app: elasticsearchrole: client---apiVersion: apps/v1kind: Deploymentmetadata:namespace: elasticname: elasticsearch-clientlabels:app: elasticsearchrole: clientspec:selector:matchLabels:app: elasticsearchrole: clienttemplate:metadata:labels:app: elasticsearchrole: clientspec:initContainers:- name: init-sysctlimage: busybox:1.27.2command:- sysctl- -w- vm.max_map_count=262144securityContext:privileged: truecontainers:- name: elasticsearch-clientimage: docker.elastic.co/elasticsearch/elasticsearch:7.8.0env:- name: CLUSTER_NAMEvalue: elasticsearch- name: NODE_NAMEvalue: elasticsearch-client- name: NODE_LISTvalue: elasticsearch-master,elasticsearch-data,elasticsearch-client- name: MASTER_NODESvalue: elasticsearch-master- name: "ES_JAVA_OPTS"value: "-Xms256m -Xmx256m"ports:- containerPort: 9200name: client- containerPort: 9300name: transportvolumeMounts:- name: configmountPath: /usr/share/elasticsearch/config/elasticsearch.ymlreadOnly: truesubPath: elasticsearch.yml- name: storagemountPath: /usr/share/elasticsearch/data- name: keystoremountPath: /usr/share/elasticsearch/config/certs/elastic-certificates.p12readOnly: truesubPath: elastic-certificates.p12volumes:- name: configconfigMap:name: elasticsearch-client-config- name: "storage"emptyDir:medium: ""- name: keystoresecret:secretName: elastic-certificatesdefaultMode: 044
执行kubectl apply -f es-client.yaml创建配置清单,其状态变为running即为部署成功。
# kubectl get pod -n elasticNAME READY STATUS RESTARTS AGEelasticsearch-client-f79cf4f7b-pbz9d 1/1 Running 0 5selasticsearch-data-0 1/1 Running 0 3m11selasticsearch-master-77d5d6c9db-gklgd 1/1 Running 0 5m42selasticsearch-master-77d5d6c9db-gvhcb 1/1 Running 0 5m42selasticsearch-master-77d5d6c9db-pflz6 1/1 Running 0 5m42s
2.4、生成密码
我们启用了 xpack 安全模块来保护我们的集群,所以我们需要一个初始化的密码。我们可以执行如下所示的命令,在客户端节点容器内运行 bin/elasticsearch-setup-passwords 命令来生成默认的用户名和密码:
# kubectl exec $(kubectl get pods -n elastic | grep elasticsearch-client | sed -n 1p | awk '{print $1}') \-n elastic \-- bin/elasticsearch-setup-passwords auto -bChanged password for user apm_systemPASSWORD apm_system = hvlXFW1lIn04Us99MgewChanged password for user kibana_systemPASSWORD kibana_system = 7Zwfbd250QfV6VcqfY9zChanged password for user kibanaPASSWORD kibana = 7Zwfbd250QfV6VcqfY9zChanged password for user logstash_systemPASSWORD logstash_system = tuUsRXDYMOtBEbpTIJgXChanged password for user beats_systemPASSWORD beats_system = 36HrrpwqOdd7VFAzh8EWChanged password for user remote_monitoring_userPASSWORD remote_monitoring_user = bD1vsqJJZoLxGgVciXYRChanged password for user elasticPASSWORD elastic = BA72sAEEY1Bphgruxlcw
注意需要将 elastic 用户名和密码也添加到 Kubernetes 的 Secret 对象中:
# kubectl create secret generic elasticsearch-pw-elastic \-n elastic \--from-literal password=BA72sAEEY1Bphgruxlcwsecret/elasticsearch-pw-elastic created
2.5、验证集群状态
部署完成后我们需要验证以下集群状态是否正常。使用如下命令:
# kubectl exec -it -n elastic elasticsearch-client-f79cf4f7b-pbz9d -- curl -u elastic:BA72sAEEY1Bphgruxlcw http://elasticsearch-client.elastic:9200/_cluster/health?pretty{"cluster_name" : "elasticsearch","status" : "green","timed_out" : false,"number_of_nodes" : 3,"number_of_data_nodes" : 1,"active_primary_shards" : 2,"active_shards" : 2,"relocating_shards" : 0,"initializing_shards" : 0,"unassigned_shards" : 0,"delayed_unassigned_shards" : 0,"number_of_pending_tasks" : 0,"number_of_in_flight_fetch" : 0,"task_max_waiting_in_queue_millis" : 0,"active_shards_percent_as_number" : 100.0}
我们可以看到集群状态是green,表示正常。
三、部署Kibana
Kibana是一个简单的可视化ES数据的工具,其yaml清单如下:
---apiVersion: v1kind: ConfigMapmetadata:namespace: elasticname: kibana-configlabels:app: kibanadata:kibana.yml: |-server.host: 0.0.0.0elasticsearch:hosts: ${ELASTICSEARCH_HOSTS}username: ${ELASTICSEARCH_USER}password: ${ELASTICSEARCH_PASSWORD}---apiVersion: v1kind: Servicemetadata:namespace: elasticname: kibanalabels:app: kibanaspec:ports:- port: 5601name: webinterfaceselector:app: kibana---apiVersion: networking.k8s.io/v1beta1kind: Ingressmetadata:annotations:prometheus.io/http-probe: 'true'prometheus.io/scrape: 'true'name: kibananamespace: elasticspec:rules:- host: kibana.coolops.cnhttp:paths:- backend:serviceName: kibanaservicePort: 5601path: /---apiVersion: apps/v1kind: Deploymentmetadata:namespace: elasticname: kibanalabels:app: kibanaspec:selector:matchLabels:app: kibanatemplate:metadata:labels:app: kibanaspec:containers:- name: kibanaimage: docker.elastic.co/kibana/kibana:7.8.0ports:- containerPort: 5601name: webinterfaceenv:- name: ELASTICSEARCH_HOSTSvalue: "http://elasticsearch-client.elastic.svc.cluster.local:9200"- name: ELASTICSEARCH_USERvalue: "elastic"- name: ELASTICSEARCH_PASSWORDvalueFrom:secretKeyRef:name: elasticsearch-pw-elastickey: passwordvolumeMounts:- name: configmountPath: /usr/share/kibana/config/kibana.ymlreadOnly: truesubPath: kibana.ymlvolumes:- name: configconfigMap:name: kibana-config---
然后执行kubectl apply -f kibana.yaml创建kibana,查看pod的状态是否为running。
# kubectl get pod -n elasticNAME READY STATUS RESTARTS AGEelasticsearch-client-f79cf4f7b-pbz9d 1/1 Running 0 30melasticsearch-data-0 1/1 Running 0 33melasticsearch-master-77d5d6c9db-gklgd 1/1 Running 0 36melasticsearch-master-77d5d6c9db-gvhcb 1/1 Running 0 36melasticsearch-master-77d5d6c9db-pflz6 1/1 Running 0 36mkibana-6b9947fccb-4vp29 1/1 Running 0 3m51s
如下图所示,使用上面我们创建的 Secret 对象的 elastic 用户和生成的密码即可登录: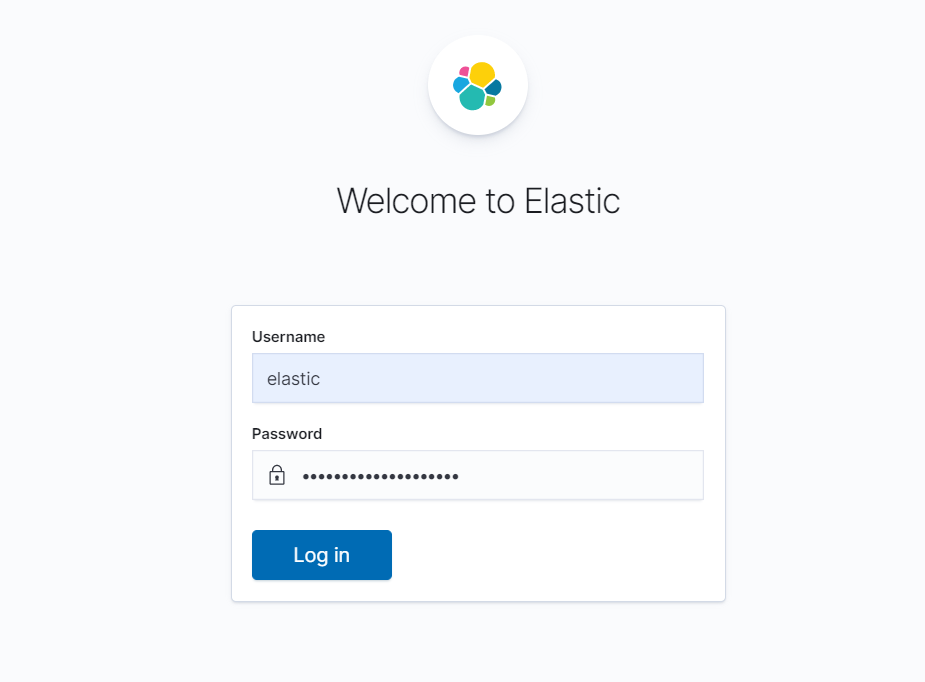
登录成功后即可进入以下界面。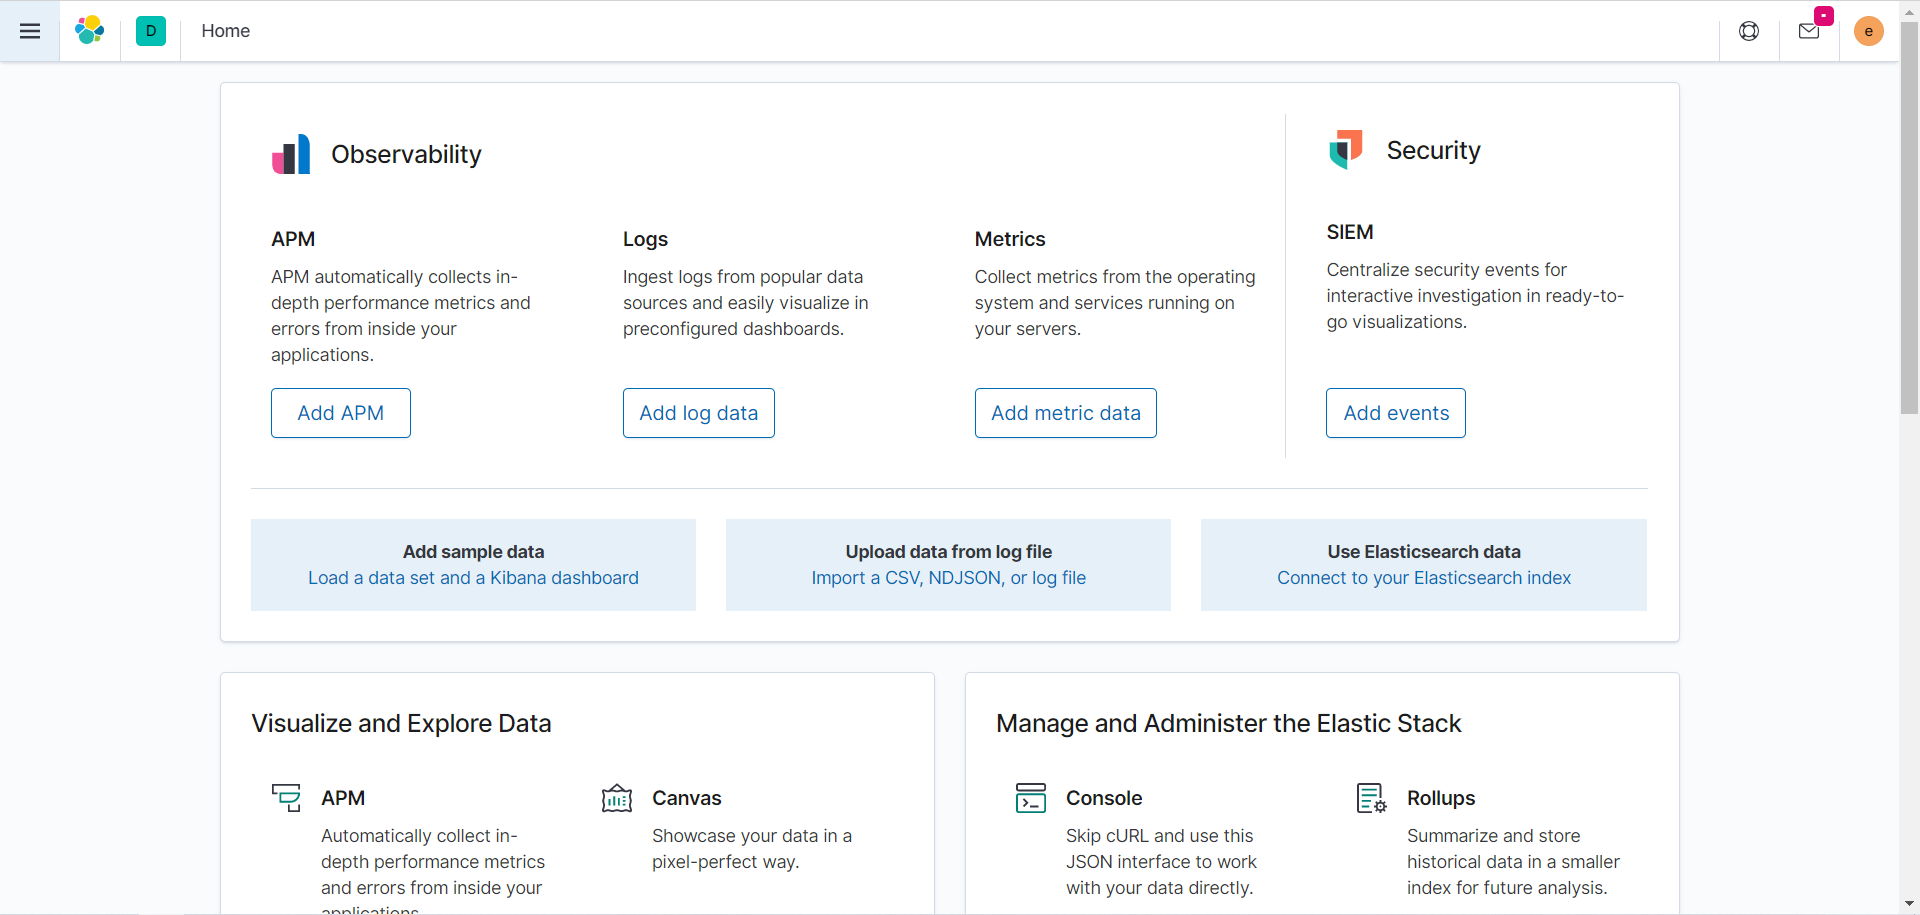
四、部署Elastic APM
Elastic APM 是 Elastic Stack 上用于应用性能监控的工具,它允许我们通过收集传入请求、数据库查询、缓存调用等方式来实时监控应用性能。这可以让我们更加轻松快速定位性能问题。
Elastic APM 是兼容 OpenTracing 的,所以我们可以使用大量现有的库来跟踪应用程序性能。比如我们可以在一个分布式环境(微服务架构)中跟踪一个请求,并轻松找到可能潜在的性能瓶颈。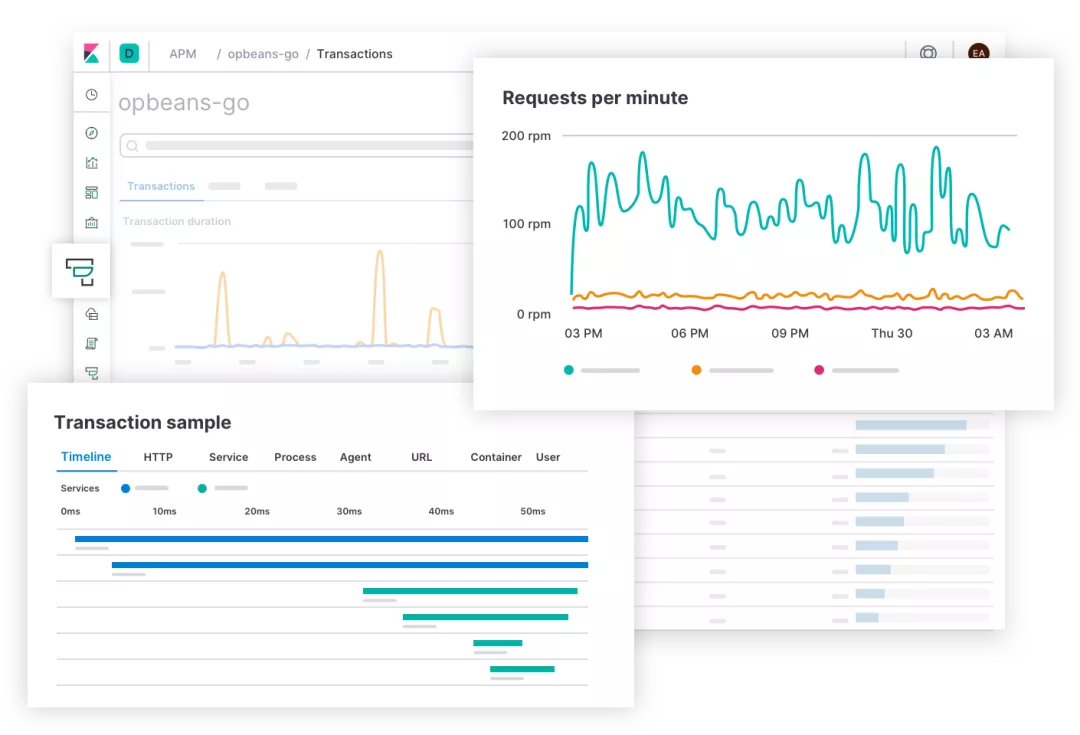
Elastic APM 通过一个名为 APM-Server 的组件提供服务,用于收集并向 ElasticSearch 以及和应用一起运行的 agent 程序发送追踪数据。
4.1、安装APM Server
配置清单如下(apm-server.yaml):
---apiVersion: v1kind: ConfigMapmetadata:namespace: elasticname: apm-server-configlabels:app: apm-serverdata:apm-server.yml: |-apm-server:host: "0.0.0.0:8200"output.elasticsearch:hosts: ['${ELASTICSEARCH_HOST:elasticsearch}:${ELASTICSEARCH_PORT:9200}']username: ${ELASTICSEARCH_USERNAME}password: ${ELASTICSEARCH_PASSWORD}setup.kibana:host: '${KIBANA_HOST:kibana}:${KIBANA_PORT:5601}'---apiVersion: v1kind: Servicemetadata:namespace: elasticname: apm-serverlabels:app: apm-serverspec:ports:- port: 8200name: apm-serverselector:app: apm-server---apiVersion: apps/v1kind: Deploymentmetadata:namespace: elasticname: apm-serverlabels:app: apm-serverspec:replicas: 1selector:matchLabels:app: apm-servertemplate:metadata:labels:app: apm-serverspec:containers:- name: apm-serverimage: docker.elastic.co/apm/apm-server:7.8.0env:- name: ELASTICSEARCH_HOSTvalue: elasticsearch-client.elastic.svc.cluster.local- name: ELASTICSEARCH_PORTvalue: "9200"- name: ELASTICSEARCH_USERNAMEvalue: elastic- name: ELASTICSEARCH_PASSWORDvalueFrom:secretKeyRef:name: elasticsearch-pw-elastickey: password- name: KIBANA_HOSTvalue: kibana.elastic.svc.cluster.local- name: KIBANA_PORTvalue: "5601"ports:- containerPort: 8200name: apm-servervolumeMounts:- name: configmountPath: /usr/share/apm-server/apm-server.ymlreadOnly: truesubPath: apm-server.ymlvolumes:- name: configconfigMap:name: apm-server-config
然后执行kubectl apply -f apm-server.yaml,查看其pod状态,当其成为running则代表启动成功。
# kubectl get pod -n elasticNAME READY STATUS RESTARTS AGEapm-server-667bfc5cff-7vqsd 1/1 Running 0 91selasticsearch-client-f79cf4f7b-pbz9d 1/1 Running 0 177melasticsearch-data-0 1/1 Running 0 3helasticsearch-master-77d5d6c9db-gklgd 1/1 Running 0 3h3melasticsearch-master-77d5d6c9db-gvhcb 1/1 Running 0 3h3melasticsearch-master-77d5d6c9db-pflz6 1/1 Running 0 3h3mkibana-6b9947fccb-4vp29 1/1 Running 0 150m
4.2、部署APM Agent
这里以Java agent为例。
接下来我们在示例应用程序 spring-boot-simple 上配置一个 Elastic APM Java agent。
首先我们需要把 elastic-apm-agent-1.8.0.jar 这个 jar 包程序内置到应用容器中去,在构建镜像的 Dockerfile 文件中添加一行如下所示的命令直接下载该 JAR 包即可:
RUN wget -O /apm-agent.jar https://search.maven.org/remotecontent?filepath=co/elastic/apm/elastic-apm-agent/1.8.0/elastic-apm-agent-1.8.0.jar
完整的 Dockerfile 文件如下所示:
FROM openjdk:8-jdk-alpineENV ELASTIC_APM_VERSION "1.8.0"RUN wget -O /apm-agent.jar https://search.maven.org/remotecontent?filepath=co/elastic/apm/elastic-apm-agent/$ELASTIC_APM_VERSION/elastic-apm-agent-$ELASTIC_APM_VERSION.jarCOPY target/spring-boot-simple.jar /app.jarCMD java -jar /app.jar
然后需要在示例应用中添加上如下依赖关系,这样我们就可以集成 open-tracing 的依赖库或者使用 Elastic APM API 手动检测。
<dependency><groupId>co.elastic.apm</groupId><artifactId>apm-agent-api</artifactId><version>${elastic-apm.version}</version></dependency><dependency><groupId>co.elastic.apm</groupId><artifactId>apm-opentracing</artifactId><version>${elastic-apm.version}</version></dependency><dependency><groupId>io.opentracing.contrib</groupId><artifactId>opentracing-spring-cloud-mongo-starter</artifactId><version>${opentracing-spring-cloud.version}</version></dependency>
然后部署一个示例代码,用于验证。
(1)、先部署mongo,yaml清单如下:
---apiVersion: v1kind: Servicemetadata:name: mongonamespace: elasticlabels:app: mongospec:ports:- port: 27017protocol: TCPselector:app: mongo---apiVersion: apps/v1kind: StatefulSetmetadata:namespace: elasticname: mongolabels:app: mongospec:serviceName: "mongo"selector:matchLabels:app: mongotemplate:metadata:labels:app: mongospec:containers:- name: mongoimage: mongoports:- containerPort: 27017
(2)、部署java应用,yaml清单如下:
---apiVersion: v1kind: Servicemetadata:namespace: elasticname: spring-boot-simplelabels:app: spring-boot-simplespec:type: NodePortports:- port: 8080protocol: TCPselector:app: spring-boot-simple---apiVersion: apps/v1kind: Deploymentmetadata:namespace: elasticname: spring-boot-simplelabels:app: spring-boot-simplespec:selector:matchLabels:app: spring-boot-simpletemplate:metadata:labels:app: spring-boot-simplespec:containers:- image: gjeanmart/spring-boot-simple:0.0.1-SNAPSHOTimagePullPolicy: Alwaysname: spring-boot-simplecommand:- "java"- "-javaagent:/apm-agent.jar"- "-Delastic.apm.active=$(ELASTIC_APM_ACTIVE)"- "-Delastic.apm.server_urls=$(ELASTIC_APM_SERVER)"- "-Delastic.apm.service_name=spring-boot-simple"- "-jar"- "app.jar"env:- name: SPRING_DATA_MONGODB_HOSTvalue: mongo- name: ELASTIC_APM_ACTIVEvalue: "true"- name: ELASTIC_APM_SERVERvalue: http://apm-server.elastic.svc.cluster.local:8200ports:- containerPort: 8080---
部署后观察pod的状态是否变为running。
# kubectl get pod -n elasticNAME READY STATUS RESTARTS AGEapm-server-667bfc5cff-7vqsd 1/1 Running 0 34melasticsearch-client-f79cf4f7b-pbz9d 1/1 Running 0 3h30melasticsearch-data-0 1/1 Running 0 3h33melasticsearch-master-77d5d6c9db-gklgd 1/1 Running 0 3h36melasticsearch-master-77d5d6c9db-gvhcb 1/1 Running 0 3h36melasticsearch-master-77d5d6c9db-pflz6 1/1 Running 0 3h36mkibana-6b9947fccb-4vp29 1/1 Running 0 3h3mmongo-0 1/1 Running 0 11mspring-boot-simple-fb5564885-rvh6q 1/1 Running 0 80s
测试应用。
# curl -X GET 172.17.100.50:30809Greetings from Spring Boot!# 获取所有发布的 messages 数据:# curl -X GET 172.17.100.50:30809/message# 使用 sleep=<ms> 来模拟慢请求:# curl -X GET 172.17.100.50:30809/message?sleep=3000# 使用 error=true 来触发一异常:# curl -X GET 172.17.100.50:30809/message?error=true
然后我们可以在kibane的APM页面看到应用以及其数据了。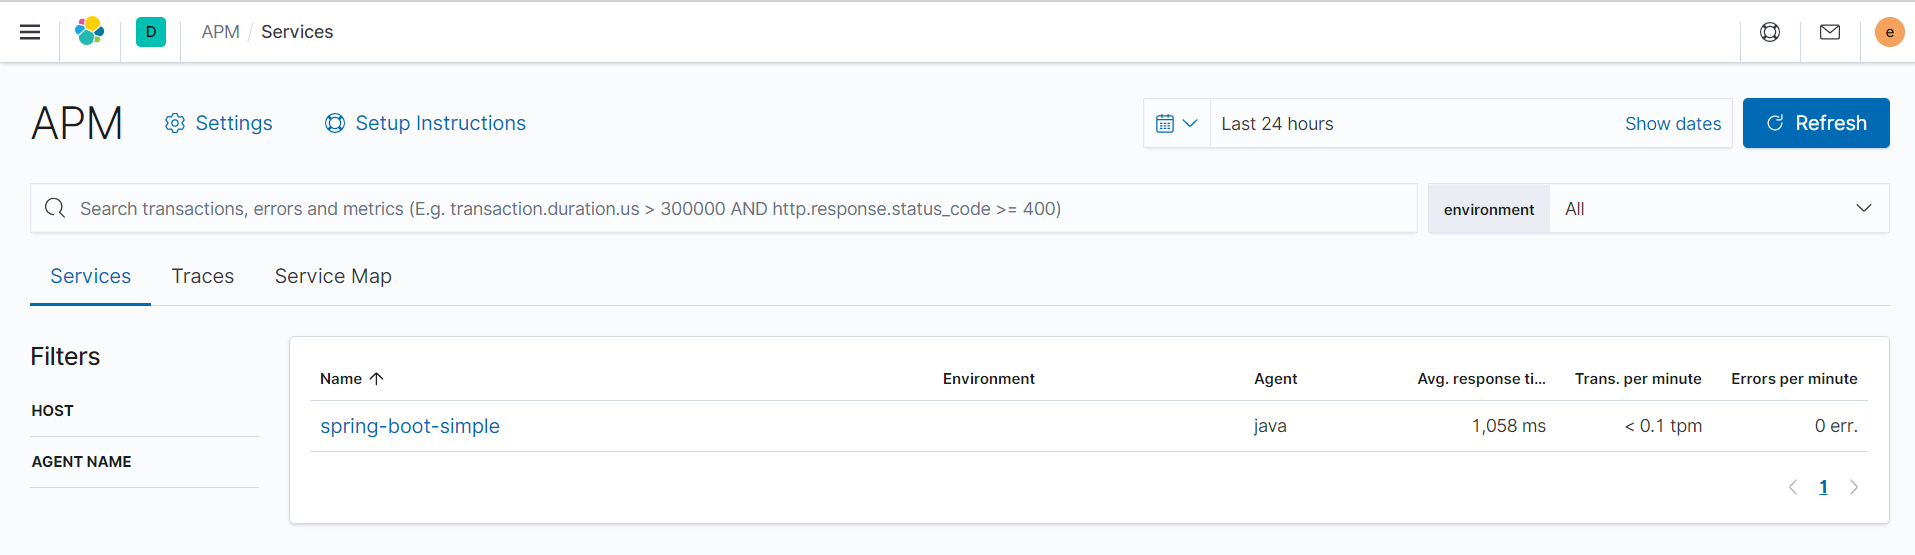
点击应用可以查看其性能追踪。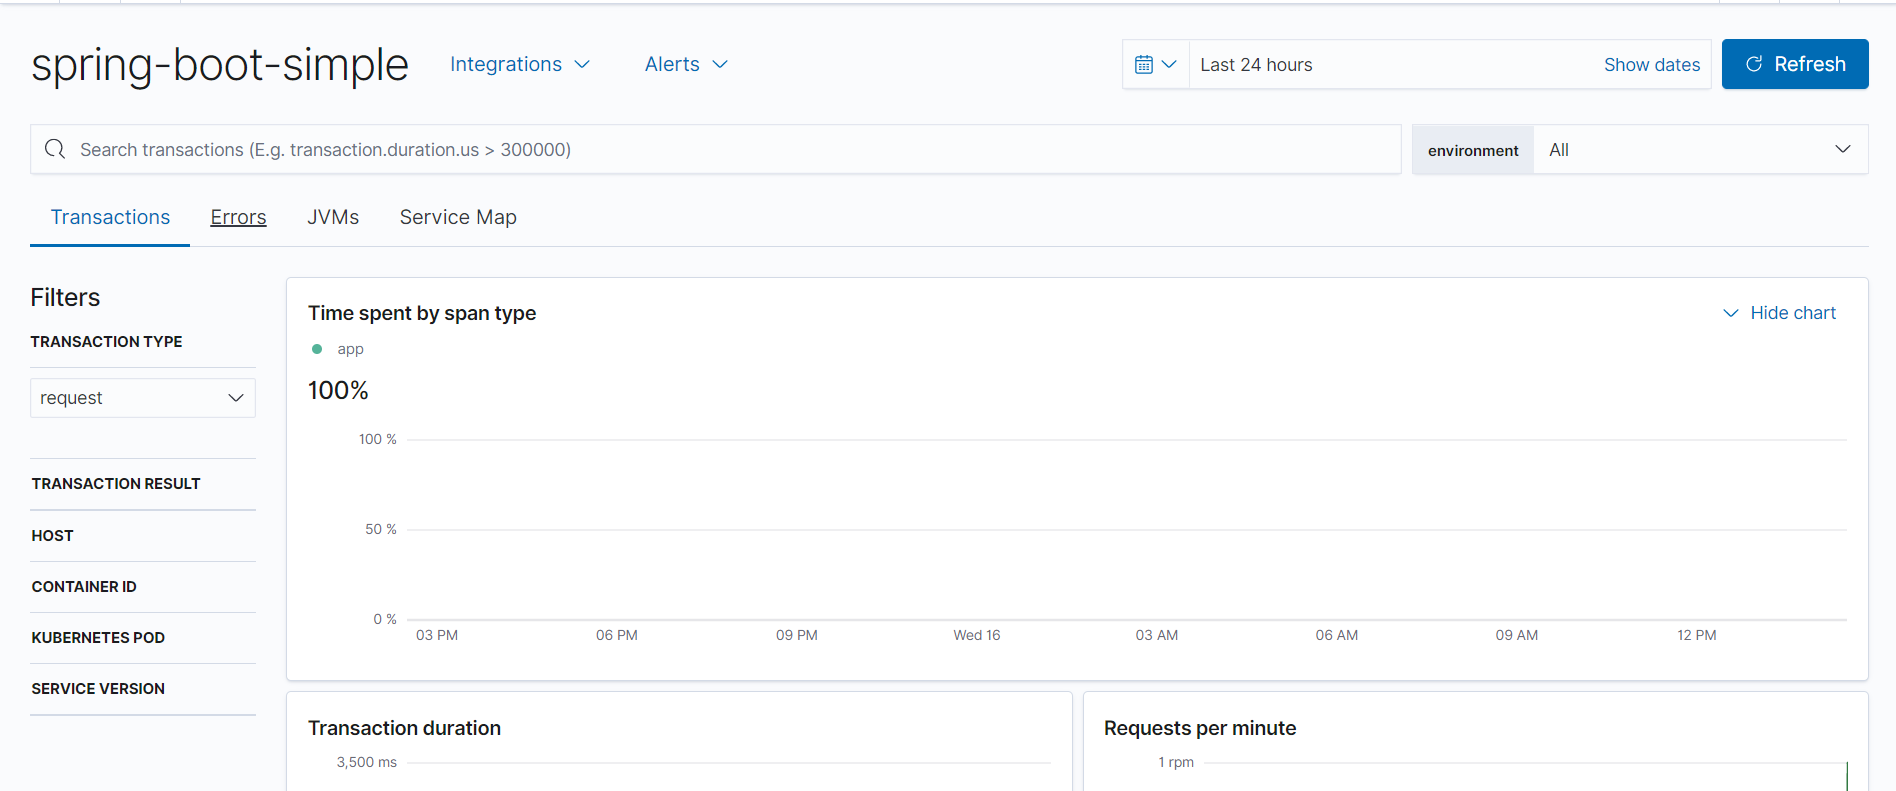
点击错误,可以查看错误数据。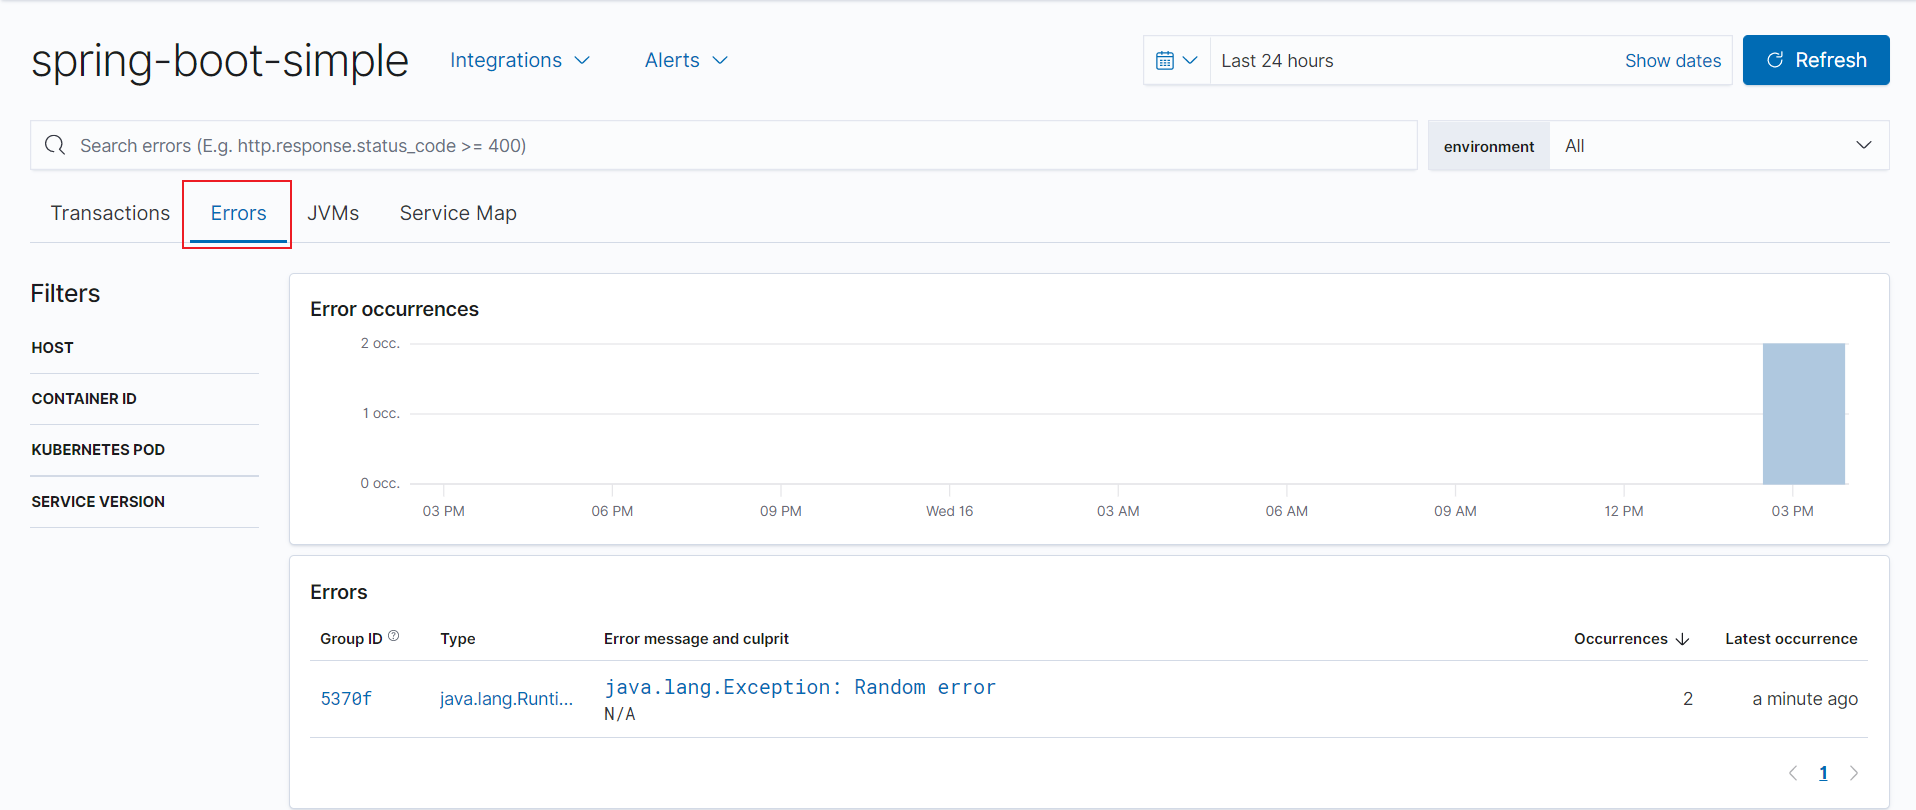
而且还可以查到详细的错误信息。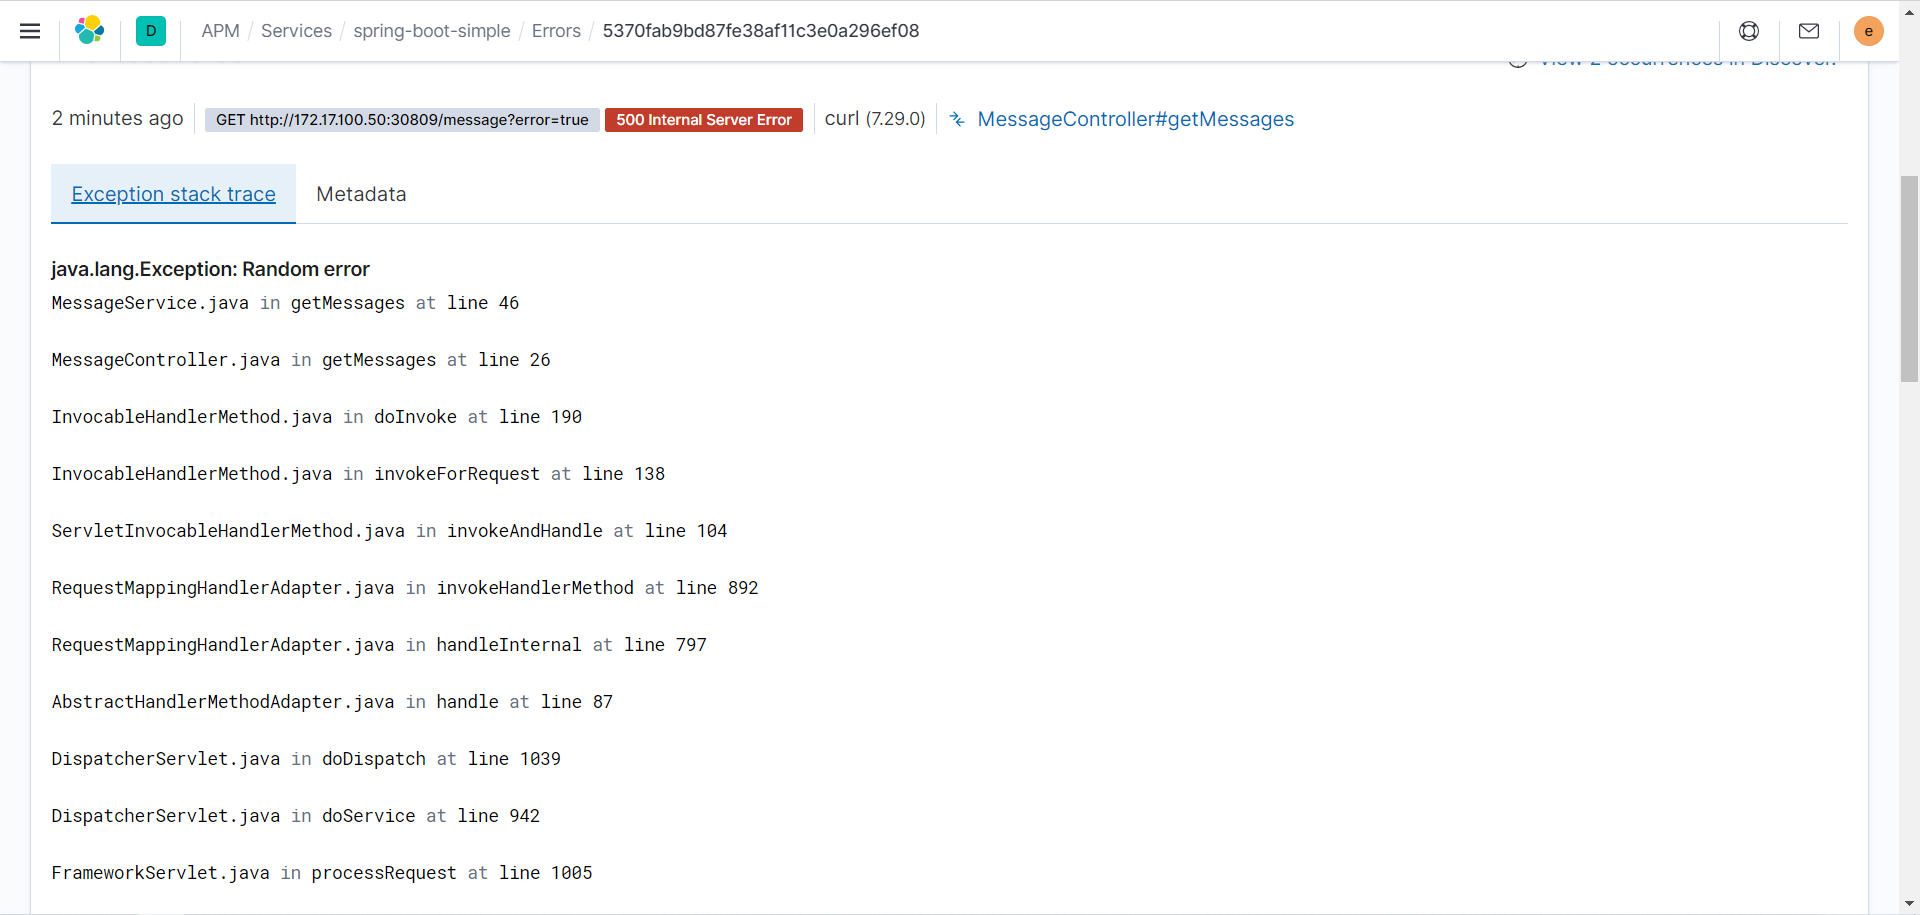
还可以查看JVM的数据监控。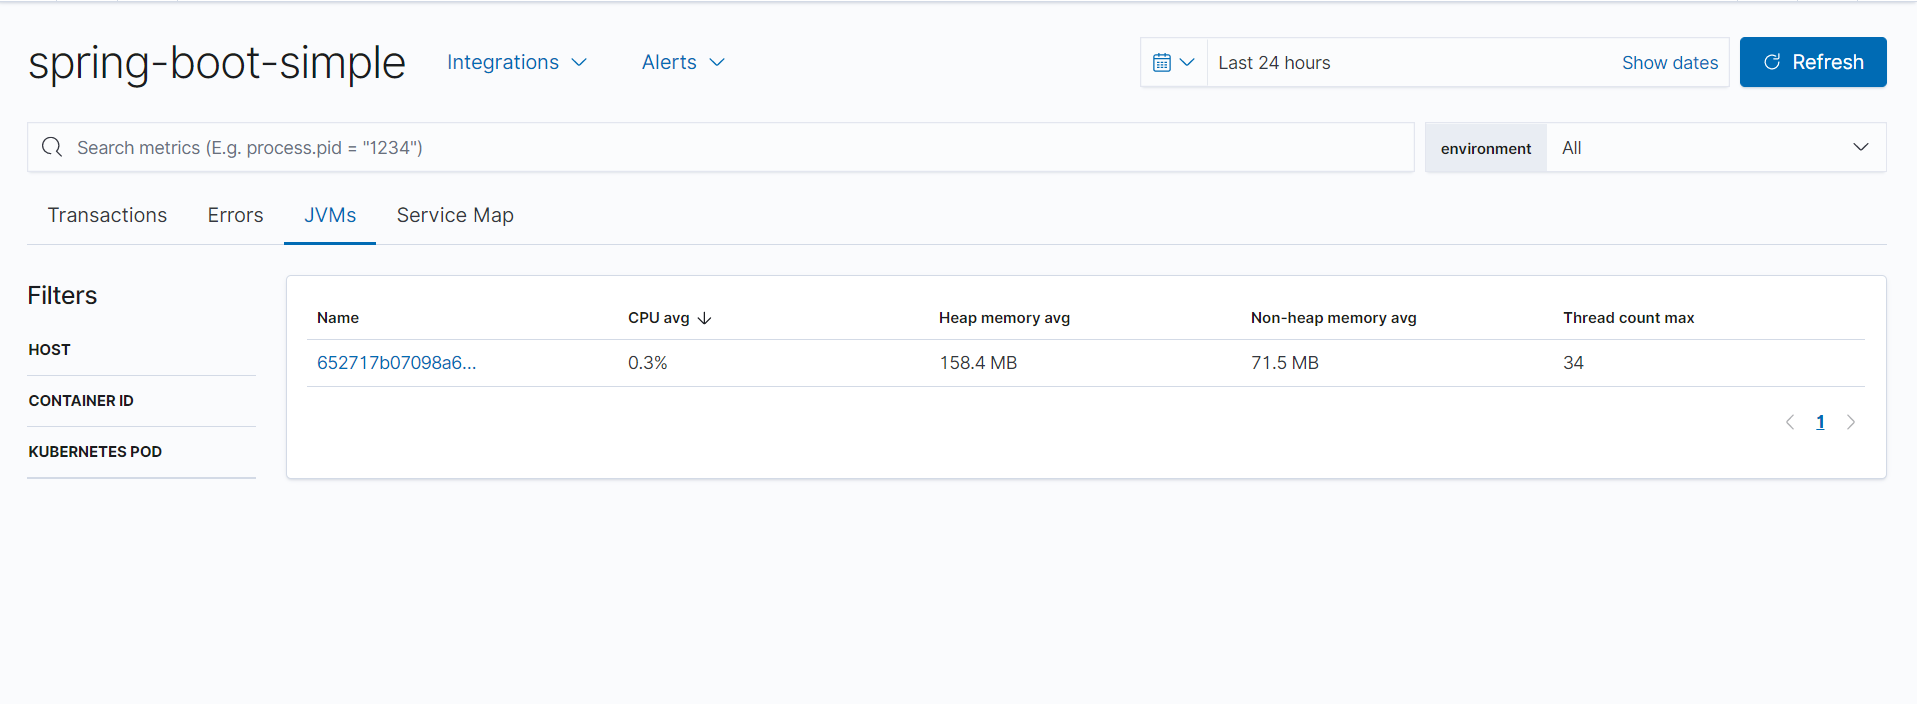
可以查看一些详细的数据。
五、采集日志
使用filebeat采集日志。配置清单如下:
---apiVersion: v1kind: ConfigMapmetadata:namespace: elasticname: filebeat-indice-lifecyclelabels:app: filebeatdata:indice-lifecycle.json: |-{"policy": {"phases": {"hot": {"actions": {"rollover": {"max_size": "5GB" ,"max_age": "1d"}}},"delete": {"min_age": "3d","actions": {"delete": {}}}}}}------apiVersion: v1kind: ConfigMapmetadata:namespace: elasticname: filebeat-configlabels:app: filebeatdata:filebeat.yml: |-filebeat.inputs:- type: containerenabled: truepaths:- /var/log/containers/*.logprocessors:- add_kubernetes_metadata:in_cluster: truehost: ${NODE_NAME}matchers:- logs_path:logs_path: "/var/log/containers/"filebeat.autodiscover:providers:- type: kubernetestemplates:- condition.equals:kubernetes.labels.app: mongoconfig:- module: mongodbenabled: truelog:input:type: dockercontainers.ids:- ${data.kubernetes.container.id}processors:- drop_event:when.or:- and:- regexp:message: '^\d+\.\d+\.\d+\.\d+ '- equals:fileset.name: error- and:- not:regexp:message: '^\d+\.\d+\.\d+\.\d+ '- equals:fileset.name: access- add_cloud_metadata:- add_kubernetes_metadata:matchers:- logs_path:logs_path: "/var/log/containers/"- add_docker_metadata:output.elasticsearch:hosts: ['${ELASTICSEARCH_HOST:elasticsearch}:${ELASTICSEARCH_PORT:9200}']username: ${ELASTICSEARCH_USERNAME}password: ${ELASTICSEARCH_PASSWORD}setup.kibana:host: '${KIBANA_HOST:kibana}:${KIBANA_PORT:5601}'setup.dashboards.enabled: truesetup.template.enabled: truesetup.ilm:policy_file: /etc/indice-lifecycle.json---apiVersion: apps/v1kind: DaemonSetmetadata:namespace: elasticname: filebeatlabels:app: filebeatspec:selector:matchLabels:app: filebeattemplate:metadata:labels:app: filebeatspec:serviceAccountName: filebeatterminationGracePeriodSeconds: 30containers:- name: filebeatimage: docker.elastic.co/beats/filebeat:7.8.0args: ["-c", "/etc/filebeat.yml","-e",]env:- name: ELASTICSEARCH_HOSTvalue: elasticsearch-client.elastic.svc.cluster.local- name: ELASTICSEARCH_PORTvalue: "9200"- name: ELASTICSEARCH_USERNAMEvalue: elastic- name: ELASTICSEARCH_PASSWORDvalueFrom:secretKeyRef:name: elasticsearch-pw-elastickey: password- name: KIBANA_HOSTvalue: kibana.elastic.svc.cluster.local- name: KIBANA_PORTvalue: "5601"- name: NODE_NAMEvalueFrom:fieldRef:fieldPath: spec.nodeNamesecurityContext:runAsUser: 0resources:limits:memory: 200Mirequests:cpu: 100mmemory: 100MivolumeMounts:- name: configmountPath: /etc/filebeat.ymlreadOnly: truesubPath: filebeat.yml- name: filebeat-indice-lifecyclemountPath: /etc/indice-lifecycle.jsonreadOnly: truesubPath: indice-lifecycle.json- name: datamountPath: /usr/share/filebeat/data- name: varlogmountPath: /var/logreadOnly: true- name: varlibdockercontainersmountPath: /var/lib/docker/containersreadOnly: true- name: dockersockmountPath: /var/run/docker.sockvolumes:- name: configconfigMap:defaultMode: 0600name: filebeat-config- name: filebeat-indice-lifecycleconfigMap:defaultMode: 0600name: filebeat-indice-lifecycle- name: varloghostPath:path: /var/log- name: varlibdockercontainershostPath:path: /var/lib/docker/containers- name: dockersockhostPath:path: /var/run/docker.sock- name: datahostPath:path: /var/lib/filebeat-datatype: DirectoryOrCreate---apiVersion: rbac.authorization.k8s.io/v1beta1kind: ClusterRoleBindingmetadata:name: filebeatsubjects:- kind: ServiceAccountname: filebeatnamespace: elasticroleRef:kind: ClusterRolename: filebeatapiGroup: rbac.authorization.k8s.io---apiVersion: rbac.authorization.k8s.io/v1beta1kind: ClusterRolemetadata:name: filebeatlabels:app: filebeatrules:- apiGroups: [""]resources:- namespaces- podsverbs:- get- watch- list---apiVersion: v1kind: ServiceAccountmetadata:namespace: elasticname: filebeatlabels:app: filebeat---
上面是采集containers的日志。
参考文档:

若有收获,就点个赞吧
0 人点赞
