1.算法思想
k-平均聚类的目的是:把n个点划分到k个聚类中,使得每个点都属于离他最近的均值(即聚类中心)对应的聚类。
2.聚类算法和分类算法
分类:根据文本的特征或属性,划分到已有的类别中。也就是说,这些类别是已知的,通过对已知分类的数据进行训练和学习,找到这些不同类的特征,再对未分类的数据进行分类。
聚类:压根不知道数据会分为几类,通过聚类分析将数据或者说用户聚合成几个群体,那就是聚类了。聚类不需要对数据进行训练和学习。就像小时候分校区,你家这块离哪个小学近,就去那个小学上学。
3.监督学习和非监督学习
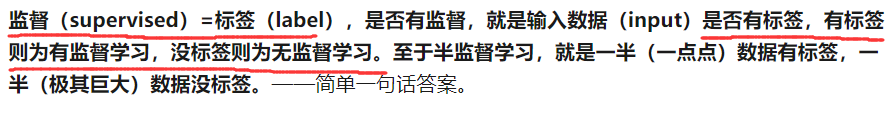
在分类算法中,标签就是类别;而在回归算法中,标签就是具体的y值。
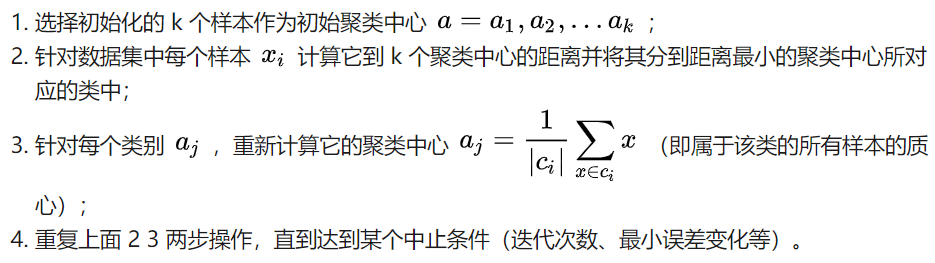
4.算法步骤
5.sklearn代码
# coding:utf-8"""====================================Demonstration of k-means assumptions====================================This example is meant to illustrate situations where k-means will produceunintuitive and possibly unexpected clusters. In the first three plots, theinput data does not conform to some implicit assumption that k-means makes andundesirable clusters are produced as a result. In the last plot, k-meansreturns intuitive clusters despite unevenly sized blobs."""print(__doc__)# Author: Phil Roth <mr.phil.roth@gmail.com># License: BSD 3 clauseimport numpy as npimport matplotlib.pyplot as pltfrom sklearn.cluster import KMeansfrom sklearn.datasets import make_blobsplt.figure(figsize=(12, 12))n_samples = 1500random_state = 170X, y = make_blobs(n_samples=n_samples, random_state=random_state) # 为聚类产生数据集# Incorrect number of clustersy_pred = KMeans(n_clusters=2, random_state=random_state).fit_predict(X)plt.subplot(221)plt.scatter(X[:, 0], X[:, 1], c=y_pred)plt.title("Incorrect Number of Blobs")# Anisotropicly distributed datatransformation = [[0.60834549, -0.63667341], [-0.40887718, 0.85253229]]X_aniso = np.dot(X, transformation)y_pred = KMeans(n_clusters=3, random_state=random_state).fit_predict(X_aniso)plt.subplot(222)plt.scatter(X_aniso[:, 0], X_aniso[:, 1], c=y_pred)plt.title("Anisotropicly Distributed Blobs")# Different varianceX_varied, y_varied = make_blobs(n_samples=n_samples,cluster_std=[1.0, 2.5, 0.5],random_state=random_state)y_pred = KMeans(n_clusters=3, random_state=random_state).fit_predict(X_varied)plt.subplot(223)plt.scatter(X_varied[:, 0], X_varied[:, 1], c=y_pred)plt.title("Unequal Variance")# Unevenly sized blobsX_filtered = np.vstack((X[y == 0][:500], X[y == 1][:100], X[y == 2][:10]))y_pred = KMeans(n_clusters=3,random_state=random_state).fit_predict(X_filtered)plt.subplot(224)plt.scatter(X_filtered[:, 0], X_filtered[:, 1], c=y_pred)plt.title("Unevenly Sized Blobs")plt.show()
最后跑出来的图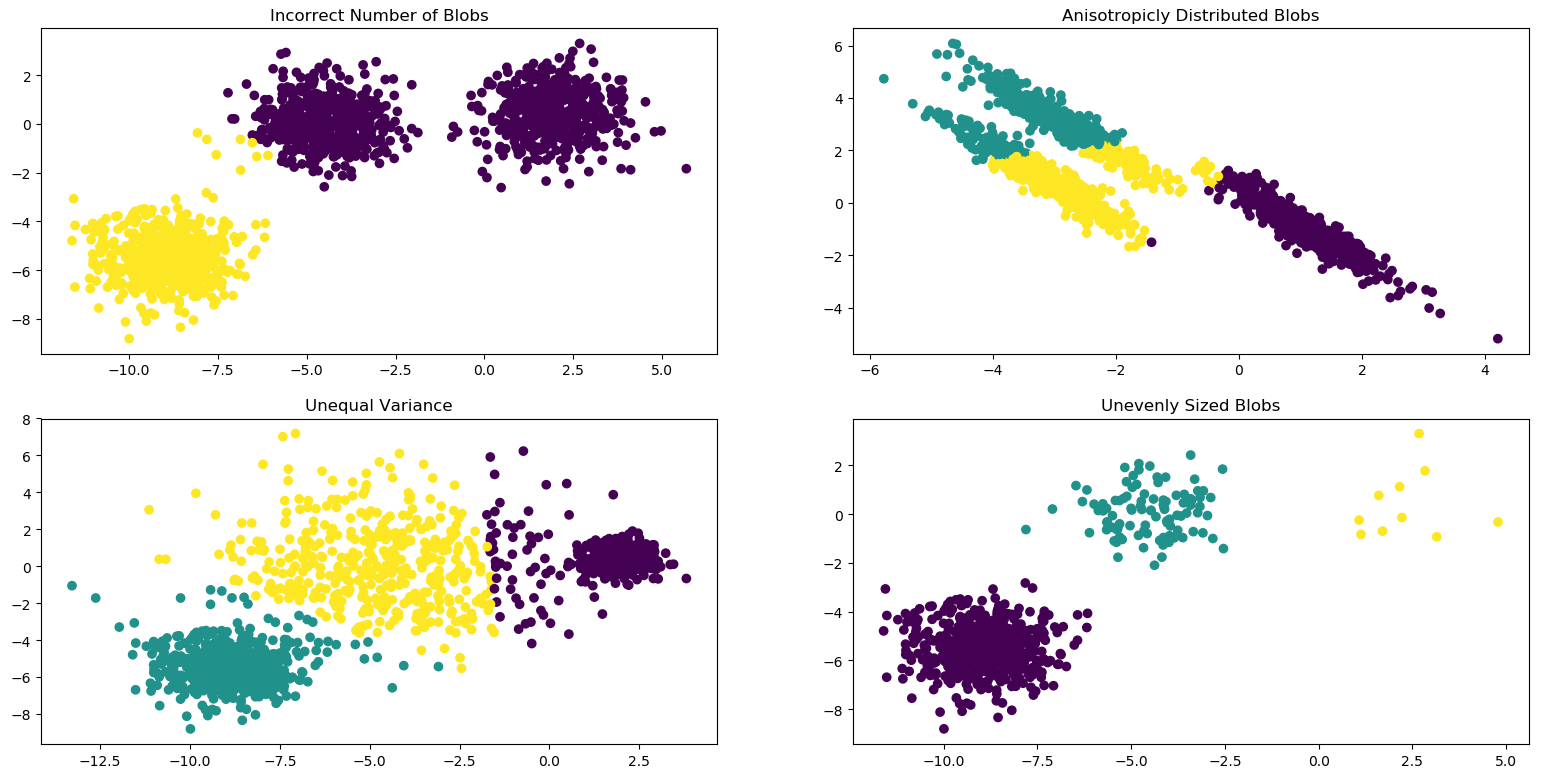
由于聚类算法目前在业务中需要了解的并不多,目前对这些代码暂时不深究,后续有需求再来完善本部分。

若有收获,就点个赞吧
0 人点赞
