Working with missing data
In this section, we will discuss missing (also referred to as NA) values in pandas.
::: tip Note
The choice of using NaN internally to denote missing data was largely
for simplicity and performance reasons. It differs from the MaskedArray
approach of, for example, scikits.timeseries. We are hopeful that
NumPy will soon be able to provide a native NA type solution (similar to R)
performant enough to be used in pandas.
:::
See the cookbook for some advanced strategies.
Values considered “missing”
As data comes in many shapes and forms, pandas aims to be flexible with regard
to handling missing data. While NaN is the default missing value marker for
reasons of computational speed and convenience, we need to be able to easily
detect this value with data of different types: floating point, integer,
boolean, and general object. In many cases, however, the Python None will
arise and we wish to also consider that “missing” or “not available” or “NA”.
::: tip Note
If you want to consider inf and -inf to be “NA” in computations,
you can set pandas.options.mode.use_inf_as_na = True.
:::
In [1]: df = pd.DataFrame(np.random.randn(5, 3), index=['a', 'c', 'e', 'f', 'h'],...: columns=['one', 'two', 'three'])...:In [2]: df['four'] = 'bar'In [3]: df['five'] = df['one'] > 0In [4]: dfOut[4]:one two three four fivea 0.469112 -0.282863 -1.509059 bar Truec -1.135632 1.212112 -0.173215 bar Falsee 0.119209 -1.044236 -0.861849 bar Truef -2.104569 -0.494929 1.071804 bar Falseh 0.721555 -0.706771 -1.039575 bar TrueIn [5]: df2 = df.reindex(['a', 'b', 'c', 'd', 'e', 'f', 'g', 'h'])In [6]: df2Out[6]:one two three four fivea 0.469112 -0.282863 -1.509059 bar Trueb NaN NaN NaN NaN NaNc -1.135632 1.212112 -0.173215 bar Falsed NaN NaN NaN NaN NaNe 0.119209 -1.044236 -0.861849 bar Truef -2.104569 -0.494929 1.071804 bar Falseg NaN NaN NaN NaN NaNh 0.721555 -0.706771 -1.039575 bar True
To make detecting missing values easier (and across different array dtypes),
pandas provides the isna() and
notna() functions, which are also methods on
Series and DataFrame objects:
In [7]: df2['one']Out[7]:a 0.469112b NaNc -1.135632d NaNe 0.119209f -2.104569g NaNh 0.721555Name: one, dtype: float64In [8]: pd.isna(df2['one'])Out[8]:a Falseb Truec Falsed Truee Falsef Falseg Trueh FalseName: one, dtype: boolIn [9]: df2['four'].notna()Out[9]:a Trueb Falsec Trued Falsee Truef Trueg Falseh TrueName: four, dtype: boolIn [10]: df2.isna()Out[10]:one two three four fivea False False False False Falseb True True True True Truec False False False False Falsed True True True True Truee False False False False Falsef False False False False Falseg True True True True Trueh False False False False False
::: danger Warning
One has to be mindful that in Python (and NumPy), the nan's don’t compare equal, but None's do.
Note that pandas/NumPy uses the fact that np.nan != np.nan, and treats None like np.nan.
In [11]: None == None # noqa: E711Out[11]: TrueIn [12]: np.nan == np.nanOut[12]: False
So as compared to above, a scalar equality comparison versus a None/np.nan doesn’t provide useful information.
In [13]: df2['one'] == np.nanOut[13]:a Falseb Falsec Falsed Falsee Falsef Falseg Falseh FalseName: one, dtype: bool
:::
Integer dtypes and missing data
Because NaN is a float, a column of integers with even one missing values
is cast to floating-point dtype (see Support for integer NA for more). Pandas
provides a nullable integer array, which can be used by explicitly requesting
the dtype:
In [14]: pd.Series([1, 2, np.nan, 4], dtype=pd.Int64Dtype())Out[14]:0 11 22 NaN3 4dtype: Int64
Alternatively, the string alias dtype='Int64' (note the capital "I") can be
used.
See Nullable integer data type for more.
Datetimes
For datetime64[ns] types, NaT represents missing values. This is a pseudo-native
sentinel value that can be represented by NumPy in a singular dtype (datetime64[ns]).
pandas objects provide compatibility between NaT and NaN.
In [15]: df2 = df.copy()In [16]: df2['timestamp'] = pd.Timestamp('20120101')In [17]: df2Out[17]:one two three four five timestampa 0.469112 -0.282863 -1.509059 bar True 2012-01-01c -1.135632 1.212112 -0.173215 bar False 2012-01-01e 0.119209 -1.044236 -0.861849 bar True 2012-01-01f -2.104569 -0.494929 1.071804 bar False 2012-01-01h 0.721555 -0.706771 -1.039575 bar True 2012-01-01In [18]: df2.loc[['a', 'c', 'h'], ['one', 'timestamp']] = np.nanIn [19]: df2Out[19]:one two three four five timestampa NaN -0.282863 -1.509059 bar True NaTc NaN 1.212112 -0.173215 bar False NaTe 0.119209 -1.044236 -0.861849 bar True 2012-01-01f -2.104569 -0.494929 1.071804 bar False 2012-01-01h NaN -0.706771 -1.039575 bar True NaTIn [20]: df2.dtypes.value_counts()Out[20]:float64 3bool 1datetime64[ns] 1object 1dtype: int64
Inserting missing data
You can insert missing values by simply assigning to containers. The actual missing value used will be chosen based on the dtype.
For example, numeric containers will always use NaN regardless of
the missing value type chosen:
In [21]: s = pd.Series([1, 2, 3])In [22]: s.loc[0] = NoneIn [23]: sOut[23]:0 NaN1 2.02 3.0dtype: float64
Likewise, datetime containers will always use NaT.
For object containers, pandas will use the value given:
In [24]: s = pd.Series(["a", "b", "c"])In [25]: s.loc[0] = NoneIn [26]: s.loc[1] = np.nanIn [27]: sOut[27]:0 None1 NaN2 cdtype: object
Calculations with missing data
Missing values propagate naturally through arithmetic operations between pandas objects.
In [28]: aOut[28]:one twoa NaN -0.282863c NaN 1.212112e 0.119209 -1.044236f -2.104569 -0.494929h -2.104569 -0.706771In [29]: bOut[29]:one two threea NaN -0.282863 -1.509059c NaN 1.212112 -0.173215e 0.119209 -1.044236 -0.861849f -2.104569 -0.494929 1.071804h NaN -0.706771 -1.039575In [30]: a + bOut[30]:one three twoa NaN NaN -0.565727c NaN NaN 2.424224e 0.238417 NaN -2.088472f -4.209138 NaN -0.989859h NaN NaN -1.413542
The descriptive statistics and computational methods discussed in the data structure overview (and listed here and here) are all written to account for missing data. For example:
- When summing data, NA (missing) values will be treated as zero.
- If the data are all NA, the result will be 0.
- Cumulative methods like
cumsum()andcumprod()ignore NA values by default, but preserve them in the resulting arrays. To override this behaviour and include NA values, useskipna=False.
In [31]: dfOut[31]:one two threea NaN -0.282863 -1.509059c NaN 1.212112 -0.173215e 0.119209 -1.044236 -0.861849f -2.104569 -0.494929 1.071804h NaN -0.706771 -1.039575In [32]: df['one'].sum()Out[32]: -1.9853605075978744In [33]: df.mean(1)Out[33]:a -0.895961c 0.519449e -0.595625f -0.509232h -0.873173dtype: float64In [34]: df.cumsum()Out[34]:one two threea NaN -0.282863 -1.509059c NaN 0.929249 -1.682273e 0.119209 -0.114987 -2.544122f -1.985361 -0.609917 -1.472318h NaN -1.316688 -2.511893In [35]: df.cumsum(skipna=False)Out[35]:one two threea NaN -0.282863 -1.509059c NaN 0.929249 -1.682273e NaN -0.114987 -2.544122f NaN -0.609917 -1.472318h NaN -1.316688 -2.511893
Sum/prod of empties/nans
::: danger Warning
This behavior is now standard as of v0.22.0 and is consistent with the default in numpy; previously sum/prod of all-NA or empty Series/DataFrames would return NaN.
See v0.22.0 whatsnew for more.
:::
The sum of an empty or all-NA Series or column of a DataFrame is 0.
In [36]: pd.Series([np.nan]).sum()Out[36]: 0.0In [37]: pd.Series([]).sum()Out[37]: 0.0
The product of an empty or all-NA Series or column of a DataFrame is 1.
In [38]: pd.Series([np.nan]).prod()Out[38]: 1.0In [39]: pd.Series([]).prod()Out[39]: 1.0
NA values in GroupBy
NA groups in GroupBy are automatically excluded. This behavior is consistent with R, for example:
In [40]: dfOut[40]:one two threea NaN -0.282863 -1.509059c NaN 1.212112 -0.173215e 0.119209 -1.044236 -0.861849f -2.104569 -0.494929 1.071804h NaN -0.706771 -1.039575In [41]: df.groupby('one').mean()Out[41]:two threeone-2.104569 -0.494929 1.0718040.119209 -1.044236 -0.861849
See the groupby section here for more information.
Cleaning / filling missing data
pandas objects are equipped with various data manipulation methods for dealing with missing data.
Filling missing values: fillna
fillna() can “fill in” NA values with non-NA data in a couple
of ways, which we illustrate:
Replace NA with a scalar value
In [42]: df2Out[42]:one two three four five timestampa NaN -0.282863 -1.509059 bar True NaTc NaN 1.212112 -0.173215 bar False NaTe 0.119209 -1.044236 -0.861849 bar True 2012-01-01f -2.104569 -0.494929 1.071804 bar False 2012-01-01h NaN -0.706771 -1.039575 bar True NaTIn [43]: df2.fillna(0)Out[43]:one two three four five timestampa 0.000000 -0.282863 -1.509059 bar True 0c 0.000000 1.212112 -0.173215 bar False 0e 0.119209 -1.044236 -0.861849 bar True 2012-01-01 00:00:00f -2.104569 -0.494929 1.071804 bar False 2012-01-01 00:00:00h 0.000000 -0.706771 -1.039575 bar True 0In [44]: df2['one'].fillna('missing')Out[44]:a missingc missinge 0.119209f -2.10457h missingName: one, dtype: object
Fill gaps forward or backward
Using the same filling arguments as reindexing, we can propagate non-NA values forward or backward:
In [45]: dfOut[45]:one two threea NaN -0.282863 -1.509059c NaN 1.212112 -0.173215e 0.119209 -1.044236 -0.861849f -2.104569 -0.494929 1.071804h NaN -0.706771 -1.039575In [46]: df.fillna(method='pad')Out[46]:one two threea NaN -0.282863 -1.509059c NaN 1.212112 -0.173215e 0.119209 -1.044236 -0.861849f -2.104569 -0.494929 1.071804h -2.104569 -0.706771 -1.039575
Limit the amount of filling
If we only want consecutive gaps filled up to a certain number of data points, we can use the limit keyword:
In [47]: dfOut[47]:one two threea NaN -0.282863 -1.509059c NaN 1.212112 -0.173215e NaN NaN NaNf NaN NaN NaNh NaN -0.706771 -1.039575In [48]: df.fillna(method='pad', limit=1)Out[48]:one two threea NaN -0.282863 -1.509059c NaN 1.212112 -0.173215e NaN 1.212112 -0.173215f NaN NaN NaNh NaN -0.706771 -1.039575
To remind you, these are the available filling methods:
| Method | Action |
|---|---|
| pad / ffill | Fill values forward |
| bfill / backfill | Fill values backward |
With time series data, using pad/ffill is extremely common so that the “last known value” is available at every time point.
ffill() is equivalent to fillna(method='ffill')
and bfill() is equivalent to fillna(method='bfill')
Filling with a PandasObject
You can also fillna using a dict or Series that is alignable. The labels of the dict or index of the Series must match the columns of the frame you wish to fill. The use case of this is to fill a DataFrame with the mean of that column.
In [49]: dff = pd.DataFrame(np.random.randn(10, 3), columns=list('ABC'))In [50]: dff.iloc[3:5, 0] = np.nanIn [51]: dff.iloc[4:6, 1] = np.nanIn [52]: dff.iloc[5:8, 2] = np.nanIn [53]: dffOut[53]:A B C0 0.271860 -0.424972 0.5670201 0.276232 -1.087401 -0.6736902 0.113648 -1.478427 0.5249883 NaN 0.577046 -1.7150024 NaN NaN -1.1578925 -1.344312 NaN NaN6 -0.109050 1.643563 NaN7 0.357021 -0.674600 NaN8 -0.968914 -1.294524 0.4137389 0.276662 -0.472035 -0.013960In [54]: dff.fillna(dff.mean())Out[54]:A B C0 0.271860 -0.424972 0.5670201 0.276232 -1.087401 -0.6736902 0.113648 -1.478427 0.5249883 -0.140857 0.577046 -1.7150024 -0.140857 -0.401419 -1.1578925 -1.344312 -0.401419 -0.2935436 -0.109050 1.643563 -0.2935437 0.357021 -0.674600 -0.2935438 -0.968914 -1.294524 0.4137389 0.276662 -0.472035 -0.013960In [55]: dff.fillna(dff.mean()['B':'C'])Out[55]:A B C0 0.271860 -0.424972 0.5670201 0.276232 -1.087401 -0.6736902 0.113648 -1.478427 0.5249883 NaN 0.577046 -1.7150024 NaN -0.401419 -1.1578925 -1.344312 -0.401419 -0.2935436 -0.109050 1.643563 -0.2935437 0.357021 -0.674600 -0.2935438 -0.968914 -1.294524 0.4137389 0.276662 -0.472035 -0.013960
Same result as above, but is aligning the ‘fill’ value which is a Series in this case.
In [56]: dff.where(pd.notna(dff), dff.mean(), axis='columns')Out[56]:A B C0 0.271860 -0.424972 0.5670201 0.276232 -1.087401 -0.6736902 0.113648 -1.478427 0.5249883 -0.140857 0.577046 -1.7150024 -0.140857 -0.401419 -1.1578925 -1.344312 -0.401419 -0.2935436 -0.109050 1.643563 -0.2935437 0.357021 -0.674600 -0.2935438 -0.968914 -1.294524 0.4137389 0.276662 -0.472035 -0.013960
Dropping axis labels with missing data: dropna
You may wish to simply exclude labels from a data set which refer to missing
data. To do this, use dropna():
In [57]: dfOut[57]:one two threea NaN -0.282863 -1.509059c NaN 1.212112 -0.173215e NaN 0.000000 0.000000f NaN 0.000000 0.000000h NaN -0.706771 -1.039575In [58]: df.dropna(axis=0)Out[58]:Empty DataFrameColumns: [one, two, three]Index: []In [59]: df.dropna(axis=1)Out[59]:two threea -0.282863 -1.509059c 1.212112 -0.173215e 0.000000 0.000000f 0.000000 0.000000h -0.706771 -1.039575In [60]: df['one'].dropna()Out[60]: Series([], Name: one, dtype: float64)
An equivalent dropna() is available for Series.
DataFrame.dropna has considerably more options than Series.dropna, which can be
examined in the API.
Interpolation
New in version 0.23.0: The limit_area keyword argument was added.
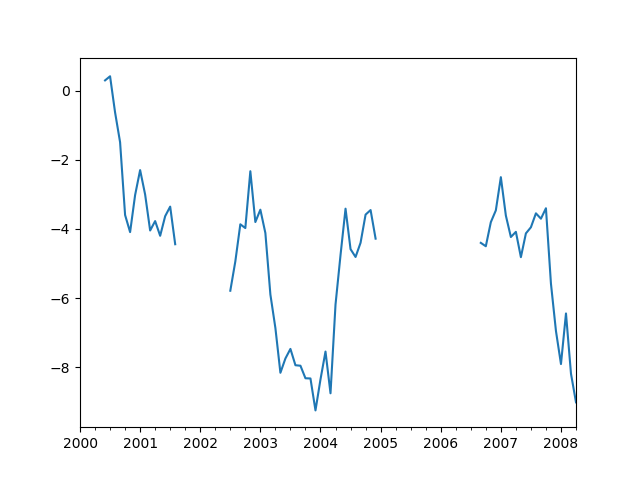
Both Series and DataFrame objects have interpolate()
that, by default, performs linear interpolation at missing data points.
In [61]: tsOut[61]:2000-01-31 0.4691122000-02-29 NaN2000-03-31 NaN2000-04-28 NaN2000-05-31 NaN...2007-12-31 -6.9502672008-01-31 -7.9044752008-02-29 -6.4417792008-03-31 -8.1849402008-04-30 -9.011531Freq: BM, Length: 100, dtype: float64In [62]: ts.count()Out[62]: 66In [63]: ts.plot()Out[63]: <matplotlib.axes._subplots.AxesSubplot at 0x7f65d8ac0eb8>
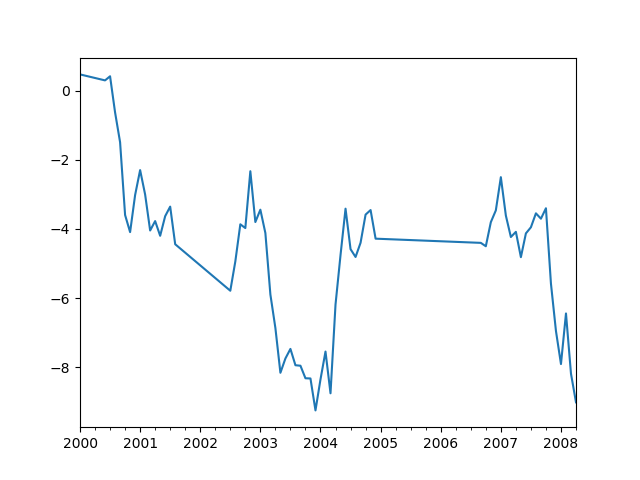
In [64]: ts.interpolate()Out[64]:2000-01-31 0.4691122000-02-29 0.4344692000-03-31 0.3998262000-04-28 0.3651842000-05-31 0.330541...2007-12-31 -6.9502672008-01-31 -7.9044752008-02-29 -6.4417792008-03-31 -8.1849402008-04-30 -9.011531Freq: BM, Length: 100, dtype: float64In [65]: ts.interpolate().count()Out[65]: 100In [66]: ts.interpolate().plot()Out[66]: <matplotlib.axes._subplots.AxesSubplot at 0x7f65d8adfeb8>
Index aware interpolation is available via the method keyword:
In [67]: ts2Out[67]:2000-01-31 0.4691122000-02-29 NaN2002-07-31 -5.7850372005-01-31 NaN2008-04-30 -9.011531dtype: float64In [68]: ts2.interpolate()Out[68]:2000-01-31 0.4691122000-02-29 -2.6579622002-07-31 -5.7850372005-01-31 -7.3982842008-04-30 -9.011531dtype: float64In [69]: ts2.interpolate(method='time')Out[69]:2000-01-31 0.4691122000-02-29 0.2702412002-07-31 -5.7850372005-01-31 -7.1908662008-04-30 -9.011531dtype: float64
For a floating-point index, use method='values':
In [70]: serOut[70]:0.0 0.01.0 NaN10.0 10.0dtype: float64In [71]: ser.interpolate()Out[71]:0.0 0.01.0 5.010.0 10.0dtype: float64In [72]: ser.interpolate(method='values')Out[72]:0.0 0.01.0 1.010.0 10.0dtype: float64
You can also interpolate with a DataFrame:
In [73]: df = pd.DataFrame({'A': [1, 2.1, np.nan, 4.7, 5.6, 6.8],....: 'B': [.25, np.nan, np.nan, 4, 12.2, 14.4]})....:In [74]: dfOut[74]:A B0 1.0 0.251 2.1 NaN2 NaN NaN3 4.7 4.004 5.6 12.205 6.8 14.40In [75]: df.interpolate()Out[75]:A B0 1.0 0.251 2.1 1.502 3.4 2.753 4.7 4.004 5.6 12.205 6.8 14.40
The method argument gives access to fancier interpolation methods.
If you have scipy installed, you can pass the name of a 1-d interpolation routine to method.
You’ll want to consult the full scipy interpolation documentation and reference guide for details.
The appropriate interpolation method will depend on the type of data you are working with.
- If you are dealing with a time series that is growing at an increasing rate,
method='quadratic'may be appropriate. - If you have values approximating a cumulative distribution function,
then
method='pchip'should work well. - To fill missing values with goal of smooth plotting, consider
method='akima'.
::: danger Warning
These methods require scipy.
:::
In [76]: df.interpolate(method='barycentric')Out[76]:A B0 1.00 0.2501 2.10 -7.6602 3.53 -4.5153 4.70 4.0004 5.60 12.2005 6.80 14.400In [77]: df.interpolate(method='pchip')Out[77]:A B0 1.00000 0.2500001 2.10000 0.6728082 3.43454 1.9289503 4.70000 4.0000004 5.60000 12.2000005 6.80000 14.400000In [78]: df.interpolate(method='akima')Out[78]:A B0 1.000000 0.2500001 2.100000 -0.8733162 3.406667 0.3200343 4.700000 4.0000004 5.600000 12.2000005 6.800000 14.400000
When interpolating via a polynomial or spline approximation, you must also specify the degree or order of the approximation:
In [79]: df.interpolate(method='spline', order=2)Out[79]:A B0 1.000000 0.2500001 2.100000 -0.4285982 3.404545 1.2069003 4.700000 4.0000004 5.600000 12.2000005 6.800000 14.400000In [80]: df.interpolate(method='polynomial', order=2)Out[80]:A B0 1.000000 0.2500001 2.100000 -2.7038462 3.451351 -1.4538463 4.700000 4.0000004 5.600000 12.2000005 6.800000 14.400000
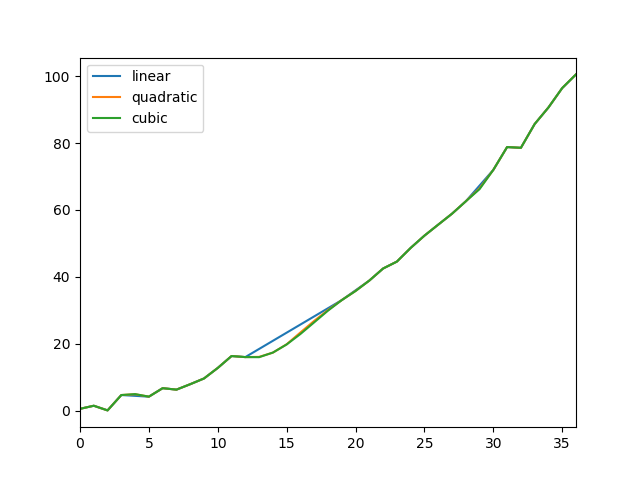
Compare several methods:
In [81]: np.random.seed(2)In [82]: ser = pd.Series(np.arange(1, 10.1, .25) ** 2 + np.random.randn(37))In [83]: missing = np.array([4, 13, 14, 15, 16, 17, 18, 20, 29])In [84]: ser[missing] = np.nanIn [85]: methods = ['linear', 'quadratic', 'cubic']In [86]: df = pd.DataFrame({m: ser.interpolate(method=m) for m in methods})In [87]: df.plot()Out[87]: <matplotlib.axes._subplots.AxesSubplot at 0x7f65d8a196a0>
Another use case is interpolation at new values.
Suppose you have 100 observations from some distribution. And let’s suppose
that you’re particularly interested in what’s happening around the middle.
You can mix pandas’ reindex and interpolate methods to interpolate
at the new values.
In [88]: ser = pd.Series(np.sort(np.random.uniform(size=100)))# interpolate at new_indexIn [89]: new_index = ser.index | pd.Index([49.25, 49.5, 49.75, 50.25, 50.5, 50.75])In [90]: interp_s = ser.reindex(new_index).interpolate(method='pchip')In [91]: interp_s[49:51]Out[91]:49.00 0.47141049.25 0.47684149.50 0.48178049.75 0.48599850.00 0.48926650.25 0.49181450.50 0.49399550.75 0.49576351.00 0.497074dtype: float64
Interpolation limits
Like other pandas fill methods, interpolate() accepts a limit keyword
argument. Use this argument to limit the number of consecutive NaN values
filled since the last valid observation:
In [92]: ser = pd.Series([np.nan, np.nan, 5, np.nan, np.nan,....: np.nan, 13, np.nan, np.nan])....:In [93]: serOut[93]:0 NaN1 NaN2 5.03 NaN4 NaN5 NaN6 13.07 NaN8 NaNdtype: float64# fill all consecutive values in a forward directionIn [94]: ser.interpolate()Out[94]:0 NaN1 NaN2 5.03 7.04 9.05 11.06 13.07 13.08 13.0dtype: float64# fill one consecutive value in a forward directionIn [95]: ser.interpolate(limit=1)Out[95]:0 NaN1 NaN2 5.03 7.04 NaN5 NaN6 13.07 13.08 NaNdtype: float64
By default, NaN values are filled in a forward direction. Use
limit_direction parameter to fill backward or from both directions.
# fill one consecutive value backwardsIn [96]: ser.interpolate(limit=1, limit_direction='backward')Out[96]:0 NaN1 5.02 5.03 NaN4 NaN5 11.06 13.07 NaN8 NaNdtype: float64# fill one consecutive value in both directionsIn [97]: ser.interpolate(limit=1, limit_direction='both')Out[97]:0 NaN1 5.02 5.03 7.04 NaN5 11.06 13.07 13.08 NaNdtype: float64# fill all consecutive values in both directionsIn [98]: ser.interpolate(limit_direction='both')Out[98]:0 5.01 5.02 5.03 7.04 9.05 11.06 13.07 13.08 13.0dtype: float64
By default, NaN values are filled whether they are inside (surrounded by)
existing valid values, or outside existing valid values. Introduced in v0.23
the limit_area parameter restricts filling to either inside or outside values.
# fill one consecutive inside value in both directionsIn [99]: ser.interpolate(limit_direction='both', limit_area='inside', limit=1)Out[99]:0 NaN1 NaN2 5.03 7.04 NaN5 11.06 13.07 NaN8 NaNdtype: float64# fill all consecutive outside values backwardIn [100]: ser.interpolate(limit_direction='backward', limit_area='outside')Out[100]:0 5.01 5.02 5.03 NaN4 NaN5 NaN6 13.07 NaN8 NaNdtype: float64# fill all consecutive outside values in both directionsIn [101]: ser.interpolate(limit_direction='both', limit_area='outside')Out[101]:0 5.01 5.02 5.03 NaN4 NaN5 NaN6 13.07 13.08 13.0dtype: float64
Replacing generic values
Often times we want to replace arbitrary values with other values.
replace() in Series and replace() in DataFrame provides an efficient yet
flexible way to perform such replacements.
For a Series, you can replace a single value or a list of values by another value:
In [102]: ser = pd.Series([0., 1., 2., 3., 4.])In [103]: ser.replace(0, 5)Out[103]:0 5.01 1.02 2.03 3.04 4.0dtype: float64
You can replace a list of values by a list of other values:
In [104]: ser.replace([0, 1, 2, 3, 4], [4, 3, 2, 1, 0])Out[104]:0 4.01 3.02 2.03 1.04 0.0dtype: float64
You can also specify a mapping dict:
In [105]: ser.replace({0: 10, 1: 100})Out[105]:0 10.01 100.02 2.03 3.04 4.0dtype: float64
For a DataFrame, you can specify individual values by column:
In [106]: df = pd.DataFrame({'a': [0, 1, 2, 3, 4], 'b': [5, 6, 7, 8, 9]})In [107]: df.replace({'a': 0, 'b': 5}, 100)Out[107]:a b0 100 1001 1 62 2 73 3 84 4 9
Instead of replacing with specified values, you can treat all given values as missing and interpolate over them:
In [108]: ser.replace([1, 2, 3], method='pad')Out[108]:0 0.01 0.02 0.03 0.04 4.0dtype: float64
String/regular expression replacement
::: tip Note
Python strings prefixed with the r character such as r'hello world'
are so-called “raw” strings. They have different semantics regarding
backslashes than strings without this prefix. Backslashes in raw strings
will be interpreted as an escaped backslash, e.g., r'\' == '\\'. You
should read about them
if this is unclear.
:::
Replace the ‘.’ with NaN (str -> str):
In [109]: d = {'a': list(range(4)), 'b': list('ab..'), 'c': ['a', 'b', np.nan, 'd']}In [110]: df = pd.DataFrame(d)In [111]: df.replace('.', np.nan)Out[111]:a b c0 0 a a1 1 b b2 2 NaN NaN3 3 NaN d
Now do it with a regular expression that removes surrounding whitespace (regex -> regex):
In [112]: df.replace(r'\s*\.\s*', np.nan, regex=True)Out[112]:a b c0 0 a a1 1 b b2 2 NaN NaN3 3 NaN d
Replace a few different values (list -> list):
In [113]: df.replace(['a', '.'], ['b', np.nan])Out[113]:a b c0 0 b b1 1 b b2 2 NaN NaN3 3 NaN d
list of regex -> list of regex:
In [114]: df.replace([r'\.', r'(a)'], ['dot', r'\1stuff'], regex=True)Out[114]:a b c0 0 astuff astuff1 1 b b2 2 dot NaN3 3 dot d
Only search in column 'b' (dict -> dict):
In [115]: df.replace({'b': '.'}, {'b': np.nan})Out[115]:a b c0 0 a a1 1 b b2 2 NaN NaN3 3 NaN d
Same as the previous example, but use a regular expression for searching instead (dict of regex -> dict):
In [116]: df.replace({'b': r'\s*\.\s*'}, {'b': np.nan}, regex=True)Out[116]:a b c0 0 a a1 1 b b2 2 NaN NaN3 3 NaN d
You can pass nested dictionaries of regular expressions that use regex=True:
In [117]: df.replace({'b': {'b': r''}}, regex=True)Out[117]:a b c0 0 a a1 1 b2 2 . NaN3 3 . d
Alternatively, you can pass the nested dictionary like so:
In [118]: df.replace(regex={'b': {r'\s*\.\s*': np.nan}})Out[118]:a b c0 0 a a1 1 b b2 2 NaN NaN3 3 NaN d
You can also use the group of a regular expression match when replacing (dict of regex -> dict of regex), this works for lists as well.
In [119]: df.replace({'b': r'\s*(\.)\s*'}, {'b': r'\1ty'}, regex=True)Out[119]:a b c0 0 a a1 1 b b2 2 .ty NaN3 3 .ty d
You can pass a list of regular expressions, of which those that match will be replaced with a scalar (list of regex -> regex).
In [120]: df.replace([r'\s*\.\s*', r'a|b'], np.nan, regex=True)Out[120]:a b c0 0 NaN NaN1 1 NaN NaN2 2 NaN NaN3 3 NaN d
All of the regular expression examples can also be passed with the
to_replace argument as the regex argument. In this case the value
argument must be passed explicitly by name or regex must be a nested
dictionary. The previous example, in this case, would then be:
In [121]: df.replace(regex=[r'\s*\.\s*', r'a|b'], value=np.nan)Out[121]:a b c0 0 NaN NaN1 1 NaN NaN2 2 NaN NaN3 3 NaN d
This can be convenient if you do not want to pass regex=True every time you
want to use a regular expression.
::: tip Note
Anywhere in the above replace examples that you see a regular expression
a compiled regular expression is valid as well.
:::
Numeric replacement
replace() is similar to fillna().
In [122]: df = pd.DataFrame(np.random.randn(10, 2))In [123]: df[np.random.rand(df.shape[0]) > 0.5] = 1.5In [124]: df.replace(1.5, np.nan)Out[124]:0 10 -0.844214 -1.0214151 0.432396 -0.3235802 0.423825 0.7991803 1.262614 0.7519654 NaN NaN5 NaN NaN6 -0.498174 -1.0607997 0.591667 -0.1832578 1.019855 -1.4824659 NaN NaN
Replacing more than one value is possible by passing a list.
In [125]: df00 = df.iloc[0, 0]In [126]: df.replace([1.5, df00], [np.nan, 'a'])Out[126]:0 10 a -1.021411 0.432396 -0.323582 0.423825 0.799183 1.26261 0.7519654 NaN NaN5 NaN NaN6 -0.498174 -1.06087 0.591667 -0.1832578 1.01985 -1.482479 NaN NaNIn [127]: df[1].dtypeOut[127]: dtype('float64')
You can also operate on the DataFrame in place:
In [128]: df.replace(1.5, np.nan, inplace=True)
::: danger Warning
When replacing multiple bool or datetime64 objects, the first
argument to replace (to_replace) must match the type of the value
being replaced. For example,
>>> s = pd.Series([True, False, True])>>> s.replace({'a string': 'new value', True: False}) # raisesTypeError: Cannot compare types 'ndarray(dtype=bool)' and 'str'
will raise a TypeError because one of the dict keys is not of the
correct type for replacement.
However, when replacing a single object such as,
In [129]: s = pd.Series([True, False, True])In [130]: s.replace('a string', 'another string')Out[130]:0 True1 False2 Truedtype: bool
the original NDFrame object will be returned untouched. We’re working on
unifying this API, but for backwards compatibility reasons we cannot break
the latter behavior. See GH6354 for more details.
:::
Missing data casting rules and indexing
While pandas supports storing arrays of integer and boolean type, these types are not capable of storing missing data. Until we can switch to using a native NA type in NumPy, we’ve established some “casting rules”. When a reindexing operation introduces missing data, the Series will be cast according to the rules introduced in the table below.
| data type | Cast to |
|---|---|
| integer | float |
| boolean | object |
| float | no cast |
| object | no cast |
For example:
In [131]: s = pd.Series(np.random.randn(5), index=[0, 2, 4, 6, 7])In [132]: s > 0Out[132]:0 True2 True4 True6 True7 Truedtype: boolIn [133]: (s > 0).dtypeOut[133]: dtype('bool')In [134]: crit = (s > 0).reindex(list(range(8)))In [135]: critOut[135]:0 True1 NaN2 True3 NaN4 True5 NaN6 True7 Truedtype: objectIn [136]: crit.dtypeOut[136]: dtype('O')
Ordinarily NumPy will complain if you try to use an object array (even if it contains boolean values) instead of a boolean array to get or set values from an ndarray (e.g. selecting values based on some criteria). If a boolean vector contains NAs, an exception will be generated:
In [137]: reindexed = s.reindex(list(range(8))).fillna(0)In [138]: reindexed[crit]---------------------------------------------------------------------------ValueError Traceback (most recent call last)<ipython-input-138-0dac417a4890> in <module>----> 1 reindexed[crit]/pandas/pandas/core/series.py in __getitem__(self, key)1101 key = list(key)1102-> 1103 if com.is_bool_indexer(key):1104 key = check_bool_indexer(self.index, key)1105/pandas/pandas/core/common.py in is_bool_indexer(key)128 if not lib.is_bool_array(key):129 if isna(key).any():--> 130 raise ValueError(na_msg)131 return False132 return TrueValueError: cannot index with vector containing NA / NaN values
However, these can be filled in using fillna() and it will work fine:
In [139]: reindexed[crit.fillna(False)]Out[139]:0 0.1265042 0.6961984 0.6974166 0.6015167 0.003659dtype: float64In [140]: reindexed[crit.fillna(True)]Out[140]:0 0.1265041 0.0000002 0.6961983 0.0000004 0.6974165 0.0000006 0.6015167 0.003659dtype: float64
Pandas provides a nullable integer dtype, but you must explicitly request it
when creating the series or column. Notice that we use a capital “I” in
the dtype="Int64".
In [141]: s = pd.Series([0, 1, np.nan, 3, 4], dtype="Int64")In [142]: sOut[142]:0 01 12 NaN3 34 4dtype: Int64
See Nullable integer data type for more.

若有收获,就点个赞吧
0 人点赞
