1.ELK介绍
(1)应用/需求前景
业务发展越来越庞大,服务器越来越多
各种访问日志、应用日志、错误日志量越来越多,导致运维人员无法很好的去管理日志
开发人员排查问题,需要到服务器上查日志,不方便
运营人员需要一些数据,需要我们运维到服务器上分析日志
(2)为什么要用ELK:
如果我们查看某些服务为什么错误,可以直接使用grep等命令进行查看,可是如果我们查看规模较大,日志较多的时候,此方法效率就小了很多。现在我们对待大规模的日志,解决思路是建立集中式日志收集系统,将所有节点上的日志统一收集,管理,访问。
一个完整的集中式日志系统,需要包含以下几个主要特点:
l 收集-能够采集多种来源的日志数据
l 传输-能够稳定的把日志数据传输到中央系统
l 存储-如何存储日志数据
l 分析-可以支持 UI 分析
l 警告-能够提供错误报告,监控机制
而ELK则提供一整套的解决方案,并且都是开源软件,之间相互配合,完美衔接,高效的满足了很多场合的应用。
(3)简介
ELK是三个开源软件的缩写,分别为:Elasticsearch 、 Logstash以及Kibana , 它们都是开源软件。不过现在还新增了一个Beats,它是一个轻量级的日志收集处理工具(Agent),Beats占用资源少,适合于在各个服务器上搜集日志后传输给Logstash,官方也推荐此工具,目前由于原本的ELK Stack成员中加入了 Beats 工具所以已改名为Elastic Stack。
Elasticsearch是个开源分布式搜索引擎,提供搜集、分析、存储数据三大功能。它的特点有:分布式,零配置,自动发现,索引自动分片,索引副本机制,restful风格接口,多数据源,自动搜索负载等
Logstash 主要是用来日志的搜集、分析、过滤日志的工具,支持大量的数据获取方式。一般工作方式为c/s架构,client端安装在需要收集日志的主机上,server端负责将收到的各节点日志进行过滤、修改等操作在一并发往elasticsearch上去。
Kibana 也是一个开源和免费的工具,Kibana可以为 Logstash 和 ElasticSearch 提供的日志分析友好的 Web 界面,可以帮助汇总、分析和搜索重要数据日志。
Beats在这里是一个轻量级日志采集器,其实Beats家族有6个成员,早期的ELK架构中使用Logstash收集、解析日志,但是Logstash对内存、cpu、io等资源消耗比较高。相比 Logstash,Beats所占系统的CPU和内存几乎可以忽略不计
(4)环境准备:
1主节点10,2个数据节点20,30。3台机器全部安装jdk8(openjdk即可)
Yum install -y java-1.8.0-openjdk
192.168.16.10 elasticsearch+kibana ELK-1
192.168.16.20 elasticsearch+logstash ELK-2
192.168.16.30 elasticsearch ELK-3
2.基础环境配置:
(1)修改主机名:
使用hostnamectl命令修改3个主机名,以做区分
elk-1节点
[root@localhost ~]# hostnamectl set-hostname elk-1[root@localhost ~]# bash[root@elk-1 ~]#
elk-2节点
[root@localhost ~]# hostnamectl set-hostname elk-2[root@localhost ~]# bash[root@elk-2 ~]#
elk-3节点
[root@localhost ~]# hostnamectl set-hostname elk-3[root@localhost ~]# bash[root@elk-3 ~]#
(2)配置hosts文件
3个节点配置相同(以elk-1节点为例),命令如下:
elk-1节点:
[root@elk-1 ~]# vi /etc/hosts127.0.0.1 localhost localhost.localdomain localhost4 localhost4.localdomain4::1 localhost localhost.localdomain localhost6 localhost6.localdomain6192.168.200.40 elk-1192.168.200.50 elk-2192.168.200.60 elk-3[root@elk-1 ~]# scp -r /etc/hosts 192.168.200.50:/etc/hosts[root@elk-1 ~]# scp -r /etc/hosts 192.168.200.60:/etc/hosts
(3)安装jdk
部署ELK环境需要jdk1.8以上的JDK版本软件环境,我们使用opnejdk1.8,3节点全部安装(以elk-1节点为例),命令如下:
elk-1节点:
[root@elk-1 ~]# yum install -y java-1.8.0-openjdk java-1.8.0-openjdk-devel[root@elk-1 ~]# java -versionopenjdk version "1.8.0_161"OpenJDK Runtime Environment (build 1.8.0_161-b14)OpenJDK 64-Bit Server VM (build 25.161-b14, mixed mode)
3.elasticserach安装


(1)安装es
将提供的rpm包上传至3台节点的/root/目录下,或者上传至一节点后使用scp进行copy,之后使用rpm语句进行安装,3节点全部安装:
Scp复制命令:
[root@elk-1 ~]# lsanaconda-ks.cfg kibana-6.0.0-x86_64.rpmelasticsearch-6.0.0.rpm logstash-6.0.0.rpm[root@elk-1 ~]# scp elasticsearch-6.0.0.rpm elk-2:/root/# scp 文件 复制到的主机名:目录The authenticity of host 'elk-2 (192.168.200.50)' can't be established.ECDSA key fingerprint is SHA256:eo+REDKW87olHe7Udg2eNtNzDrumPPwnjpBKYf7SiPg.ECDSA key fingerprint is MD5:54:4d:16:9c:eb:11:bc:42:87:a6:1f:27:a5:3e:5a:72.Are you sure you want to continue connecting (yes/no)? yes#第一次连接会询问你确定连接?第二次连接就会只让你输入密码。Warning: Permanently added 'elk-2,192.168.200.50' (ECDSA) to the list of known hosts.root@elk-2's password:elasticsearch-6.0.0.rpm 100% 27MB 111.9MB/s 00:00[root@elk-1 ~]# scp elasticsearch-6.0.0.rpm elk-3:/root/The authenticity of host 'elk-3 (192.168.200.60)' can't be established.ECDSA key fingerprint is SHA256:eo+REDKW87olHe7Udg2eNtNzDrumPPwnjpBKYf7SiPg.ECDSA key fingerprint is MD5:54:4d:16:9c:eb:11:bc:42:87:a6:1f:27:a5:3e:5a:72.Are you sure you want to continue connecting (yes/no)? yesWarning: Permanently added 'elk-3,192.168.200.60' (ECDSA) to the list of known hosts.root@elk-3's password:elasticsearch-6.0.0.rpm 100% 27MB 114.8MB/s 00:00[root@elk-1 ~]#
elk-2/3节点查看是否复制过去:
[root@elk-2 ~]# lsanaconda-ks.cfg elasticsearch-6.0.0.rpm[root@elk-3 ~]# lsanaconda-ks.cfg elasticsearch-6.0.0.rpm
elk-1节点:
[root@elk-1 ~]# rpm -ivh elasticsearch-6.0.0.rpm#i表示安装,v表示显示安装过程,h表示显示进度warning: elasticsearch-6.0.0.rpm: Header V4 RSA/SHA512 Signature, key ID d88e42b4: NOKEYPreparing... ################################# [100%]Creating elasticsearch group... OKCreating elasticsearch user... OKUpdating / installing...1:elasticsearch-0:6.0.0-1 ################################# [100%]### NOT starting on installation, please execute the following statements to configure elasticsearch service to start automatically using systemdsudo systemctl daemon-reloadsudo systemctl enable elasticsearch.service### You can start elasticsearch service by executingsudo systemctl start elasticsearch.service
elk-2节点:
[root@elk-2 ~]# rpm -ivh elasticsearch-6.0.0.rpmwarning: elasticsearch-6.0.0.rpm: Header V4 RSA/SHA512 Signature, key ID d88e42b4: NOKEYPreparing... ################################# [100%]Creating elasticsearch group... OKCreating elasticsearch user... OKUpdating / installing...1:elasticsearch-0:6.0.0-1 ################################# [100%]### NOT starting on installation, please execute the following statements to configure elasticsearch service to start automatically using systemdsudo systemctl daemon-reloadsudo systemctl enable elasticsearch.service### You can start elasticsearch service by executingsudo systemctl start elasticsearch.service
elk-3节点:
[root@elk-3 ~]# rpm -ivh elasticsearch-6.0.0.rpmwarning: elasticsearch-6.0.0.rpm: Header V4 RSA/SHA512 Signature, key ID d88e42b4: NOKEYPreparing... ################################# [100%]Creating elasticsearch group... OKCreating elasticsearch user... OKUpdating / installing...1:elasticsearch-0:6.0.0-1 ################################# [100%]### NOT starting on installation, please execute the following statements to configure elasticsearch service to start automatically using systemdsudo systemctl daemon-reloadsudo systemctl enable elasticsearch.service### You can start elasticsearch service by executingsudo systemctl start elasticsearch.service
(2)配置es
配置elasticsearch的配置文件,配置文件在/etc/elasticsearch/elasticsearch.yml
Elk-1节点:增加以下红色字样(//为解释,这里用不到的配置文件被删除),注意IP
[root@elk-1 ~]# vi /etc/elasticsearch/elasticsearch.yml
[root@elk-1 ~]# cat /etc/elasticsearch/elasticsearch.yml
# ======= Elasticsearch Configuration ===========
#
# NOTE: Elasticsearch comes with reasonable defaults for most settings.
# Before you set out to tweak and tune the configuration, make sure you
# understand what are you trying to accomplish and the consequences.
#
# The primary way of configuring a node is via this file. This template lists
# the most important settings you may want to configure for a production cluster.
#
# Please consult the documentation for further information on configuration options:
# https://www.elastic.co/guide/en/elasticsearch/reference/index.html
#
# —————————Cluster ——————————
# Use a descriptive name for your cluster:
cluster.name: ELK //配置es的集群名称,默认是elasticsearch,es会自动发现在同一网段下的es,如果在同一网段下有多个集群,就可以用这个属性来区分不同的集群。
# ————————————Node ————————-
# Use a descriptive name for the node:
node.name: elk-1 //节点名,默认随机指定一个name列表中名字,该列表在es的jar包中config文件夹里name.txt文件中,其中有很多作者添加的有趣名字。
node.master: true //指定该节点是否有资格被选举成为node,默认是true,es是默认集群中的第一台机器为master,如果这台机挂了就会重新选举master。 其他两节点为false
node.data: false //指定该节点是否存储索引数据,默认为true。其他两节点为true
# ————————- Paths ————————
# Path to directory where to store the data (separate multiple locations by comma):
path.data: /var/lib/elasticsearch //索引数据存储位置(保持默认,不要开启注释)
# Path to log files:
path.logs: /var/log/elasticsearch //设置日志文件的存储路径,默认是es根目录下的logs文件夹
# ———————- Network —————————
# Set the bind address to a specific IP (IPv4 or IPv6):
network.host: 192.168.200.40 //设置绑定的ip地址,可以是ipv4或ipv6的,默认为0.0.0.0。
# Set a custom port for HTTP:
http.port: 9200 //启动的es对外访问的http端口,默认9200
# For more information, consult the network module documentation.
# ——————————Discovery ————————
# Pass an initial list of hosts to perform discovery when new node is started:
# The default list of hosts is [“127.0.0.1”, “[::1]”]
#discovery.zen.ping.unicast.hosts: [“host1”, “host2”]
discovery.zen.ping.unicast.hosts: [“elk-1”,”elk-2”,”elk-3”] //设置集群中master节点的初始列表,可以通过这些节点来自动发现新加入集群的节点。
Elk-2节点:
[root@elk-2 ~]# vi /etc/elasticsearch/elasticsearch.yml[root@elk-2 ~]# cat /etc/elasticsearch/elasticsearch.yml |grep -v ^# |grep -v ^$cluster.name: ELKnode.name: elk-2node.master: falsenode.data: truepath.data: /var/lib/elasticsearchpath.logs: /var/log/elasticsearchnetwork.host: 192.168.200.50http.port: 9200discovery.zen.ping.unicast.hosts: ["elk-1","elk-2","elk-3"]
Elk-3节点:
[root@elk-2 ~]# vi /etc/elasticsearch/elasticsearch.yml[root@elk-2 ~]# cat /etc/elasticsearch/elasticsearch.yml |grep -v ^# |grep -v ^$cluster.name: ELKnode.name: elk-3node.master: falsenode.data: truepath.data: /var/lib/elasticsearchpath.logs: /var/log/elasticsearchnetwork.host: 192.168.200.60http.port: 9200discovery.zen.ping.unicast.hosts: ["elk-1","elk-2","elk-3"]
(3)启动服务
通过命令启动es服务,启动后使用ps命令查看进程是否存在或者使用netstat命令查看是否端口启动。命令如下:(3个节点命令相同)
[root@elk-1 ~]# systemctl start elasticsearch[root@elk-1 ~]# ps -ef |grep elasticsearchelastic+ 11552 1 62 21:44 ? 00:00:09 /bin/java -Xms1g -Xmx1g -XX:+UseConcMarkSweepGC -XX:CMSInitiatingOccupancyFraction=75 -XX:+UseCMSInitiatingOccupancyOnly -XX:+AlwaysPreTouch -server -Xss1m -Djava.awt.headless=true -Dfile.encoding=UTF-8 -Djna.nosys=true -XX:-OmitStackTraceInFastThrow -Dio.netty.noUnsafe=true -Dio.netty.noKeySetOptimization=true -Dio.netty.recycler.maxCapacityPerThread=0 -Dlog4j.shutdownHookEnabled=false -Dlog4j2.disable.jmx=true -XX:+HeapDumpOnOutOfMemoryError -XX:HeapDumpPath=/var/lib/elasticsearch -Des.path.home=/usr/share/elasticsearch -Des.path.conf=/etc/elasticsearch -cp /usr/share/elasticsearch/lib/* org.elasticsearch.bootstrap.Elasticsearch -p /var/run/elasticsearch/elasticsearch.pid --quietroot 11614 1519 0 21:44 pts/0 00:00:00 grep --color=auto elasticsearch
[root@elk-1 ~]# netstat -lntp
Active Internet connections (only servers)
Proto Recv-Q Send-Q Local Address Foreign Address State PID/Program name
tcp 0 0 0.0.0.0:22 0.0.0.0: LISTEN 916/sshd
tcp 0 0 127.0.0.1:25 0.0.0.0: LISTEN 1123/master
tcp6 0 0 192.168.200.40:9200 ::: LISTEN 11552/java
tcp6 0 0 192.168.200.40:9300 ::: LISTEN 11552/java
tcp6 0 0 :::21 ::: LISTEN 1433/vsftpd
tcp6 0 0 :::22 ::: LISTEN 916/sshd
tcp6 0 0 ::1:25 :::* LISTEN 1123/master
有以上端口或者进程存在,证明es服务启动成功。
(4)检测集群状态
通过curl ‘IP:9200/_cluster/health?pretty’ 来检查集群状态,命令如下
Elk-1节点:
[root@elk-1 ~]# curl '192.168.200.40:9200/_cluster/health?pretty'{"cluster_name" : "ELK","status" : "green", //为green则代表健康没问题,yellow或者red 则是集群有问题"timed_out" : false, //是否有超时"number_of_nodes" : 3, //集群中的节点数量"number_of_data_nodes" : 2, //集群中data节点的数量"active_primary_shards" : 0,"active_shards" : 0,"relocating_shards" : 0,"initializing_shards" : 0,"unassigned_shards" : 0,"delayed_unassigned_shards" : 0,"number_of_pending_tasks" : 0,"number_of_in_flight_fetch" : 0,"task_max_waiting_in_queue_millis" : 0,"active_shards_percent_as_number" : 100.0}
4.部署kibana
(1)安装kibana
通过scrt把kibana的rpm包上传至elk-1节点的root的目录下。其他节点不需上传。
[root@elk-1 ~]# rpm -ivh kibana-6.0.0-x86_64.rpmwarning: kibana-6.0.0-x86_64.rpm: Header V4 RSA/SHA512 Signature, key ID d88e42b4: NOKEYPreparing... ################################# [100%]Updating / installing...1:kibana-6.0.0-1 ################################# [100%]
(2)配置kibana
配置kibana的配置文件,配置文件在/etc/kibana/kibana.yml,在配置文件增加或修改以下内容:
[root@elk-1 ~]# vi /etc/kibana/kibana.yml[root@elk-1 ~]# cat /etc/kibana/kibana.yml |grep -v ^#server.port: 5601server.host: 192.168.200.40elasticsearch.url: "http://192.168.200.40:9200"
(3)启动kibana
[root@elk-1 ~]# systemctl start kibana[root@elk-1 ~]# ps -ef |grep kibanakibana 11764 1 37 22:01 ? 00:00:02 /usr/share/kibana/bin/../node/bin/node --no-warnings /usr/share/kibana/bin/../src/cli -c /etc/kibana/kibana.ymlroot 11777 1519 0 22:01 pts/0 00:00:00 grep --color=auto kibana[root@elk-1 ~]# netstat -lntp |grep nodetcp 0 0 192.168.200.40:5601 0.0.0.0:* LISTEN 11764/node
启动成功后网页访问,可以访问到如下界面。
192.168.200.40:5601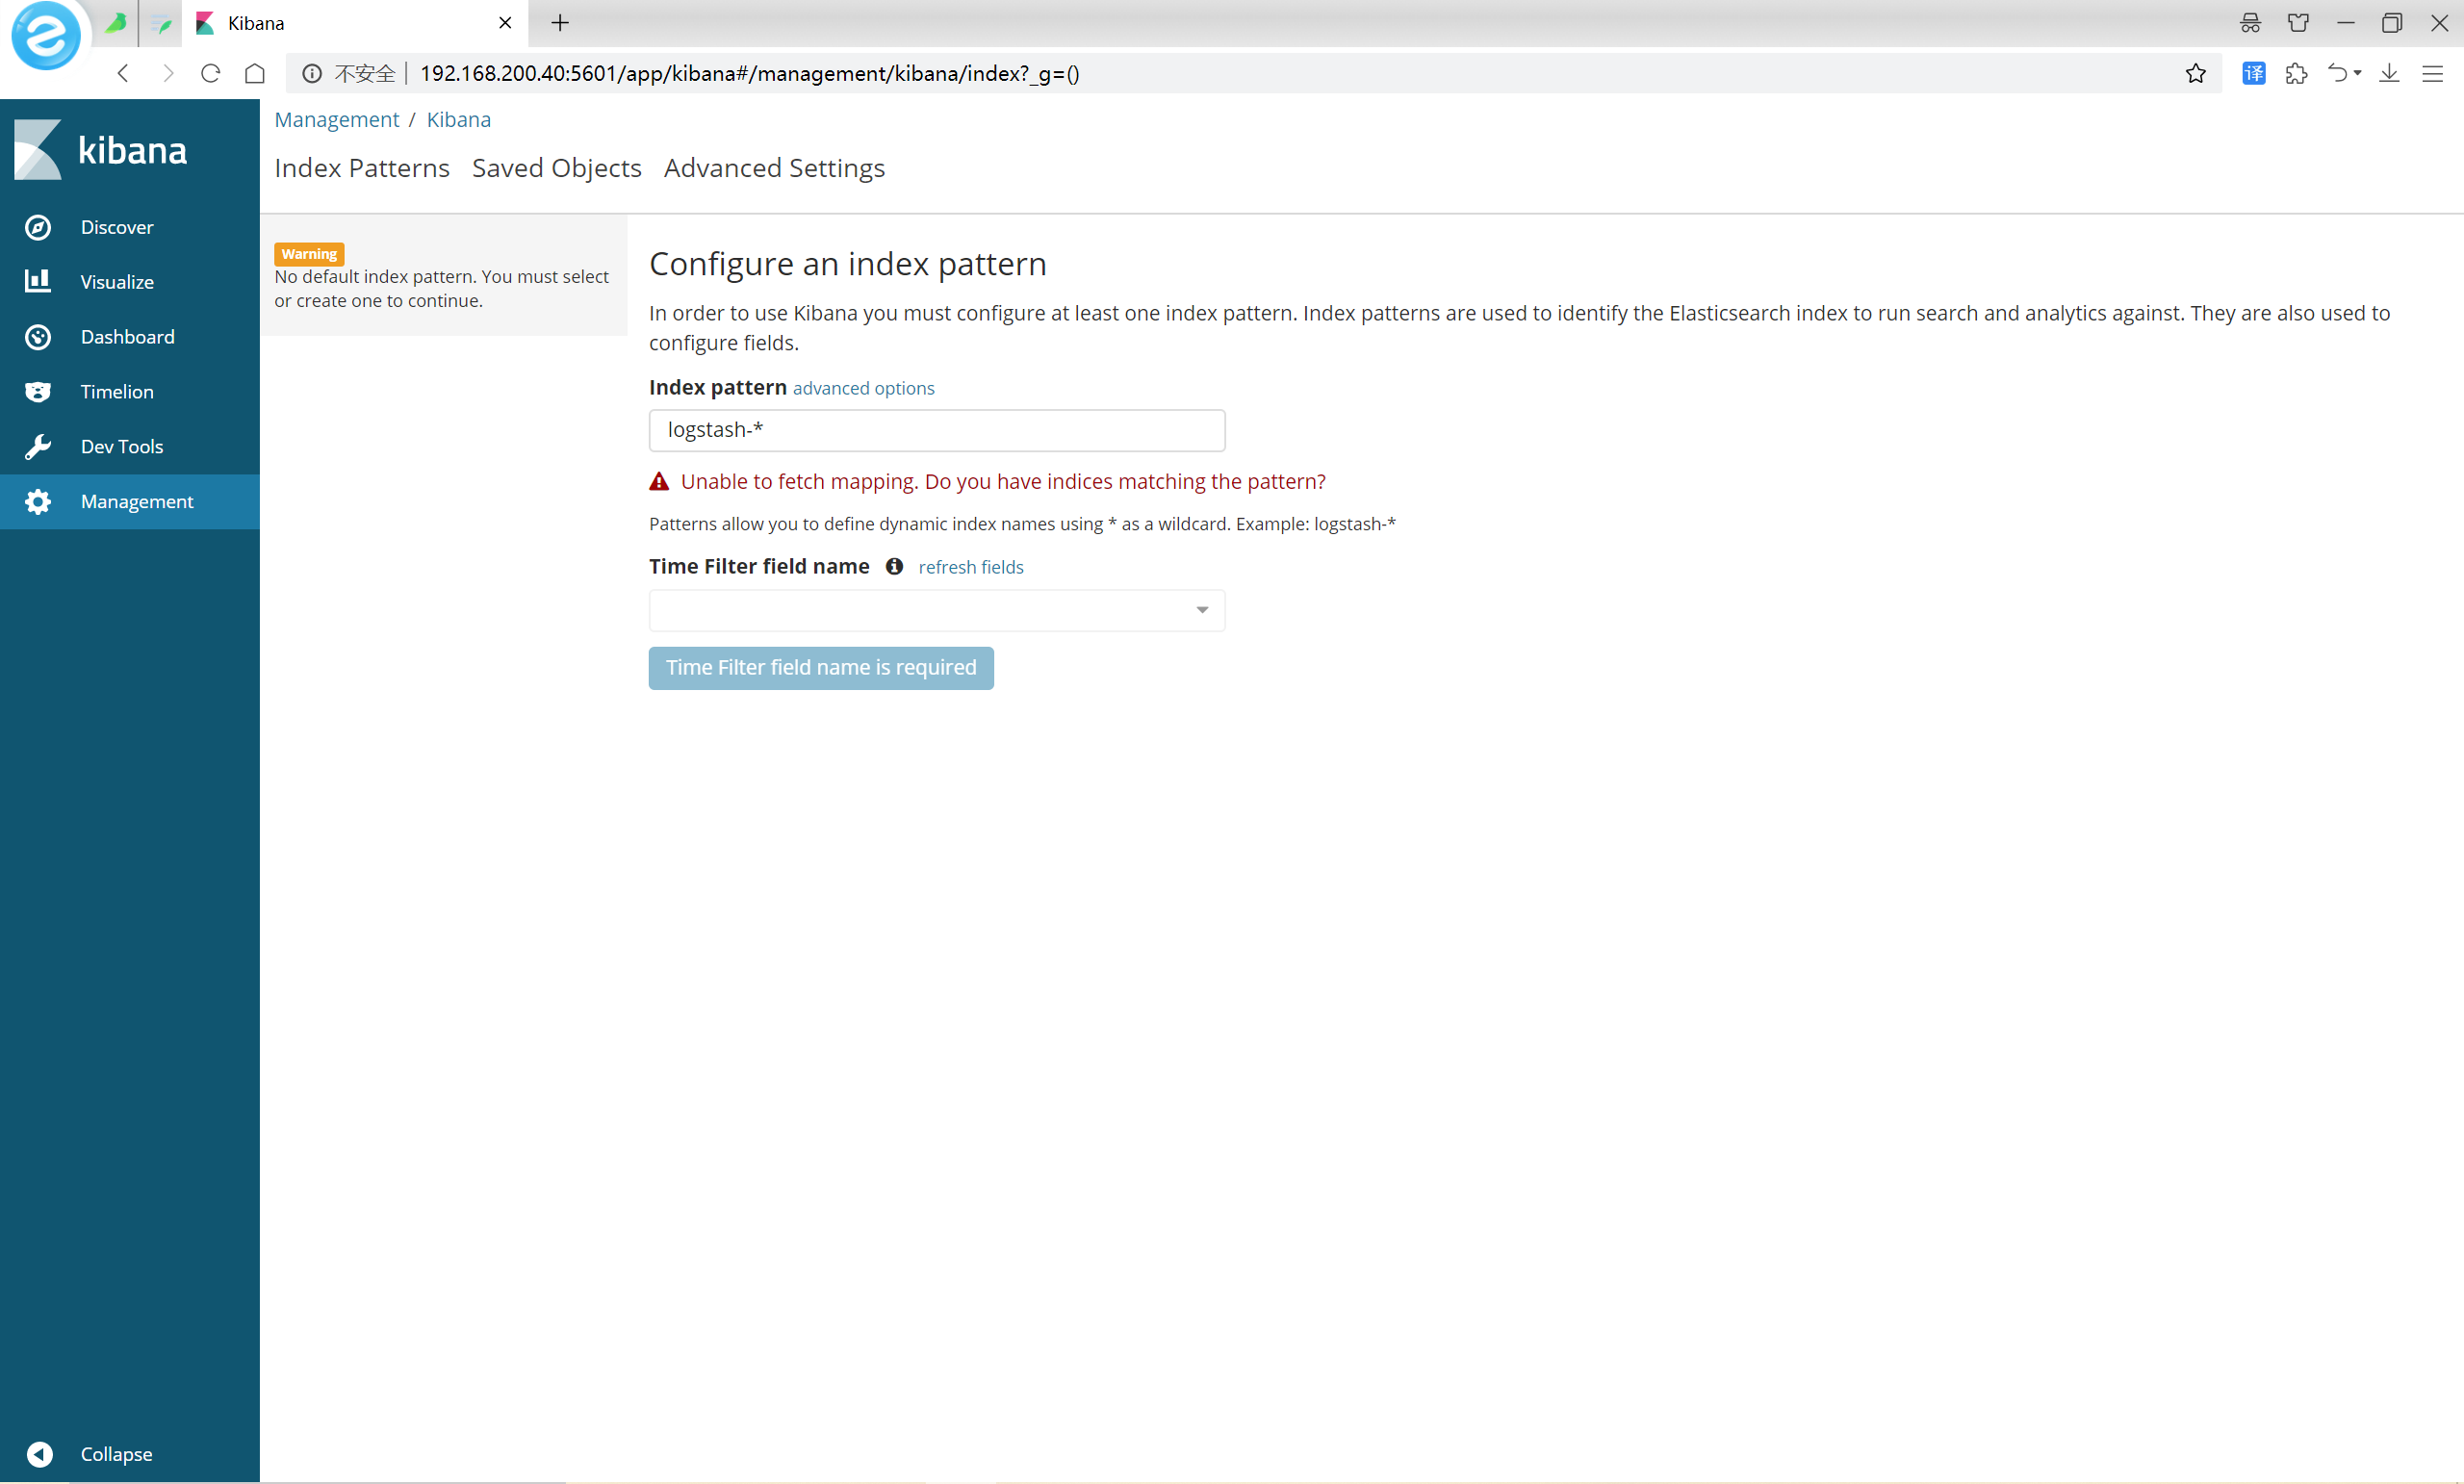
5.Logstash部署:
(1)安装logstash
通过scrt把kibana的rpm包上传至elk-2节点的root的目录下。其他节点不需上传。
[root@elk-2 ~]# rpm -ivh logstash-6.0.0.rpmwarning: logstash-6.0.0.rpm: Header V4 RSA/SHA512 Signature, key ID d88e42b4: NOKEYPreparing... ################################# [100%]Updating / installing...1:logstash-1:6.0.0-1 ################################# [100%]which: no java in (/sbin:/bin:/usr/sbin:/usr/bin:/usr/X11R6/bin)could not find java; set JAVA_HOME or ensure java is in PATHwarning: %post(logstash-1:6.0.0-1.noarch) scriptlet failed, exit status 1
(2)配置logstash
配置/etc/logstash/logstash.yml,修改增加如下:
[root@elk-2 ~]# vi /etc/logstash/logstash.ymlhttp.host: "192.168.200.50"
配置logstash收集syslog日志
[root@elk-2 ~]# vi /etc/logstash/conf.d/syslog.conf
[root@elk-2 ~]# cat /etc/logstash/conf.d/syslog.conf
input { //定义日志源
file {
path => “/var/log/messages” //定义日志来源路径 目录要给644权限,不然无法读取日志
type => “systemlog” //定义类型
start_position => “beginning”
stat_interval => “3”
}
}
output { //定义日志输出
if [type] == “systemlog” {
elasticsearch {
hosts => [“192.168.200.40:9200”]
index => “system-log-%{+YYYY.MM.dd}”
}
}
}
上边的忽略写下面的
input {
syslog {
type => “systemlog”
port => 10514
}
}
output {
stdout {
codec => rubydebug
}
}
检测配置文件是否错误:
[root@elk-2 ~]# ln -s /usr/share/logstash/bin/logstash /usr/bin #创建软连接,方便使用logstash命令[root@elk-2 ~]# logstash --path.settings /etc/logstash/ -f /etc/logstash/conf.d/syslog.conf --config.test_and_exitSending Logstash's logs to /var/log/logstash which is now configured via log4j2.propertiesConfiguration OK//为ok则代表没问题
l —path.settings 用于指定logstash的配置文件所在的目录
l -f 指定需要被检测的配置文件的路径
l —config.test_and_exit 指定检测完之后就退出,不然就会直接启动了
(3)启动logstash
检查配置文件没有问题后启动logstash服务,
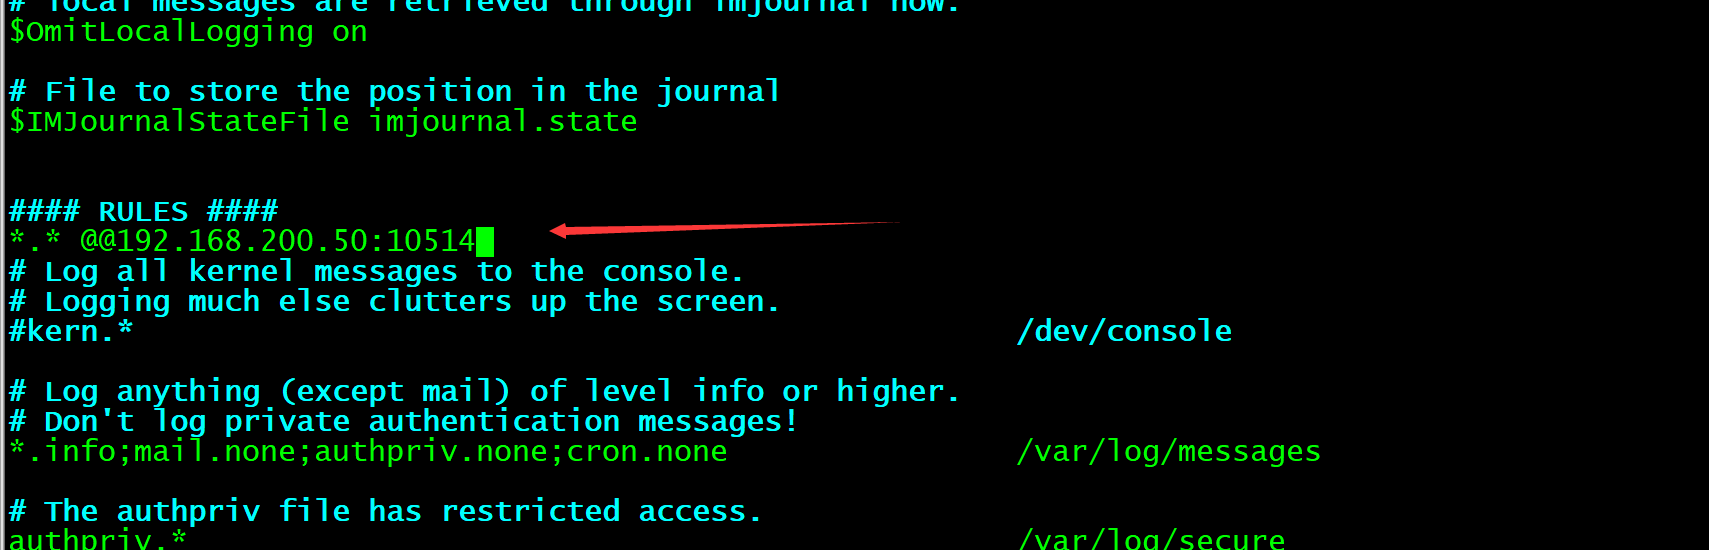
[root@elk-2 ~]# vi /etc/rsyslog.conf在#### RULES ####增加一行*.* @@192.168.200.50:10514[root@elk-2 ~]# systemctl start logstash
查看进程ps
[root@elk-2 ~]# yum install -y policycoreutils-python[root@elk-2 ~]# semanage port -l | grep syslogsyslog_tls_port_t tcp 6514, 10514syslog_tls_port_t udp 6514, 10514syslogd_port_t tcp 601, 20514syslogd_port_t udp 514, 601, 20514[root@elk-2 ~]# ps -ef |grep logstashlogstash 2886 1 99 23:43 ? 00:00:09 /bin/java -XX:+UseParNewGC -XX:+UseConcMarkSweepGC -XX:CMSInitiatingOccupancyFraction=75 -XX:+UseCMSInitiatingOccupancyOnly -XX:+DisableExplicitGC -Djava.awt.headless=true -Dfile.encoding=UTF-8 -XX:+HeapDumpOnOutOfMemoryError -Xmx1g -Xms256m -Xss2048k -Djffi.boot.library.path=/usr/share/logstash/vendor/jruby/lib/jni -Xbootclasspath/a:/usr/share/logstash/vendor/jruby/lib/jruby.jar -classpath : -Djruby.home=/usr/share/logstash/vendor/jruby -Djruby.lib=/usr/share/logstash/vendor/jruby/lib -Djruby.script=jruby -Djruby.shell=/bin/sh org.jruby.Main /usr/share/logstash/lib/bootstrap/environment.rb logstash/runner.rb --path.settings /etc/logstashroot 2919 1793 0 23:43 pts/0 00:00:00 grep --color=auto logstash
查看端口netstat -lntp
[root@elk-2 ~]# netstat -lntp
Active Internet connections (only servers)
Proto Recv-Q Send-Q Local Address Foreign Address State PID/Program name
tcp 0 0 0.0.0.0:22 0.0.0.0: LISTEN 1443/sshd
tcp 0 0 127.0.0.1:25 0.0.0.0: LISTEN 2009/master
tcp6 0 0 192.168.16.20:9200 ::: LISTEN 19365/java
tcp6 0 0 :::10514 ::: LISTEN 21835/java
tcp6 0 0 192.168.16.20:9300 ::: LISTEN 19365/java
tcp6 0 0 :::22 ::: LISTEN 1443/sshd
tcp6 0 0 ::1:25 ::: LISTEN 2009/master
tcp6 0 0 192.168.16.20:9600 ::: LISTEN 21835/java
启动服务后,有进程但是没有端口的问题解决:
[root@elk-2 ~]# cat /var/log/logstash/logstash-plain.log[2021-10-27T23:39:43,550][INFO ][logstash.modules.scaffold] Initializing module {:module_name=>"fb_apache", :directory=>"/usr/share/logstash/modules/fb_apache/configuration"}[2021-10-27T23:39:43,554][INFO ][logstash.modules.scaffold] Initializing module {:module_name=>"netflow", :directory=>"/usr/share/logstash/modules/netflow/configuration"}[2021-10-27T23:39:43,575][INFO ][logstash.setting.writabledirectory] Creating directory {:setting=>"path.queue", :path=>"/var/lib/logstash/queue"}[2021-10-27T23:39:43,575][INFO ][logstash.setting.writabledirectory] Creating directory {:setting=>"path.dead_letter_queue", :path=>"/var/lib/logstash/dead_letter_queue"}[2021-10-27T23:39:43,701][WARN ][logstash.config.source.multilocal] Ignoring the 'pipelines.yml' file because modules or command line options are specified[2021-10-27T23:39:44,083][INFO ][logstash.runner ] Using config.test_and_exit mode. Config Validation Result: OK. Exiting Logstash
权限问题,因为之前我们以root的身份在终端启动过logstash,所以产生的相关文件的属组属主都是root
[root@elk-2 ~]# ll /var/lib/logstash/total 0drwxr-xr-x 2 root root 6 Oct 27 23:39 dead_letter_queuedrwxr-xr-x 2 root root 6 Oct 27 23:39 queue[root@elk-2 ~]# chown -R logstash /var/lib/logstash/[root@elk-2 ~]# systemctl restart logstash #重启服务后即可[root@elk-2 ~]# netstat -ntplActive Internet connections (only servers)Proto Recv-Q Send-Q Local Address Foreign Address State PID/Program nametcp 0 0 0.0.0.0:22 0.0.0.0:* LISTEN 919/sshdtcp 0 0 127.0.0.1:25 0.0.0.0:* LISTEN 1118/mastertcp6 0 0 127.0.0.1:9600 :::* LISTEN 3315/javatcp6 0 0 192.168.200.50:9200 :::* LISTEN 1928/javatcp6 0 0 192.168.200.50:9300 :::* LISTEN 1928/javatcp6 0 0 :::22 :::* LISTEN 919/sshdtcp6 0 0 ::1:25 :::* LISTEN 1118/master
启动完毕后,让syslog产生日志,用第三台主机登录elk-2机器,登录后退出。
//赋予权限[root@elk-2 ~]# chmod 644 /var/log/messages[root@elk-3 ~]# ssh 192.168.200.50root@192.168.200.50's password:Last login: Wed Oct 27 23:52:19 2021 from elk-3[root@elk-2 ~]#
6.完善
(1)kibana上查看日志
之前部署kibana完成后,还没有检索日志。现在logstash部署完成,我们回到kibana服务器上查看日志索引,执行命令如下:
[root@elk-1 ~]# curl '192.168.200.40:9200/_cat/indices?v'health status index uuid pri rep docs.count docs.deleted store.size pri.store.sizeyellow open .kibana PnwoaYBqQmWB_uk2v4oKtQ 1 1 1 0 3.6kb 3.6kbyellow open system-log-2021.10.28 1mG-v4n9QtW1xgCeW4QboA 5 1 17798 0 3.5mb 3.5mb
获取/删除指定索引详细信息(system-log-2019.12.06是你使用上条命令查出的结果)
[root@elk-1 ~]# curl -XGET/DELETE '192.168.200.40:9200/system-log-2021.10.28?pretty'{"system-log-2021.10.28" : {"aliases" : { },"mappings" : {"systemlog" : {"properties" : {"@timestamp" : {"type" : "date"},"@version" : {"type" : "text","fields" : {"keyword" : {"type" : "keyword","ignore_above" : 256}}},"host" : {"type" : "text","fields" : {"keyword" : {"type" : "keyword","ignore_above" : 256}}},"message" : {"type" : "text","fields" : {"keyword" : {"type" : "keyword","ignore_above" : 256}}},"path" : {"type" : "text","fields" : {"keyword" : {"type" : "keyword","ignore_above" : 256}}},"type" : {"type" : "text","fields" : {"keyword" : {"type" : "keyword","ignore_above" : 256}}}}}},"settings" : {"index" : {"creation_date" : "1635393263613","number_of_shards" : "5","number_of_replicas" : "1","uuid" : "1mG-v4n9QtW1xgCeW4QboA","version" : {"created" : "6000099"},"provided_name" : "system-log-2021.10.28"}}}}
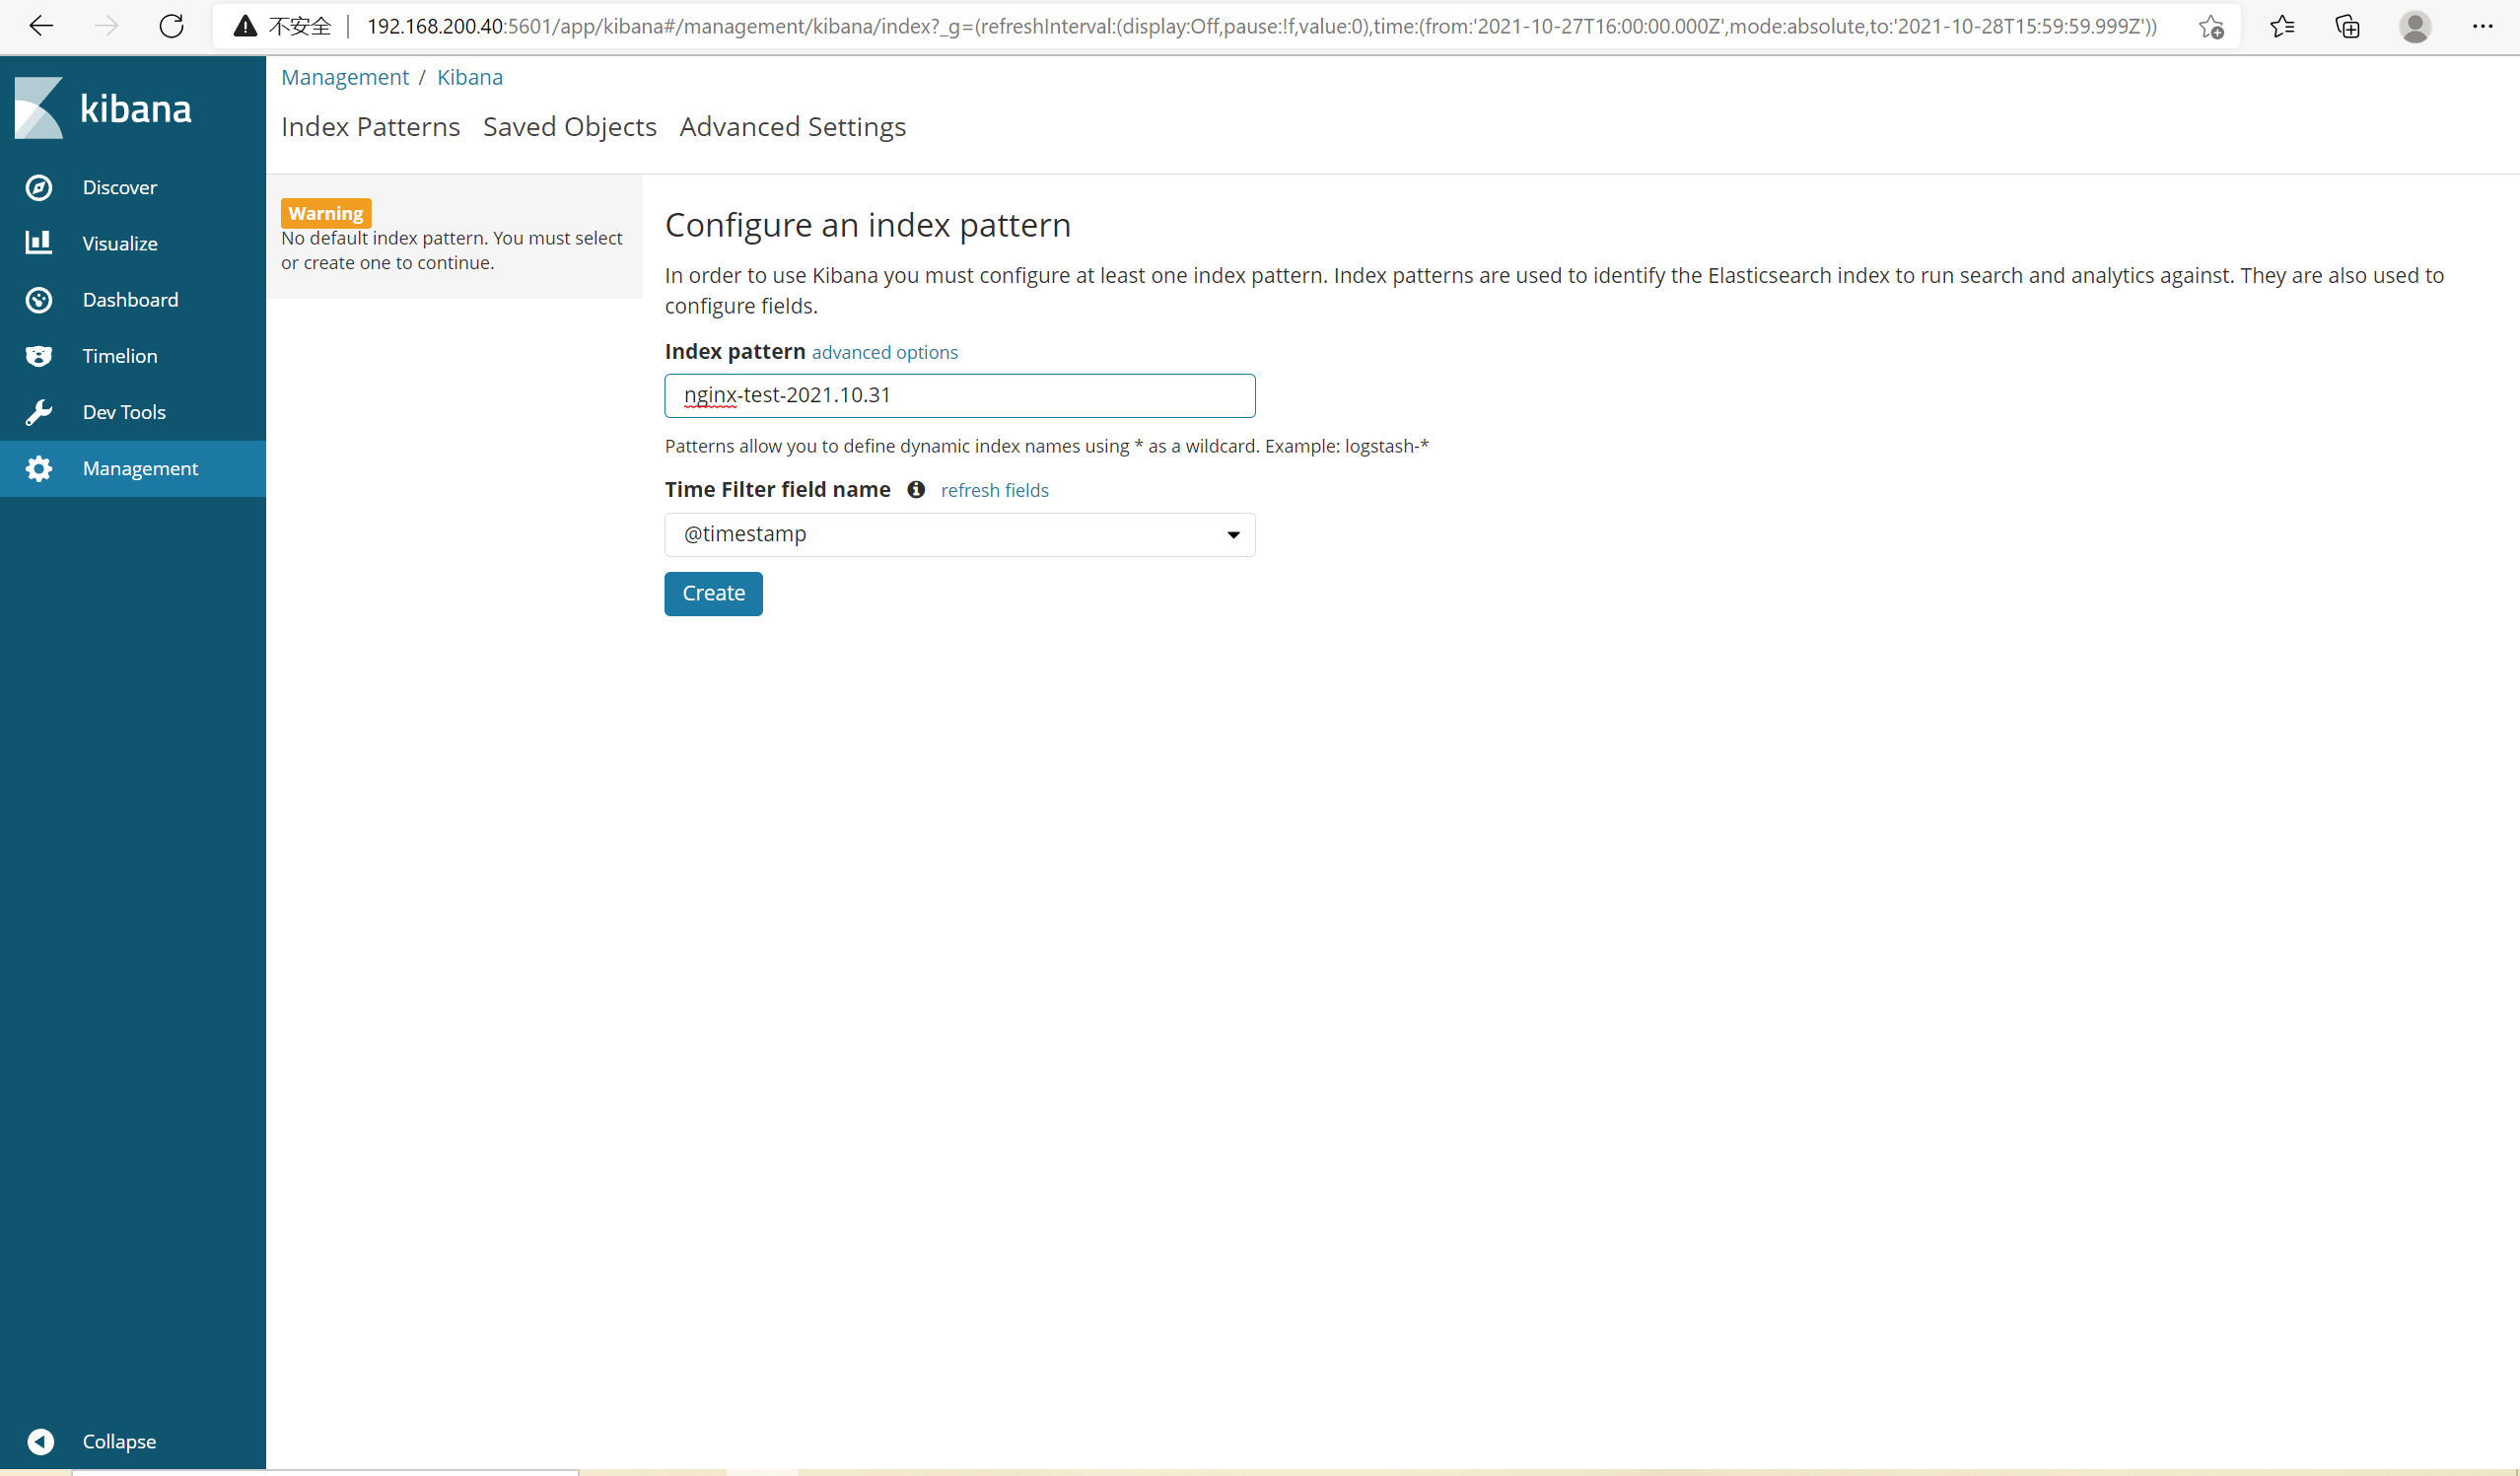
(2)web界面配置
浏览器访问192.168.200.40:5601,到kibana上配置,索引的目录为:system-log* 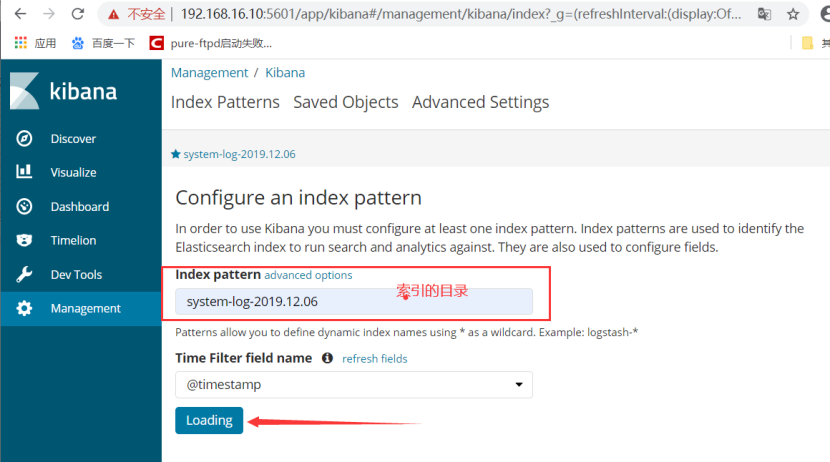
配置完成后,点击Discover,进入 “Discover” 页面后如果出现以下提示,则是代表无法查找到日志信息: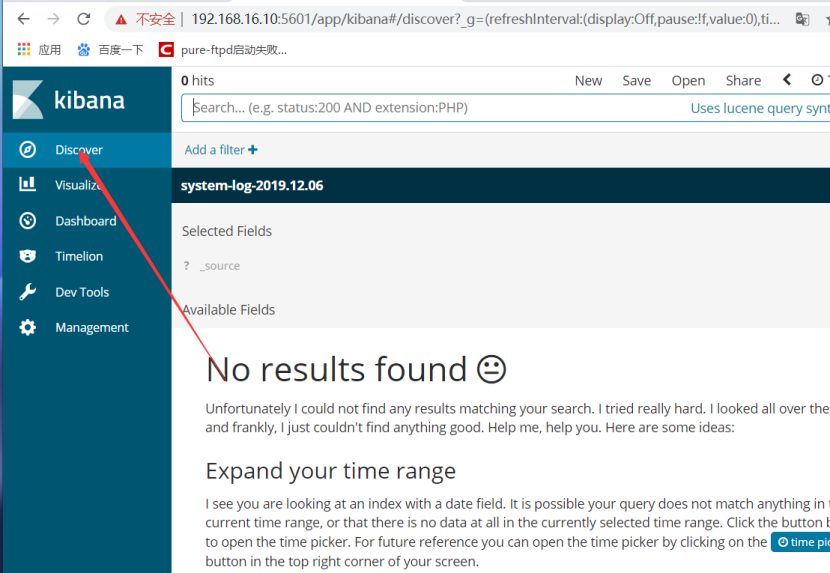
这种情况一般是时间的问题,点击右上角切换成查看当天的日志信息,由于我虚拟机的时间是19-12-06.所以我要把时间调整到那一天。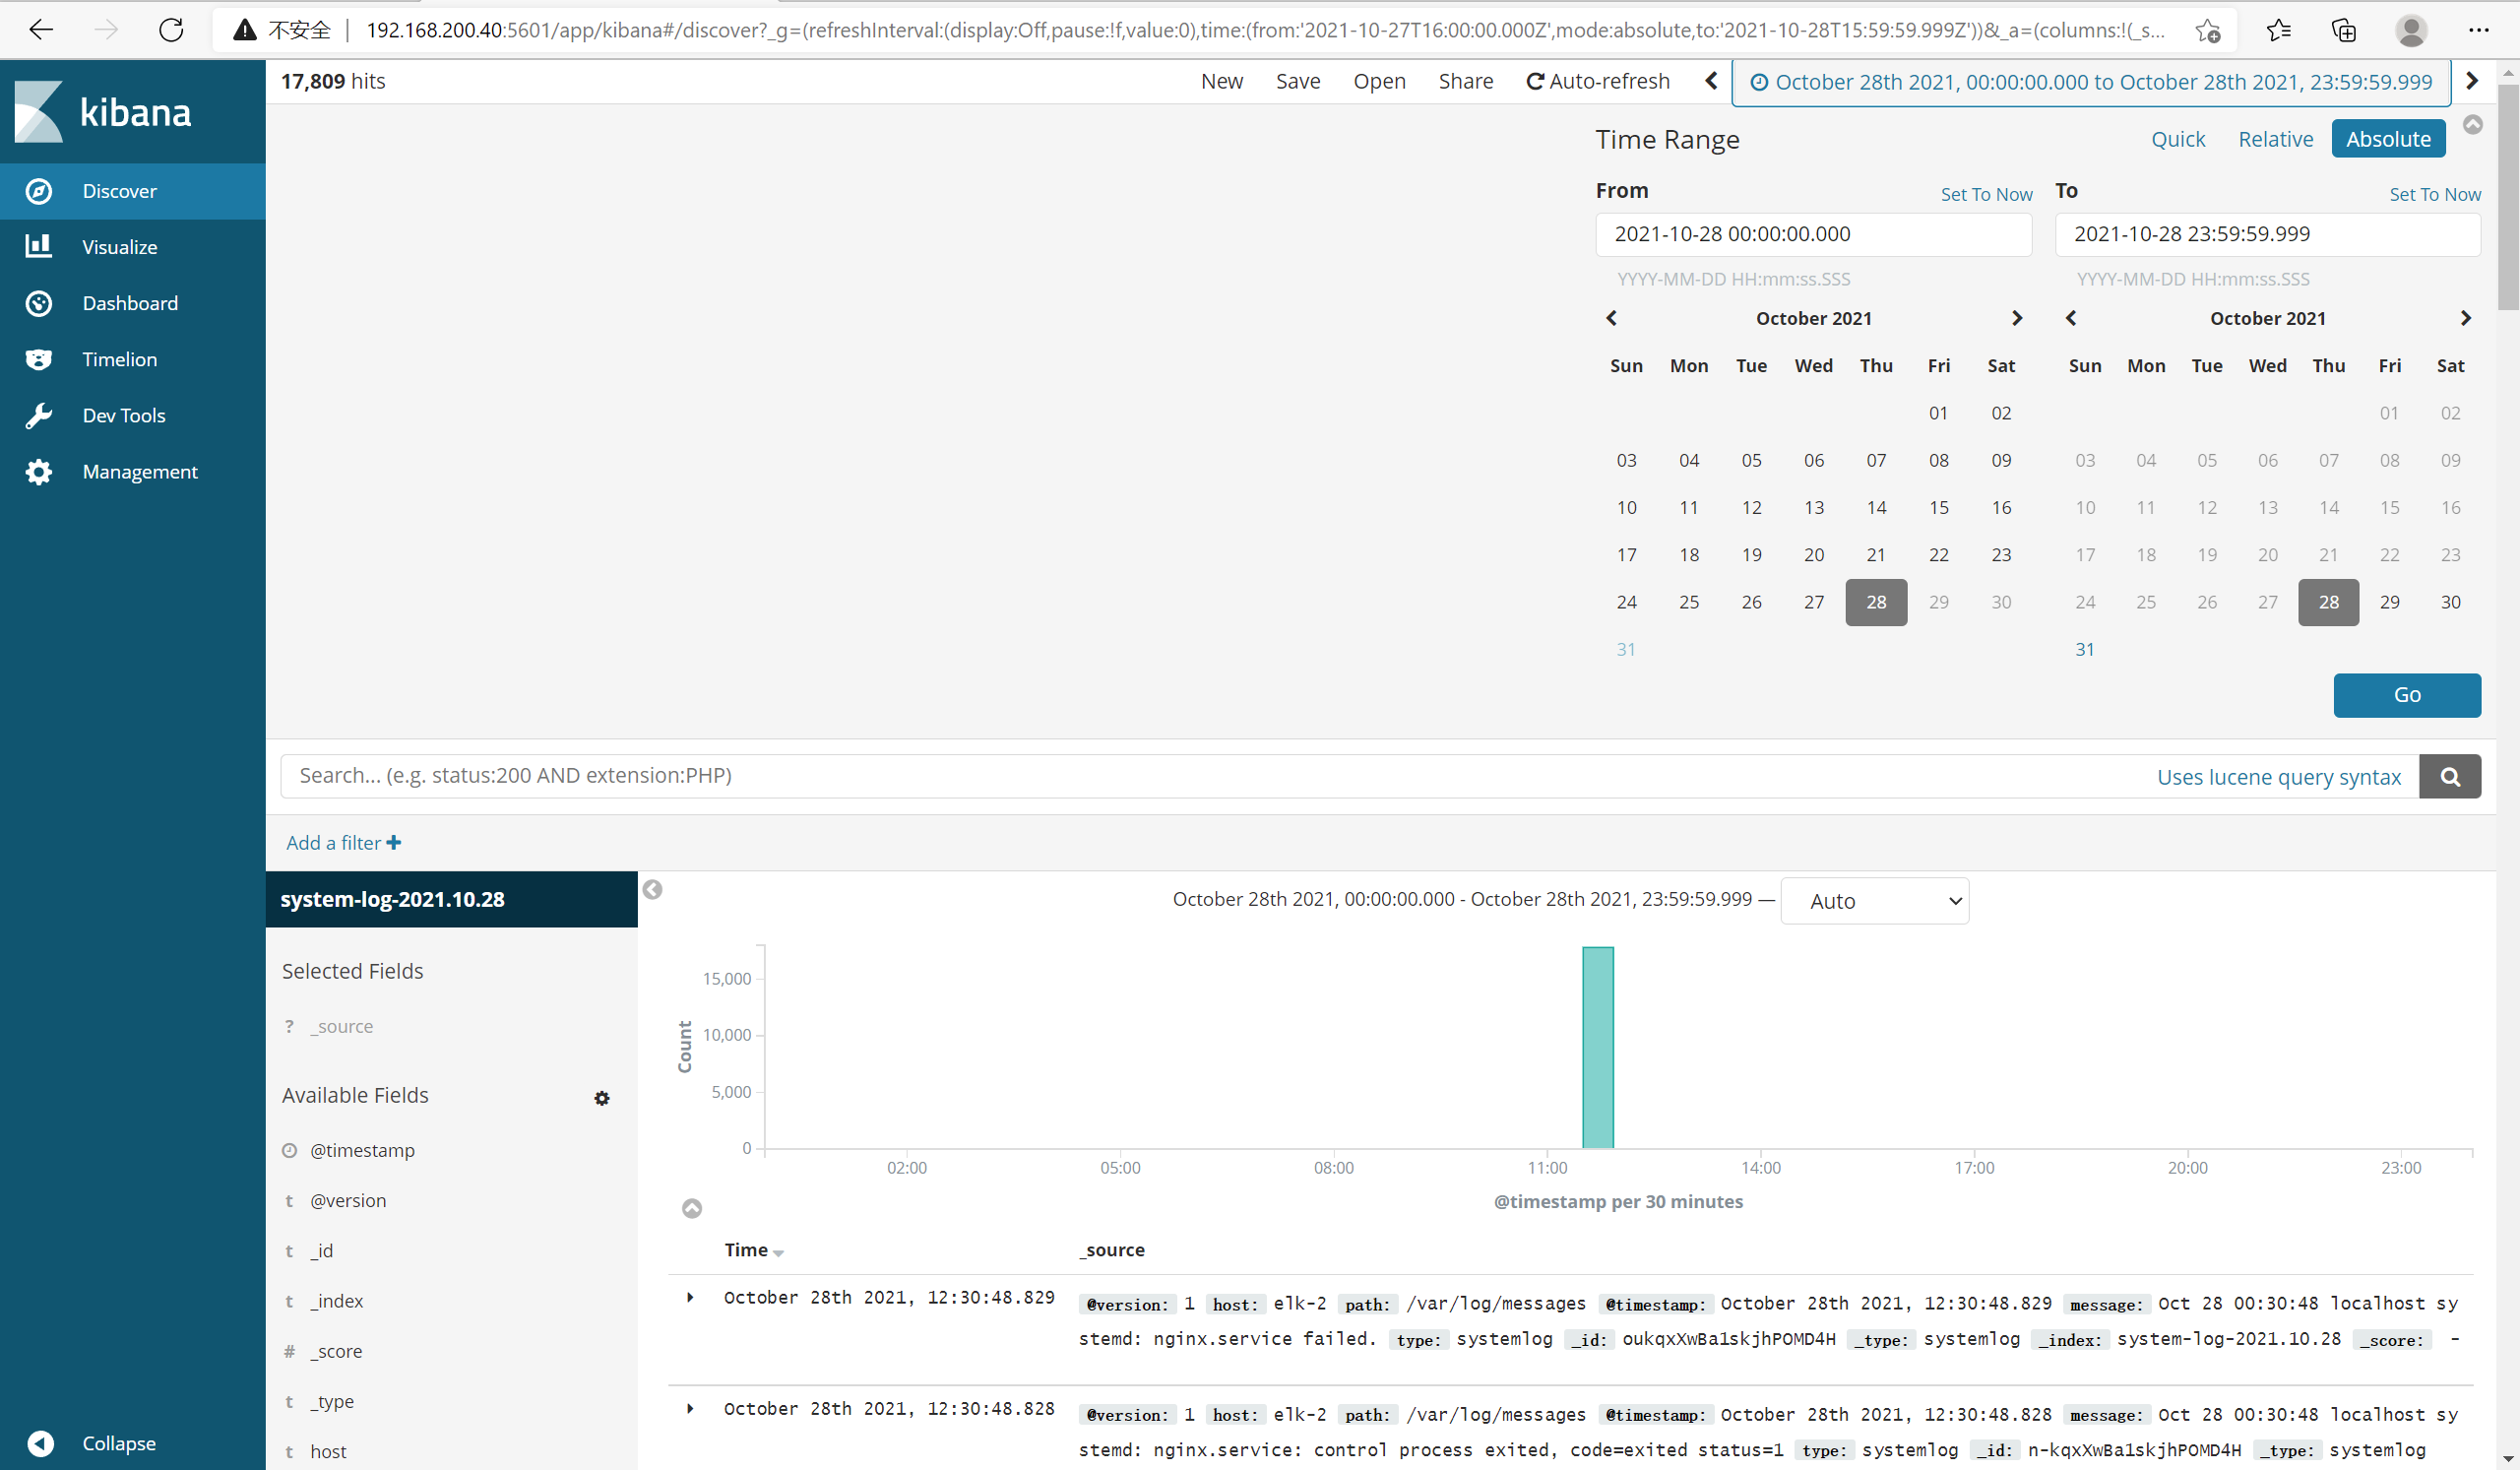
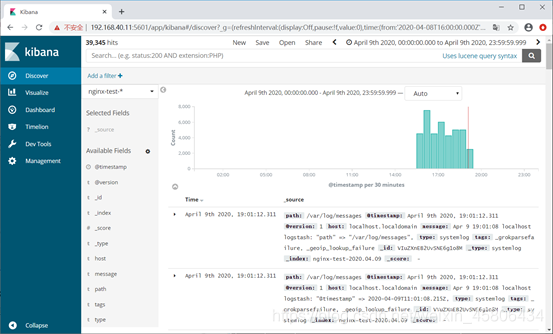
现在就正常了: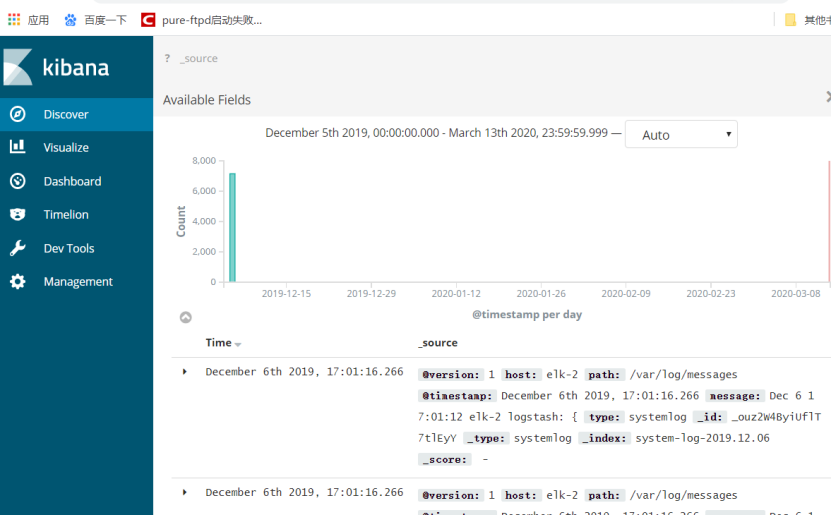
7.Logstash收集Nginx日志
(1)使用wget命令下载Nginx的rpm包并安装
[root@elk-2 ~]# yum install -y wget[root@elk-2 ~]# wget http://nginx.org/packages/centos/7/x86_64/RPMS/nginx-1.16.1-1.el7.ngx.x86_64.rpm
(2)配置Logstash
elk-2上:编辑Nginx配置文件,加入如下内容:
[root@elk-2 ~]# vi /etc/logstash/conf.d/nginx.confinput {file {path => "/tmp/elk_access.log"start_position => "beginning"type => "nginx"}}filter {grok {match => { "message" => "%{IPORHOST:http_host} %{IPORHOST:clientip} - % {USERNAME:remote_user} \[%{HTTPDATE:timestamp}\] \"(?:%{WORD:http_verb} %{NOTSPACE:http_request}(?: HTTP/%{NUMBER:http_version})?|%{DATA:raw_http_request})\" %{NUMBER:response} (?:%{NUMBER:bytes_read}|-) %{QS:referrer} %{QS:agent} %{QS:xforwardedfor} %{NUMBER:request_time:float}"}}geoip {source => "clientip"}}output {stdout { codec => rubydebug }elasticsearch {hosts => ["192.168.220.40:9200"]index => "nginx-test-%{+YYYY.MM.dd}"}}
使用logstash命令检查文件是否错误:
[root@elk-2 ~]# logstash --path.settings /etc/logstash/ -f /etc/logstash/conf.d/nginx.conf --config.test_and_exitSending Logstash's logs to /var/log/logstash which is now configured via log4j2.propertiesConfiguration OK
编辑监听Nginx日志配置文件,加入如下内容:
[root@elk-2 ~]# vi /etc/nginx/conf.d/elk.confserver {listen 80;server_name elk.com;location / {proxy_pass http://192.168.200.40:5601;proxy_set_header Host $host;proxy_set_header X-Real-IP $remote_addr;proxy_set_header X-Forwarded-For $proxy_add_x_forwarded_for;}access_log /tmp/elk_access.log main2;}
修改Nginx日志配置文件,增加如下内容(需注意Nginx配置文件格式,在accesslog上方添加以下内容):
[root@elk-2 ~]# vim /etc/nginx/nginx.conf'$status $body_bytes_sent "$http_referer" 'log_format main2 '$http_host $remote_addr - $remote_user [$time_local] "$request" 'user nginx;worker_processes 1;error_log /var/log/nginx/error.log warn;pid /var/run/nginx.pid;events {worker_connections 1024;}http {include /etc/nginx/mime.types;default_type application/octet-stream;log_format main '$remote_addr - $remote_user [$time_local] "$request" ''$status $body_bytes_sent "$http_referer" ''"$http_user_agent" "$http_x_forwarded_for"';log_format main2 '$http_host $remote_addr - $remote_user [$time_local] "$request" ''$status $body_bytes_sent "$http_referer" ''"$http_user_agent" "$upstream_addr" $request_time';access_log /var/log/nginx/access.log main;sendfile on;#tcp_nopush on;keepalive_timeout 65;#gzip on;include /etc/nginx/conf.d/*.conf;}[root@elk-2 ~]# nginx -tnginx: [emerg] "log_format" directive is not allowed here in /etc/nginx/nginx.conf:3nginx: configuration file /etc/nginx/nginx.conf test failed[root@elk-2 ~]# systemctl start nginx[root@elk-2 ~]# systemctl restart logstash
在/etc/hosts文件和编辑C:\Windows\System32\drivers\etc\hosts文件中添加下面信息:
192.168.200.50 elk.com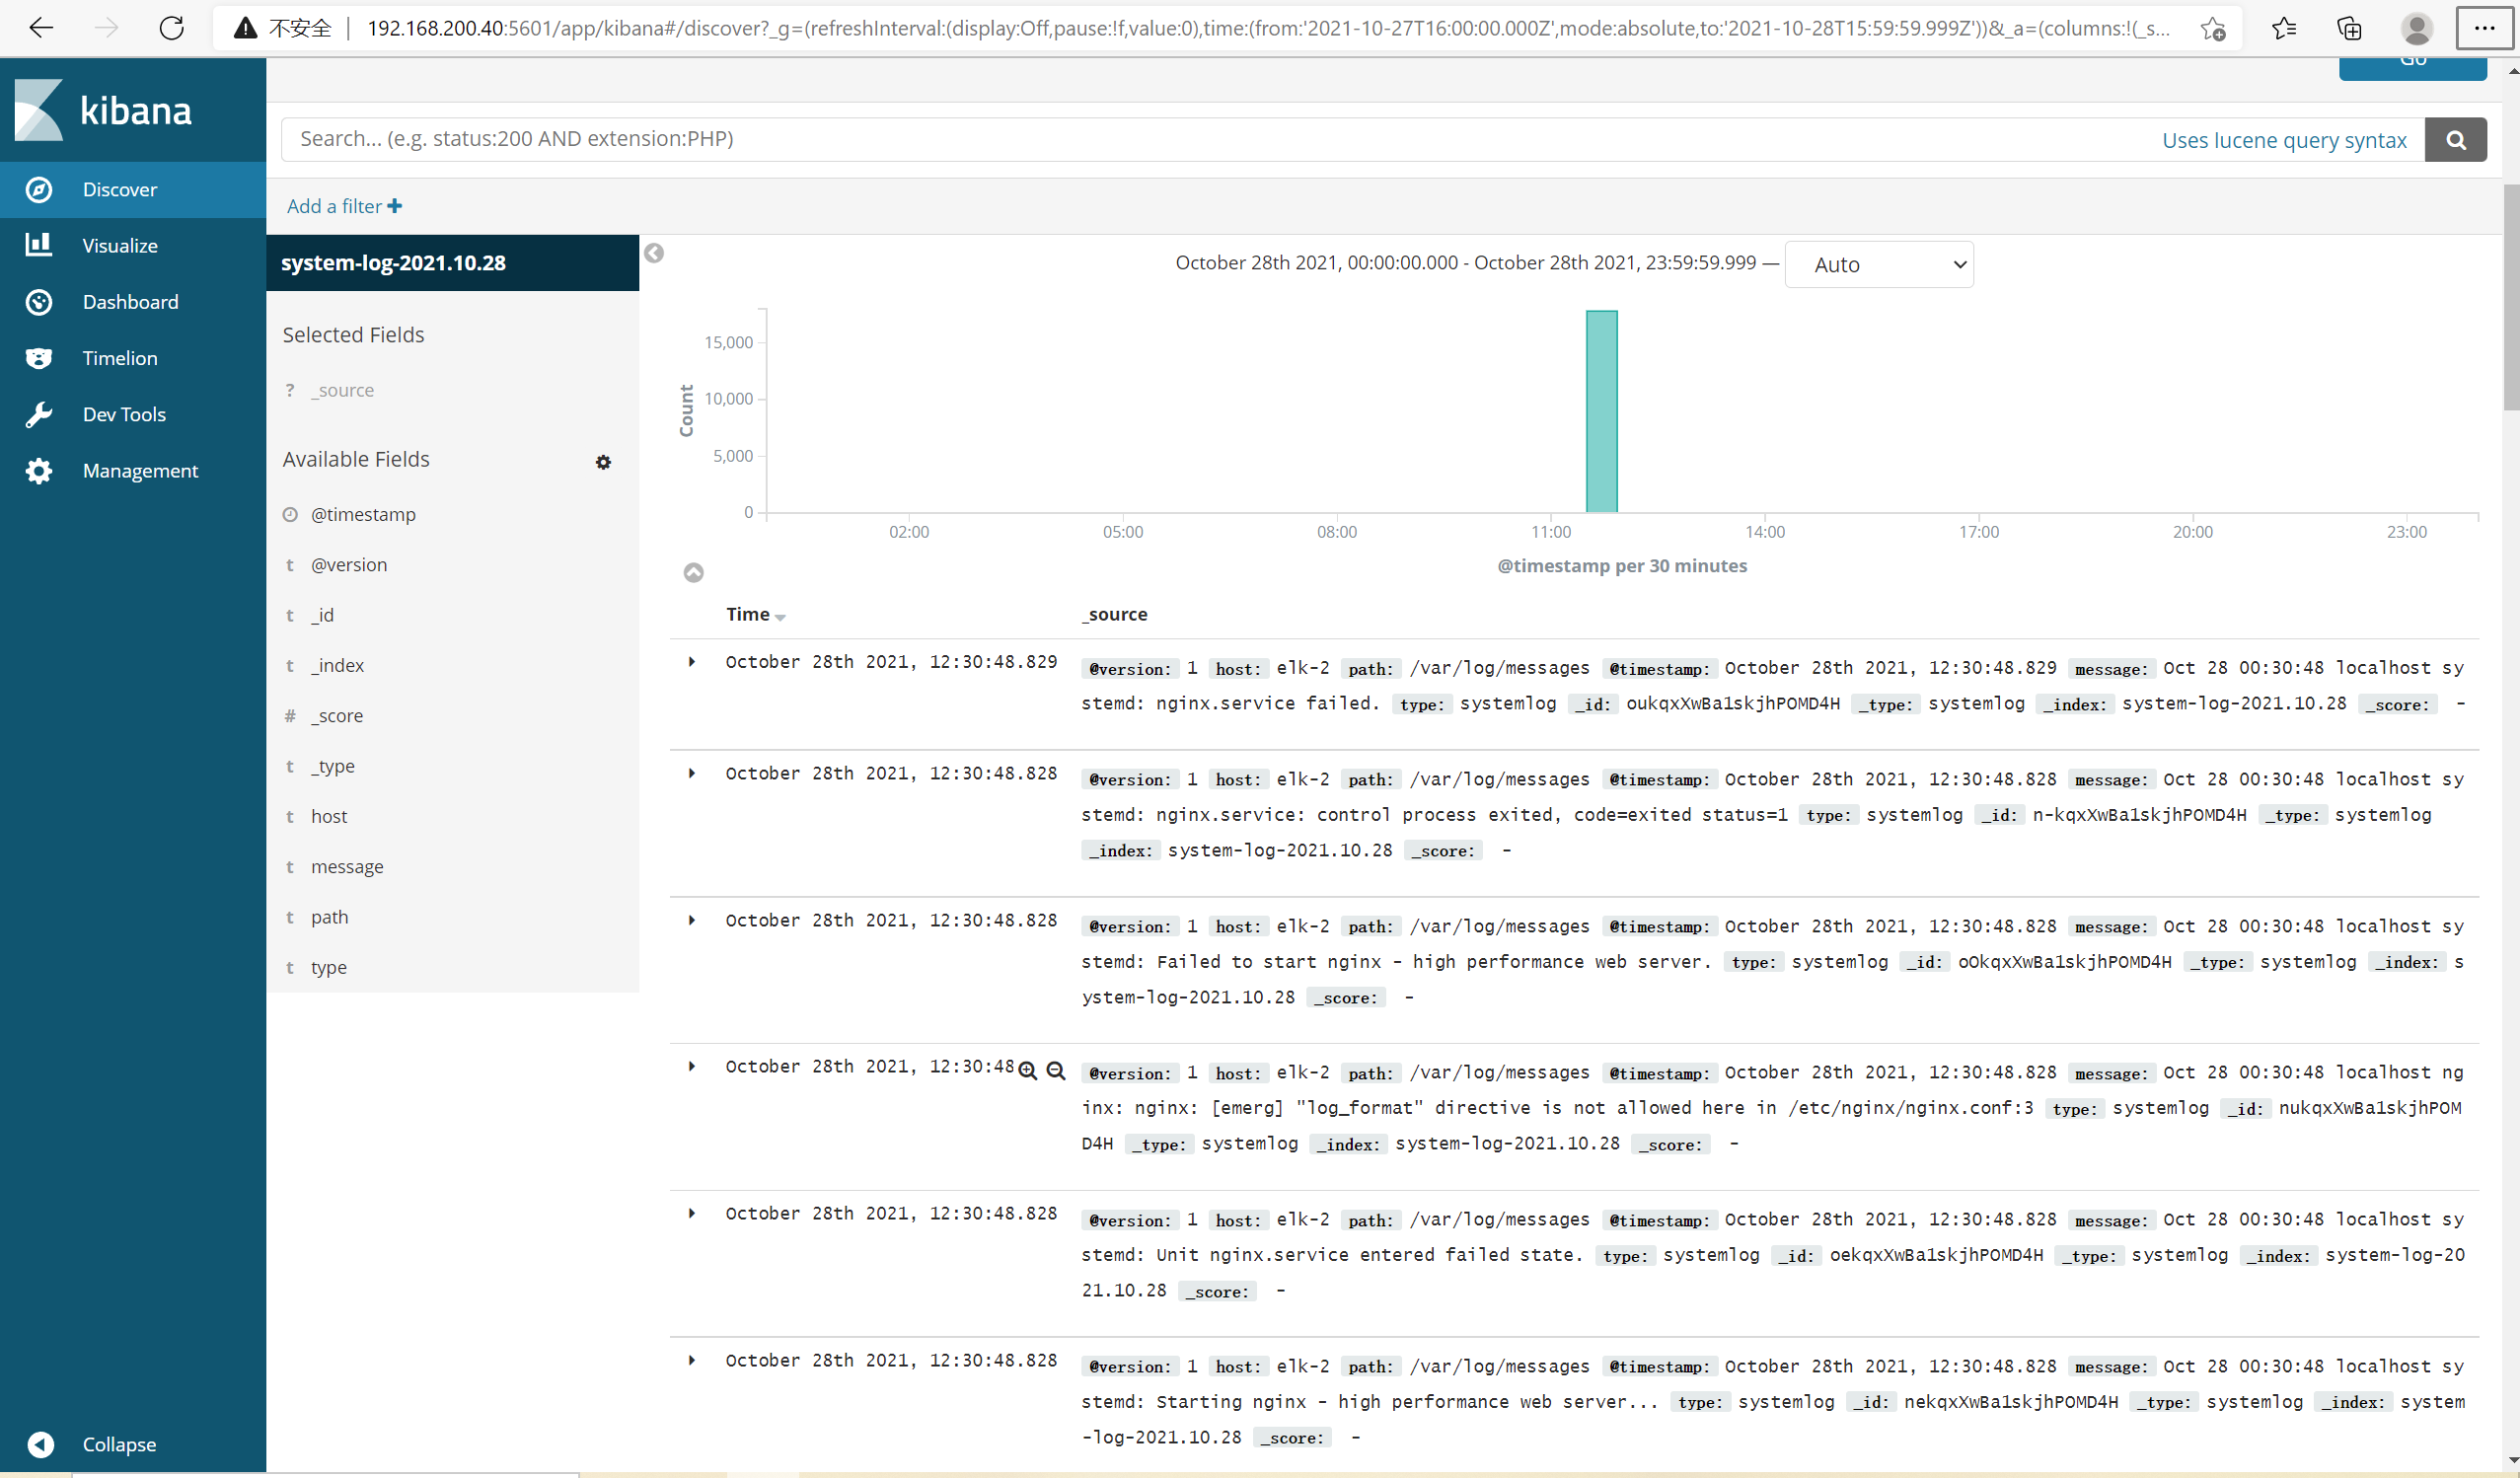
浏览器访问192.168.200.40:5601,到Kibana上配置索引: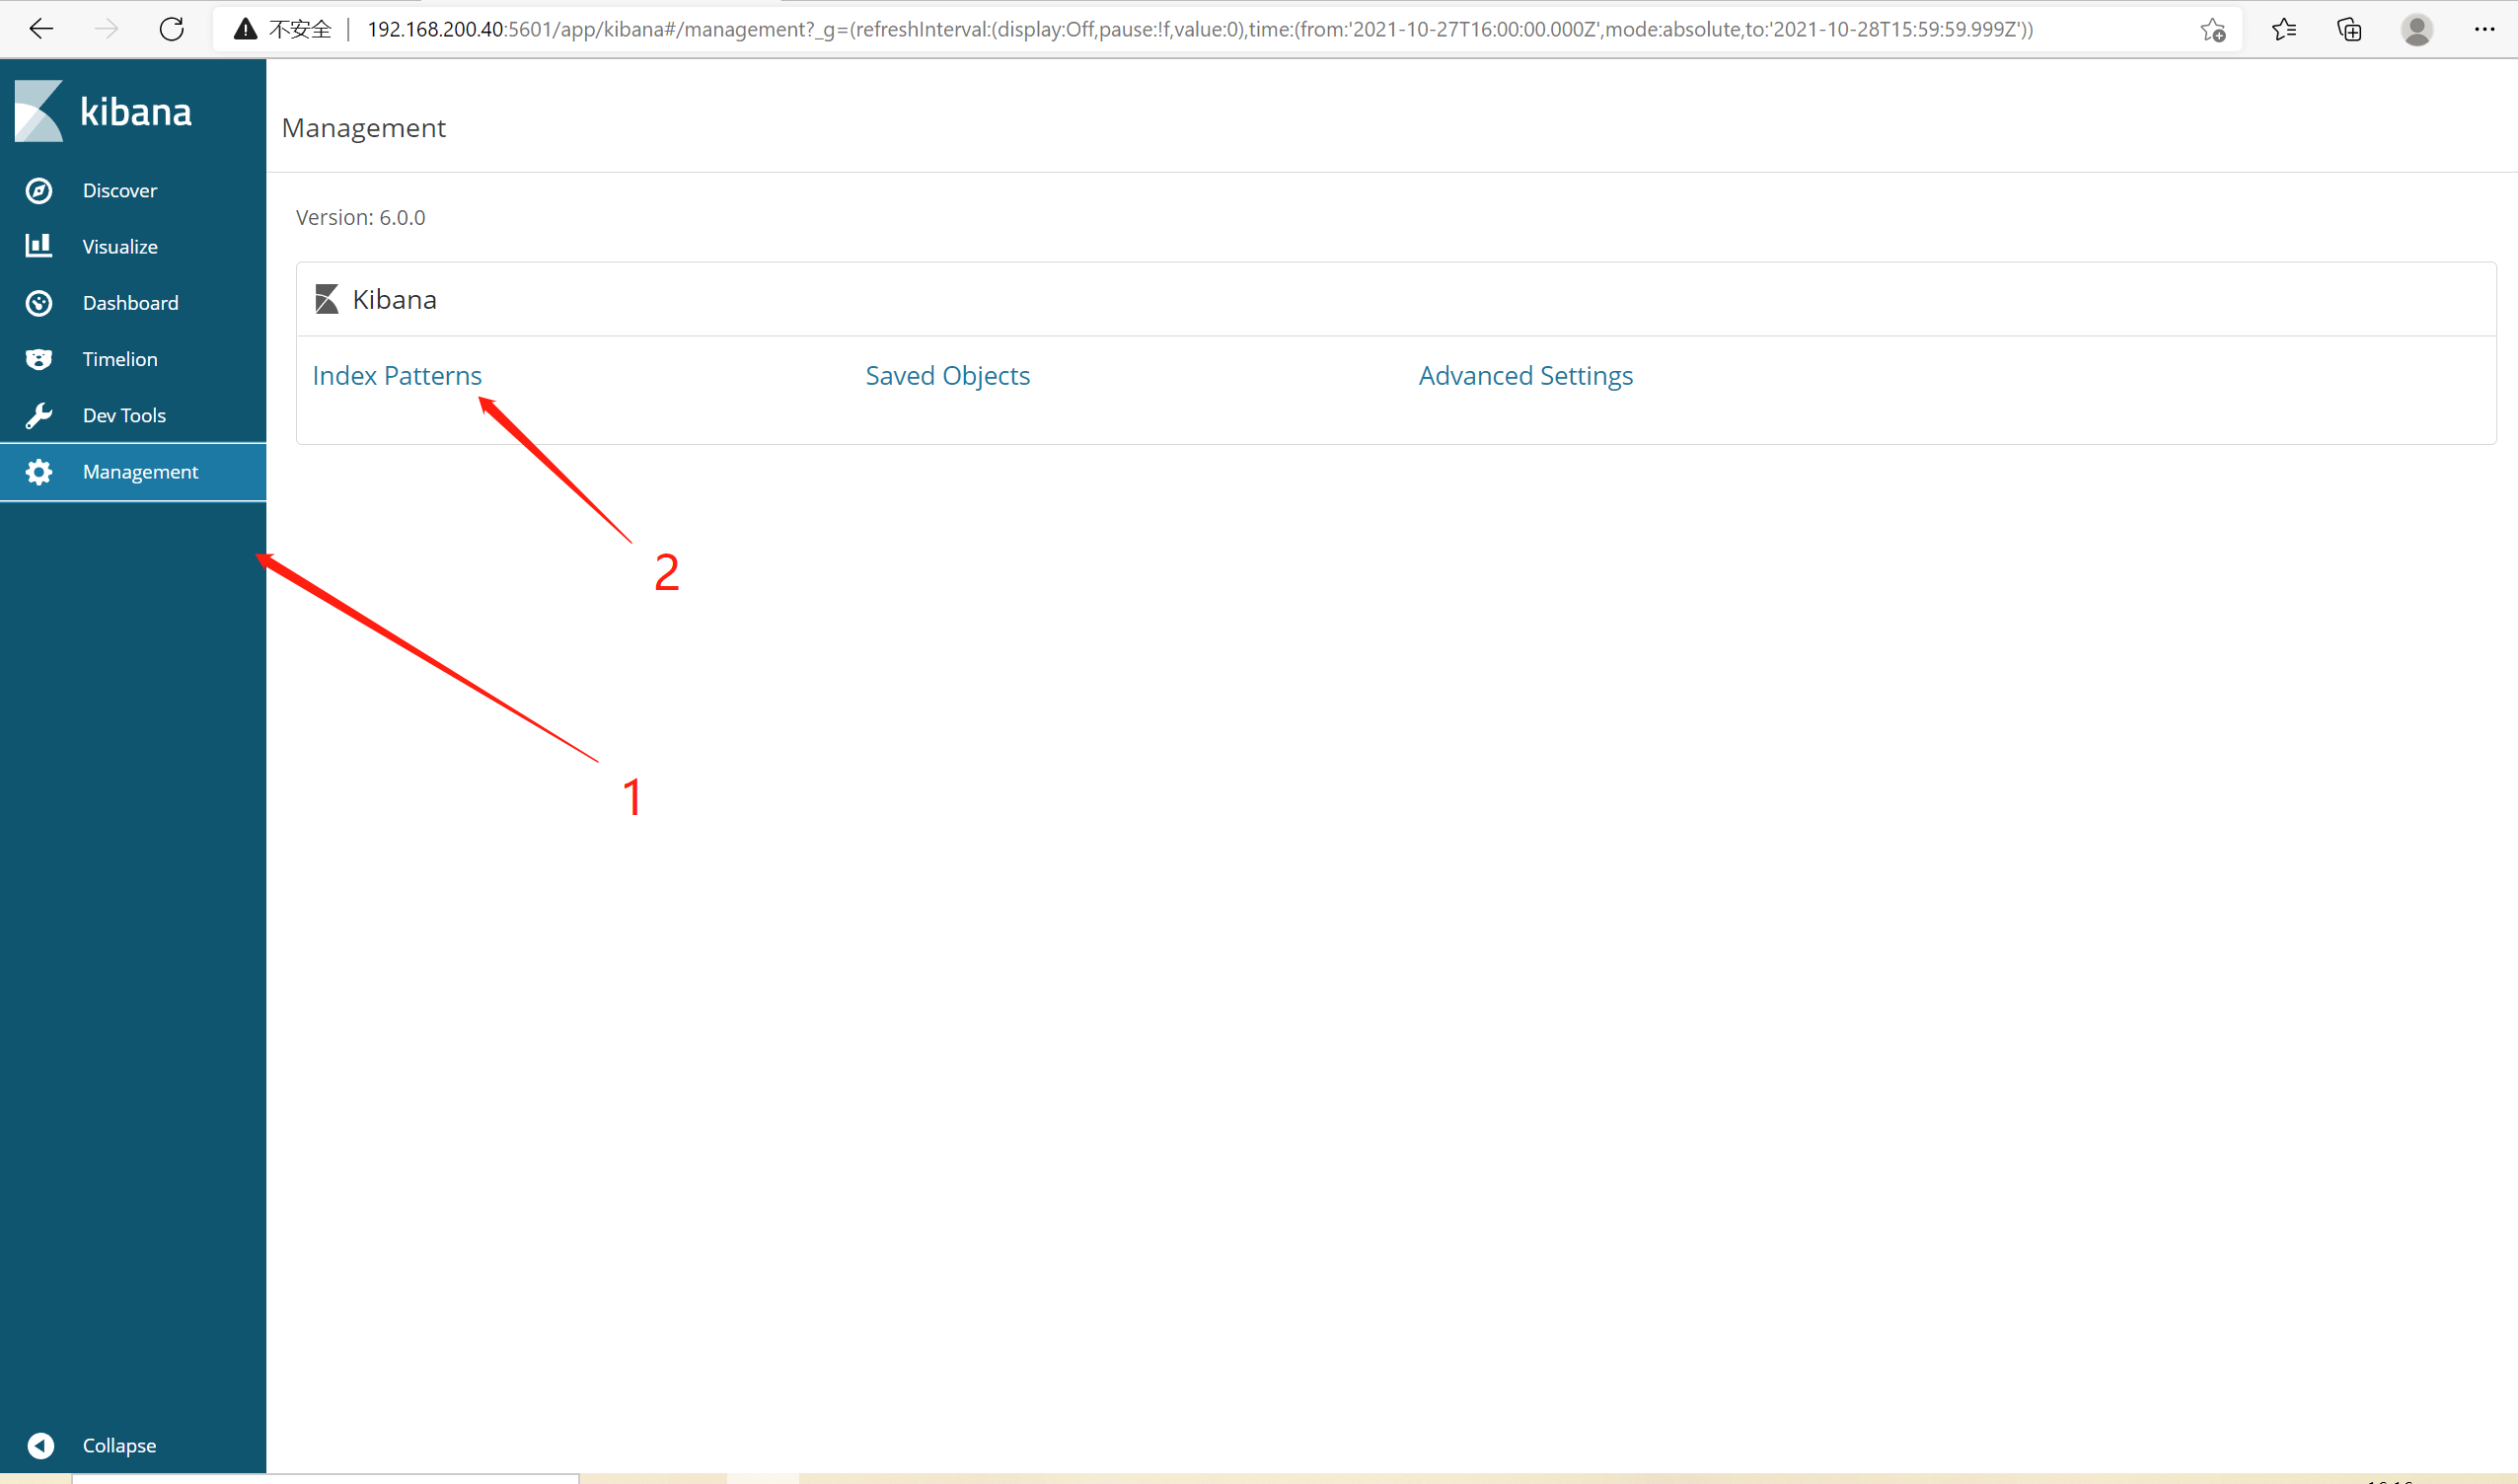
[[root@elk-1 ~]# curl ‘192.168.200.40:9200/_cat/indices?v’
health status index uuid pri rep docs.count docs.deleted store.size pri.store.size
yellow open system-log-2021.10.31 nEPMJp3pRlu8iKOk_IAyPA 5 1 8463 0 1.6mb 1.6mb
yellow open .kibana PnwoaYBqQmWB_uk2v4oKtQ 1 1 1 0 3.7kb 3.7kb
yellow open system-log-2021.10.28 1mG-v4n9QtW1xgCeW4QboA 5 1 17809 0 3.5mb 3.5mb
yellow open nginx-test-2021.10.31 ReIempdmRG-6JmDNTugg9g 5 1 8463 0 1.5mb 1.5mb
[root@elk-1 ~]# curl -XGET/DELETE ‘192.168.200.40:9200/nginx-test-2021.10.31?pretty’
{
“nginx-test-2021.10.31” : {
“aliases” : { },
“mappings” : {
“systemlog” : {
“properties” : {
“@timestamp” : {
“type” : “date”
},
“@version” : {
“type” : “text”,
“fields” : {
“keyword” : {
“type” : “keyword”,
“ignore_above” : 256
}
}
},
“host” : {
“type” : “text”,
“fields” : {
“keyword” : {
“type” : “keyword”,
“ignore_above” : 256
}
}
},
“message” : {
“type” : “text”,
“fields” : {
“keyword” : {
“type” : “keyword”,
“ignore_above” : 256
}
}
},
“path” : {
“type” : “text”,
“fields” : {
“keyword” : {
“type” : “keyword”,
“ignore_above” : 256
}
}
},
“tags” : {
“type” : “text”,
“fields” : {
“keyword” : {
“type” : “keyword”,
“ignore_above” : 256
}
}
},
“type” : {
“type” : “text”,
“fields” : {
“keyword” : {
“type” : “keyword”,
“ignore_above” : 256
}
}
}
}
}
},
“settings” : {
“index” : {
“creation_date” : “1635669096229”,
“number_of_shards” : “5”,
“number_of_replicas” : “1”,
“uuid” : “ReIempdmRG-6JmDNTugg9g”,
“version” : {
“created” : “6000099”
},
“provided_name” : “nginx-test-2021.10.31”
}
}
}
}
配置完成后,选择Discover,进入“Discover”页面后,如果出现以下提示,则是代表无法查找到日志信息: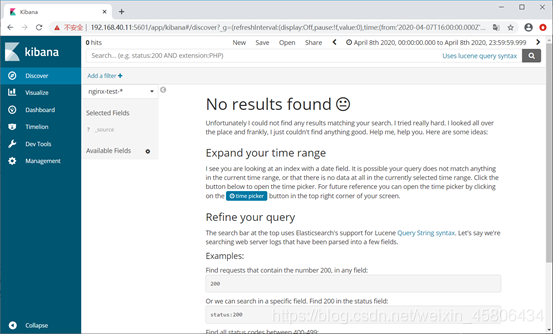
这种情况一般是时间的问题,单击右上角内容切换成查看当天的日志信息,由于我虚拟机的时间是19-12-06,所以我要把时间调整到那一天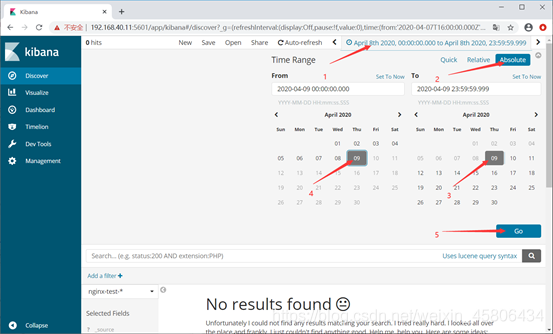
8.使用Beats采集日志
(1)安装Beats
在elk-3主机上下载和安装Beats:
[root@elk-3 ~]# yum install -y wget[root@elk-3 ~]# wget https://artifacts.elastic.co/downloads/beats/filebeat/filebeat-6.0.0-x86_64.rpm[root@elk-3 ~]# rpm -ivh filebeat-6.0.0-x86_64.rpm
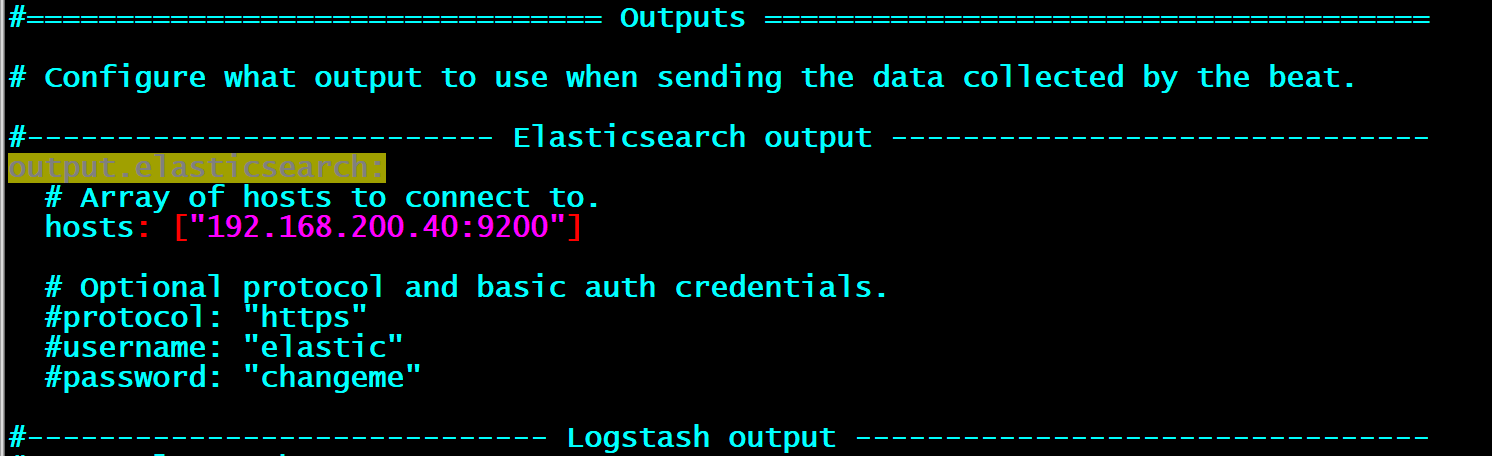
(2)配置Beats
编辑配置文件:
[root@elk-3 ~]# vim /etc/filebeat/filebeat.ymlfilebeat.prospectors:#enabled: false //注释掉该参数paths:- /var/log/elasticsearch/ELK.log //此处可自行改为想要监听的日志文件output.elasticsearch:hosts: ["192.168.200.40:9200"][root@elk-3 ~]# systemctl start filebeat
在elk-1主机上使用curl ‘192.168.200.40:9200/_cat/indices?v’ 命令查看是否监听到elk-3主机上的日志(出现filebeat字样表示成功)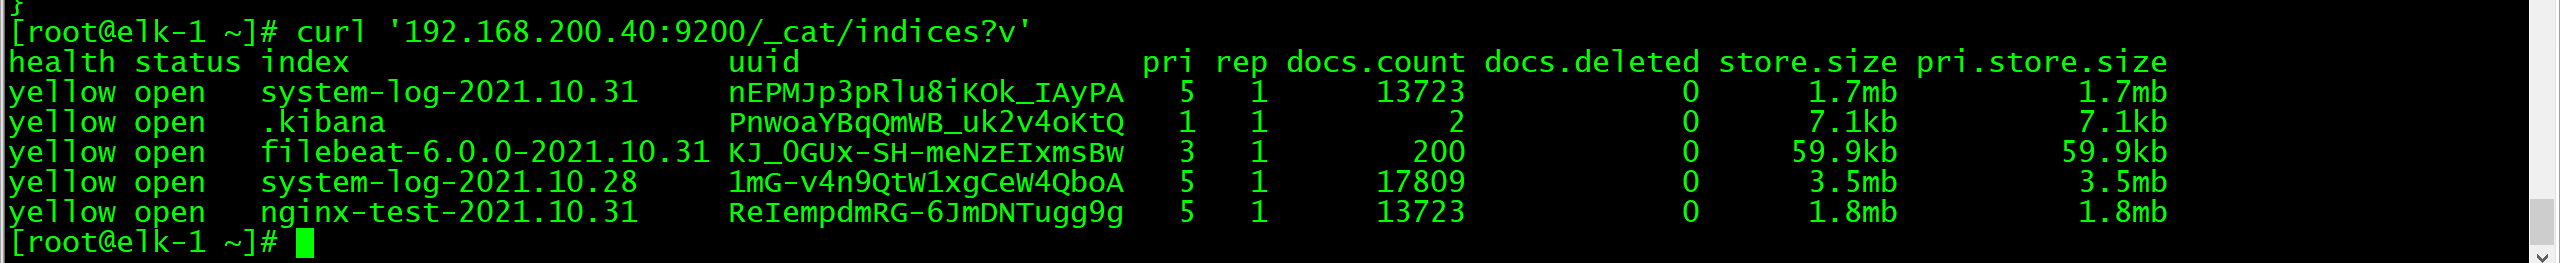
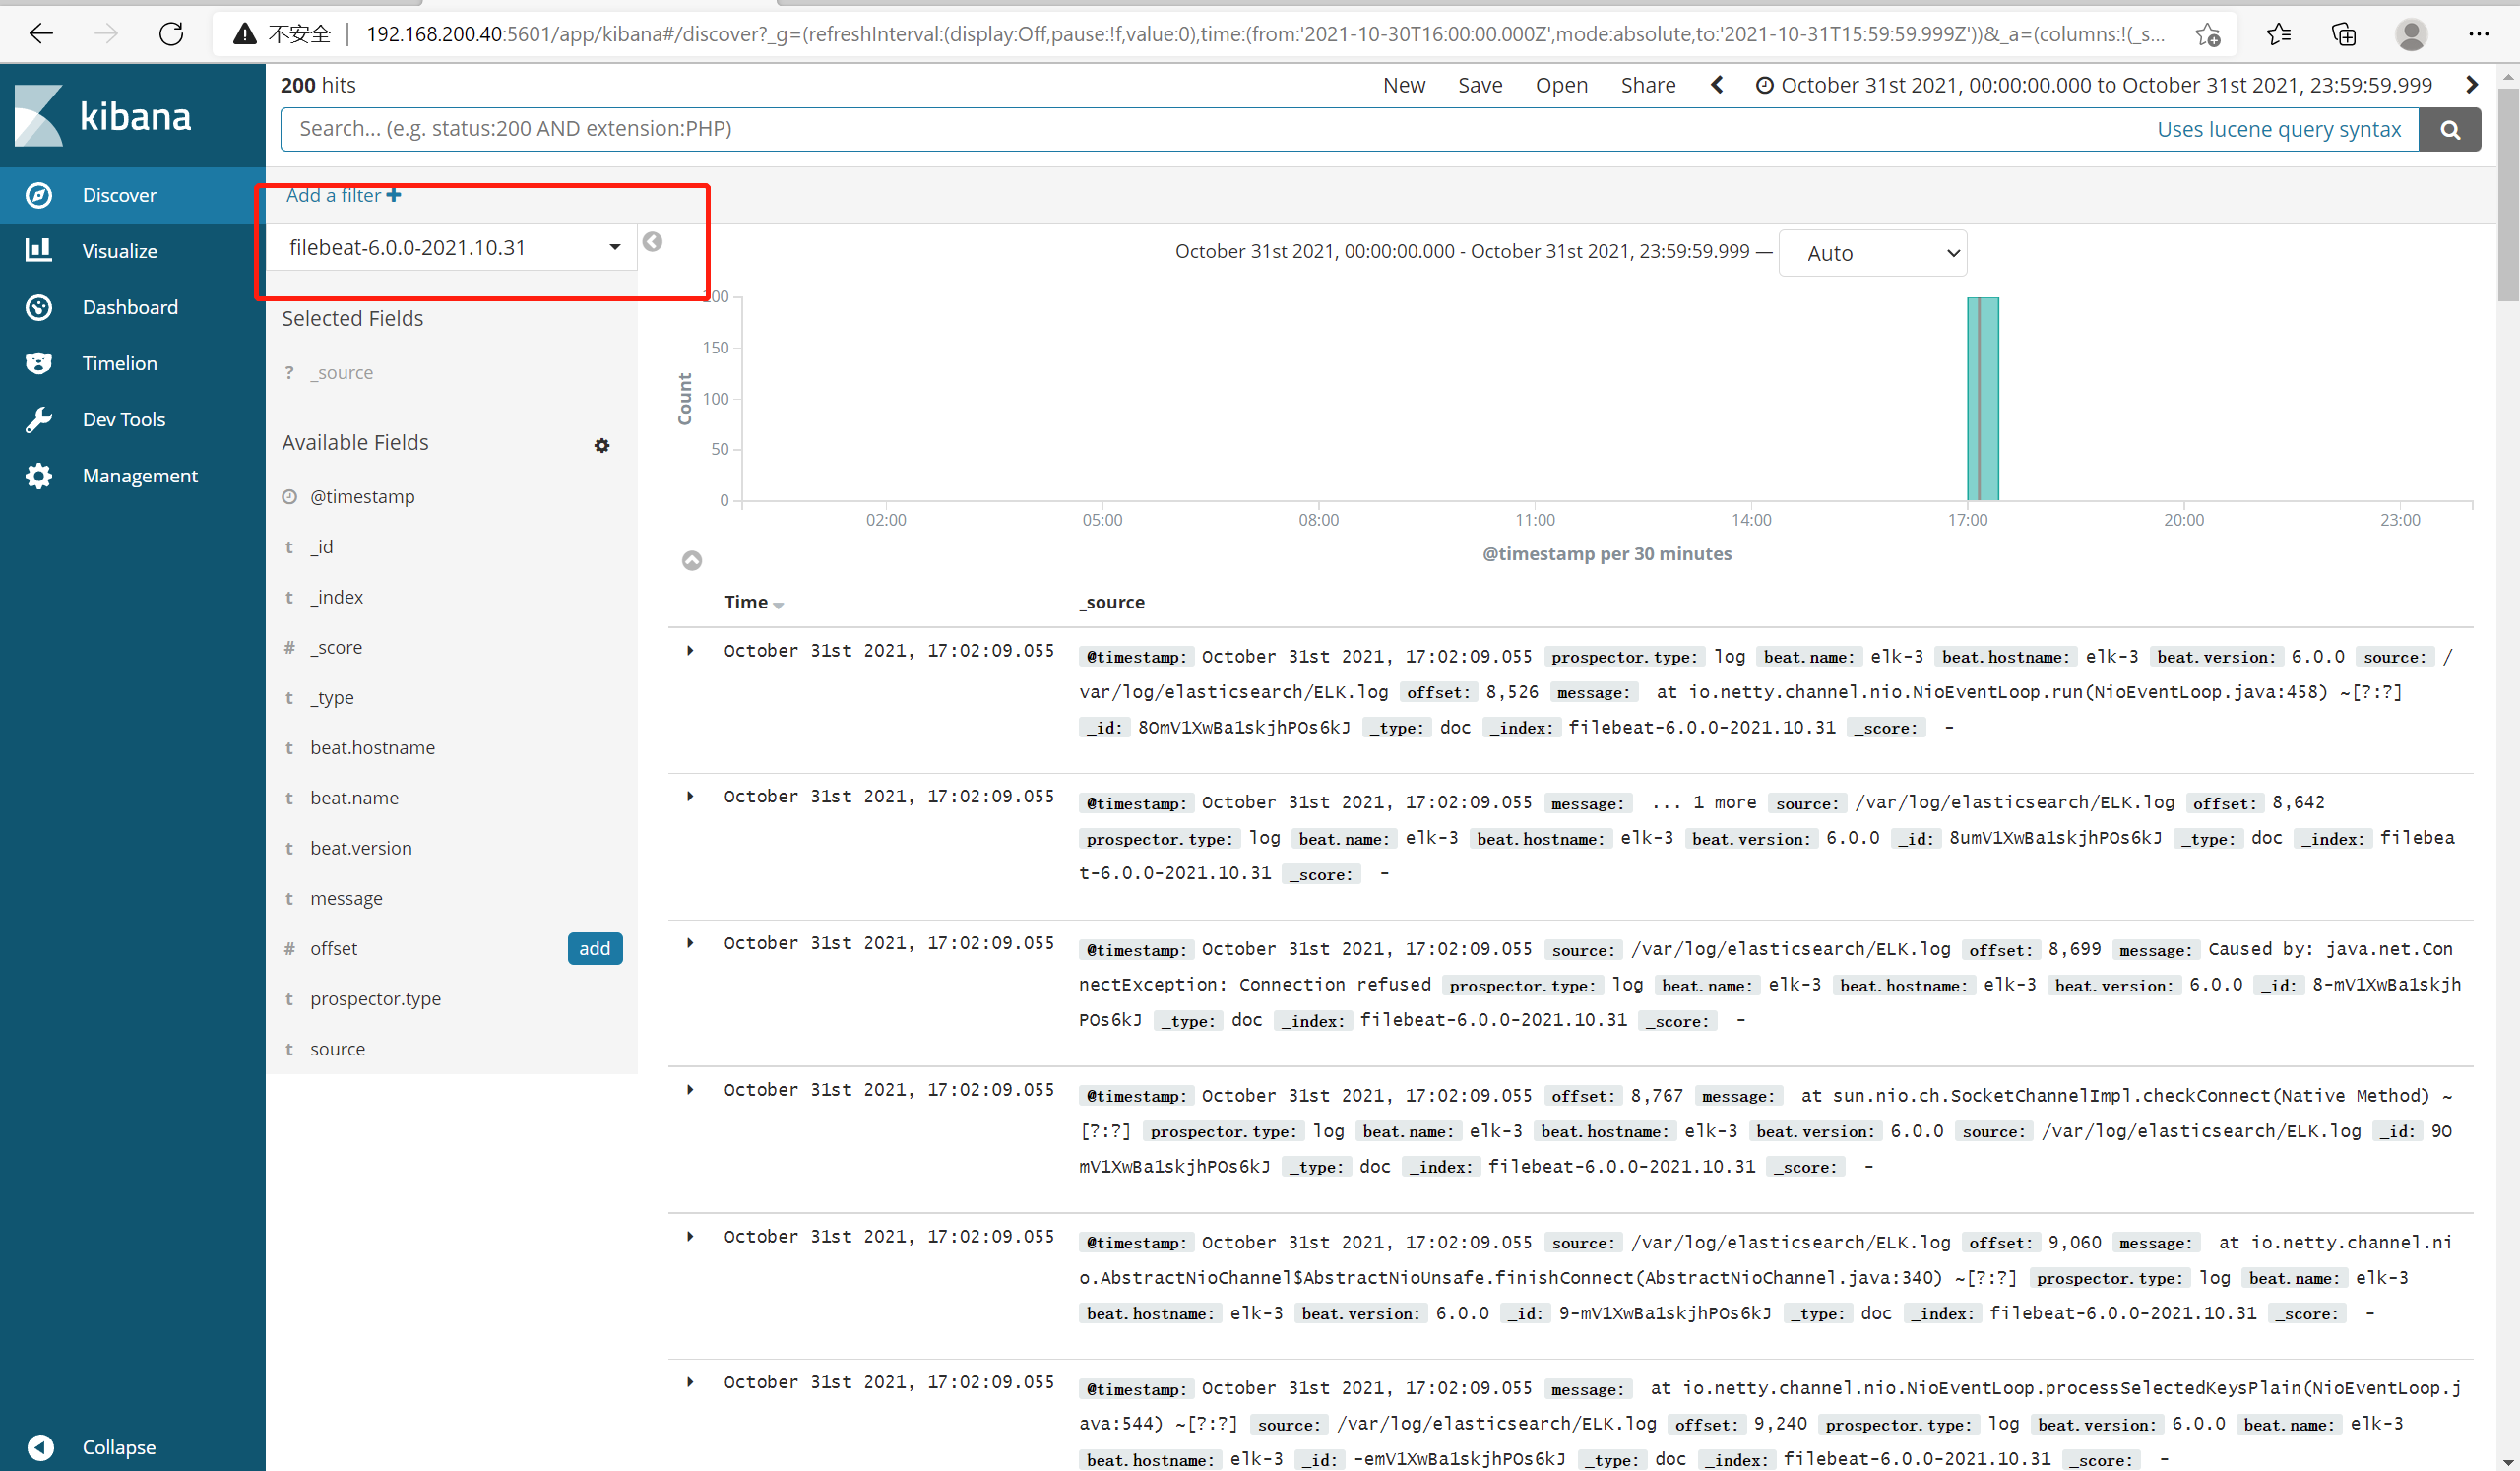
(3)Web界面配置
按照上一个步骤在浏览器中添加filebeat日志文件的监控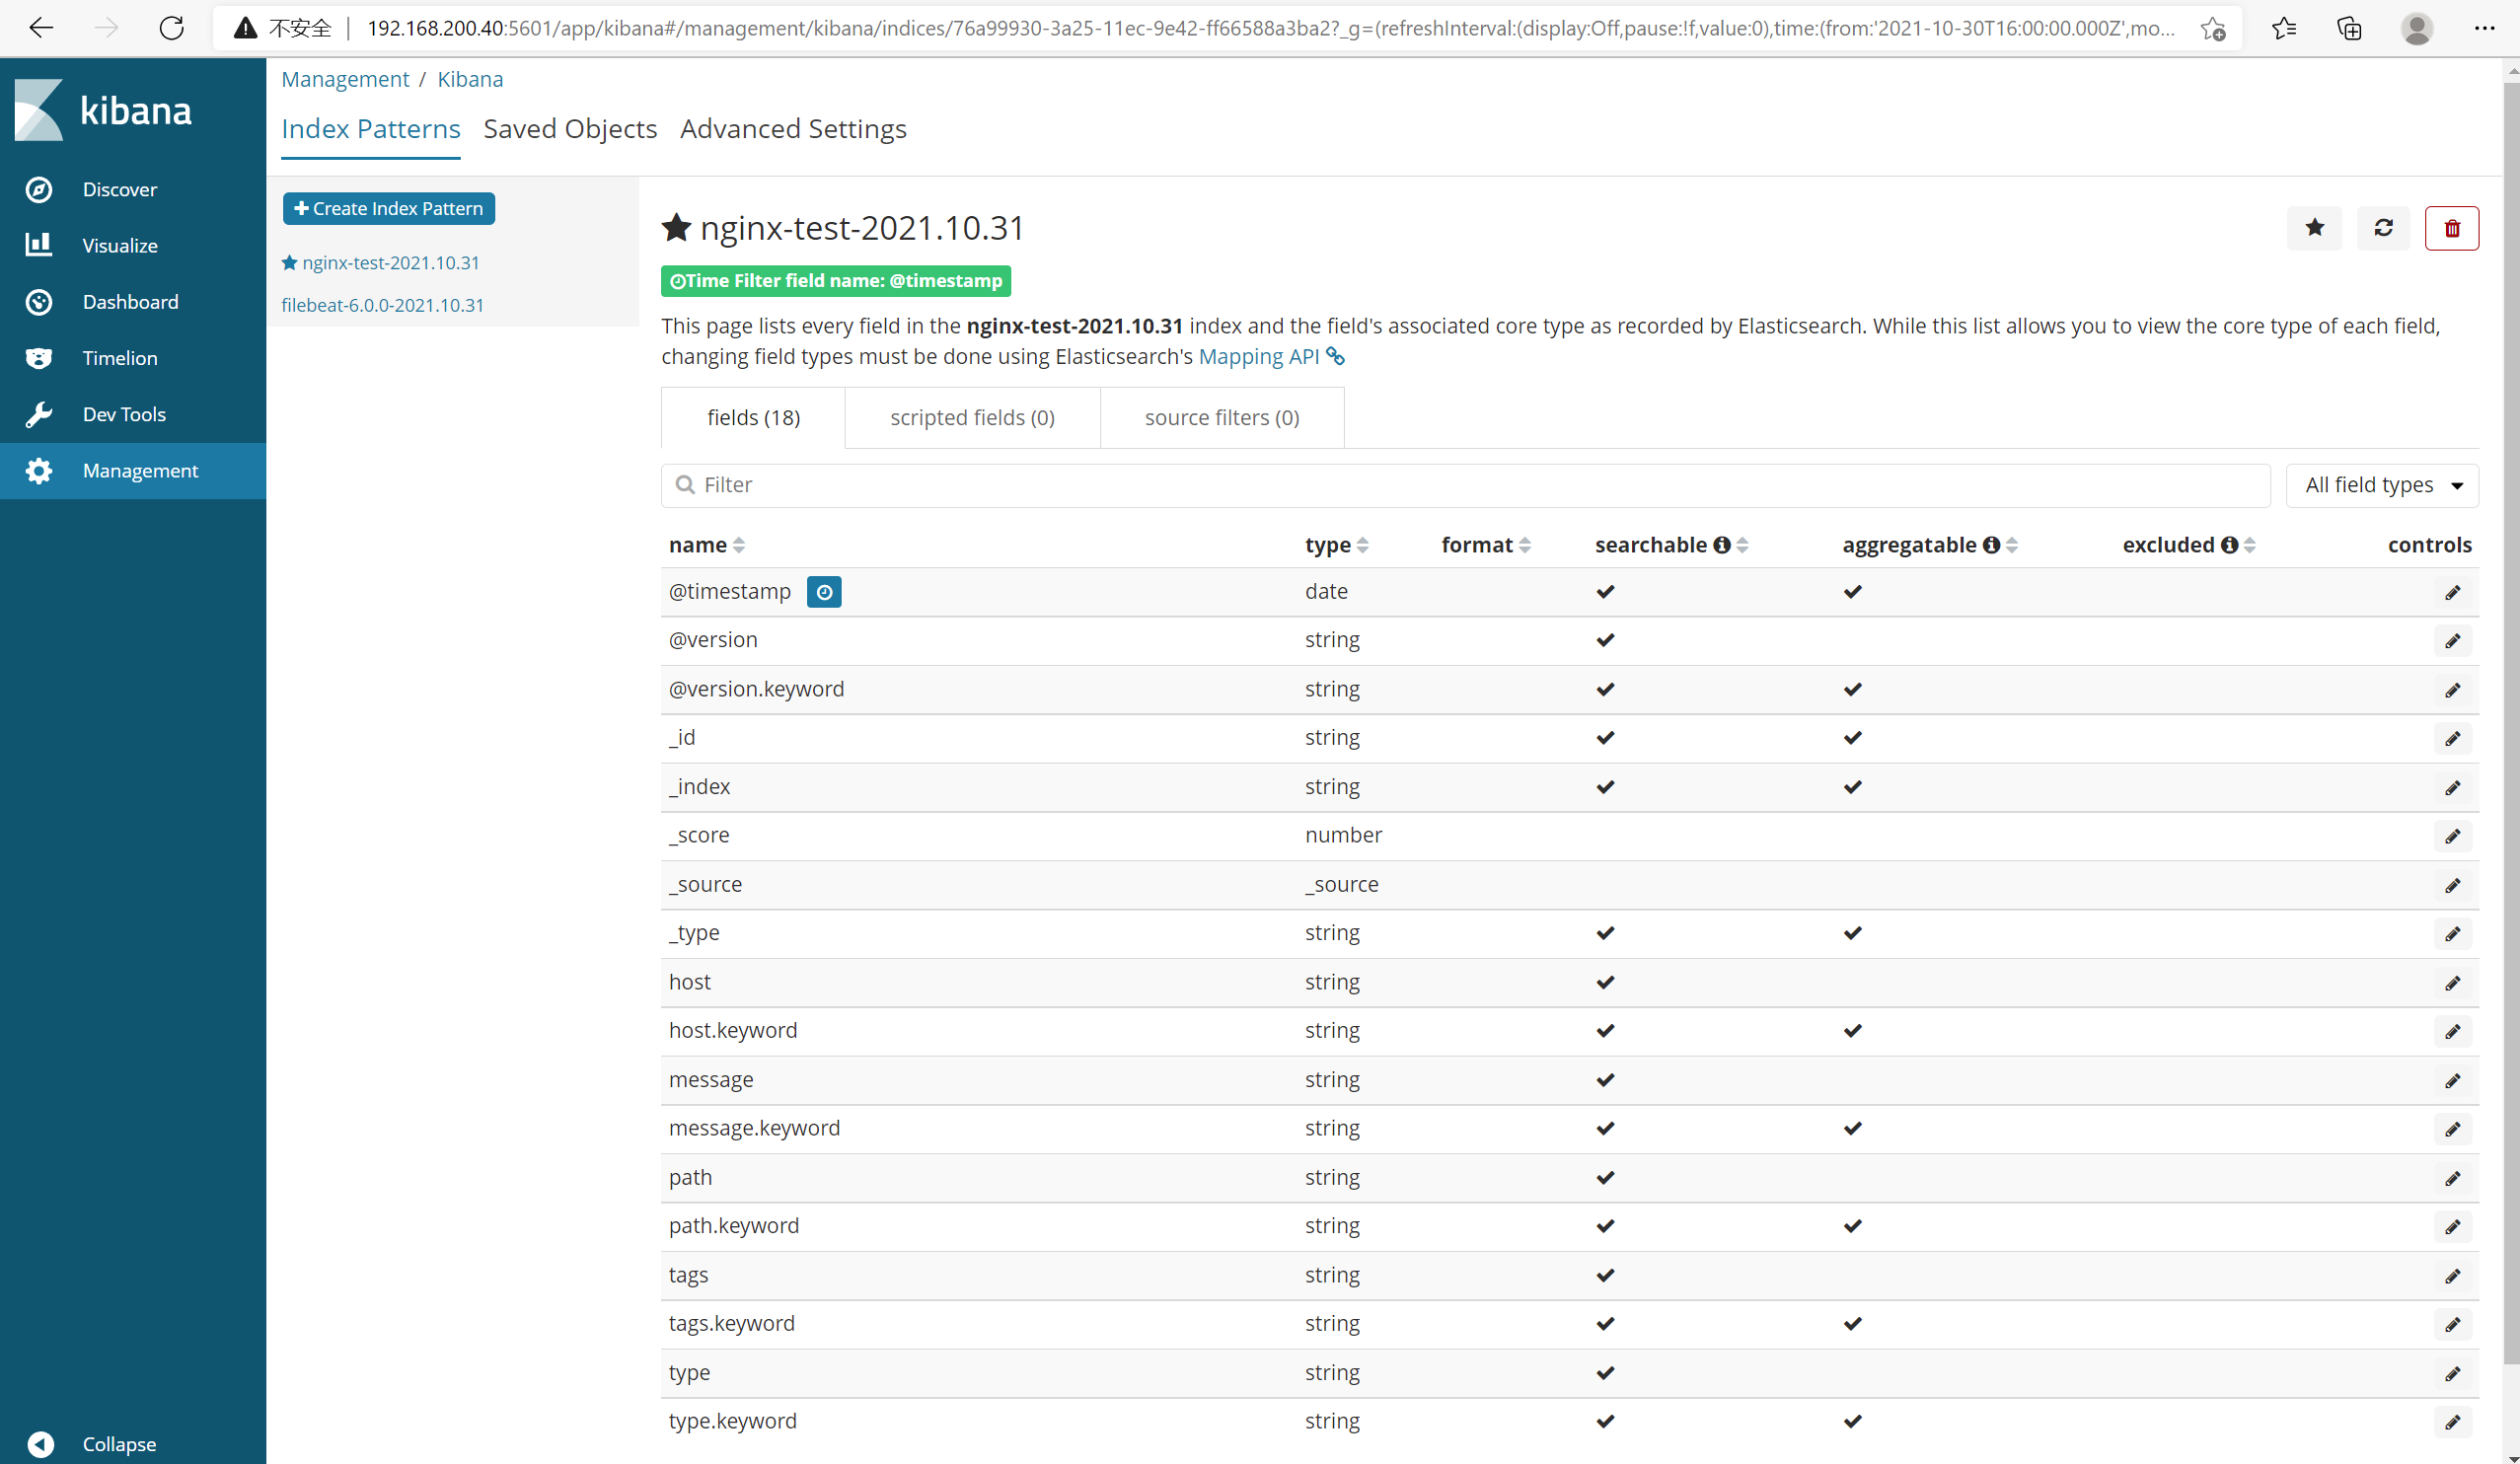

若有收获,就点个赞吧
0 人点赞
