https://github.com/oreillymedia/svg-essentials-examples
栅格及矢量
| 栅格 | 矢量 | |
|---|---|---|
| 本质 | 描述哪个方格应该填充什么颜色。 | 描述要绘制从某个点到另一个点的直线或曲线。 |
| 特点 | 不关心内容是什么。 | 是XML程序,信息被存储为纯文本,所以具有开放性、可移植性及可交互性。所有的文本都是可搜索的,可缩放而不损失图像质量。 |
| 适用场景 | 适合存储照片。 | 适合CAD等需要精确测量和放大绘图以便查看细节的程序。 |
我是一只猫
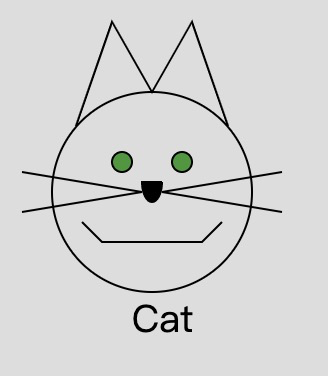
<?xml version='1.0'?><!DOCTYPE svg PUBLIC "-//W3C//DTD SVG1.1//EN" "http://www.w3.org/Graphics/SVG/1.1/DTD/svg11.dtd"><svg width='140' height='170'xmlns='http://www.w3.org/2000/svg'xmlns:xlink='http://www.w3.org/1999/xlink'><title>Cat</title><desc>Stick Figure of a Cat</desc><circle cx='70' cy='95' r='50' style='stroke: black; fill: none' /><circle cx='55' cy='80' r='5' stroke='black' fill='#339933' /><circle cx='85' cy='80' r='5' stroke='black' fill='#339933' /><g id='whiskers'><line x1='75' y1='95' x2='135' y2='85' style='stroke: black;' /><line x1='75' y1='95' x2='135' y2='105' style='stroke: black;' /></g><use xlink:href='#whiskers' transform='scale(-1 1) translate(-140 0)' /><polyline points='108 62, 90 10, 70 45, 50 10, 32 62' style="stroke: black; fill: none;" /><polyline points='35 110, 45 120, 95 120, 105 110' style="stroke: black; fill: none;" /><path d='M 75 90 L 65 90 A 5 10 0 0 0 75 90' style="stroke: black; fill: ffcccc;" /><text x='60' y='165' style='font-family:sans-serif; font-size: 14pt; stroke: none; fill: black;'>Cat</text></svg>
- 根元素
<svg>以像素为单位定义了整个图像的 width 和 height, 还通过 xmlns 属性定义了 SVG 的命名空间。- <title>的内容可被阅读器显示在标题栏上或者是作为鼠标指针指向图像时的提示,<desc>允许为图像定义完整的描述信息。- 坐标原点(0,0)为图像的左上角。
<circle>的属性指定中心点坐标(cx cy)及半径 r。<line>被包装在分组元素里面,通过指定起点(x1,y1)及终点(x2, y2)的方式绘制一条``直线。 <use>复用分组并变换坐标系统,首先在 scale 变换中对 x 坐标乘以-1,翻转了坐标系统。这意味着原始坐标系统中的点 (75,95) 现在位于 (-75,95) 。在新的坐标系统中,向左移动会使坐标增大。意味着必须将坐标系统向右translate(平移)140个像素(负值,才能将它们移到目标位置。<polyline>接受 (x,y) 代表一个点作为 points 属性的值,用来绘制耳朵和嘴这样的折线。<path>绘制鼻子,移动到坐标 (75,90),绘制一条到(65,90)的直线,然后以x半径为5,y半径为10绘制一个椭圆,最后回到坐标(75,90)处。<text>是一个容器元素,内容是你想要显示的文本,(x,y)用于指定文本的位置。
集成 HTML

若有收获,就点个赞吧
0 人点赞
