第一章
- 在设置 canvas 的宽度和高度时,不能使用 px 后缀
- 默认的 canvas 元素的大小是 300 * 150 个屏幕像素
const canvas = document.createElement('canvas');const ctx = canvas.getContext('2d');ctx.font = '38px Arial';ctx.fillStyle = 'cornflowerblue';ctx.strokeStyle = 'blue';ctx.fillText('Hello Canvas', canvas.width/2 -150, canvas.height/2 + 15);ctx.strokeText('Hello Canvas', canvas.width/2 -150, canvas.height/2 + 15);
- canvas 元素实际上有两套尺寸
- CSS设定宽高:只会改变元素本身的大小
- 设置元素的 width 与 height:同时修改“元素本身的大小”和“元素绘图表面的大小”。当 canvas “元素的大小”不符合”元素绘图表面的大小“时,浏览器会对绘图表面进行缩放,使其符合元素的大小。
| 属性 | 描述 |
|---|---|
| getContext() | 返回context。每个 canvas 元素均有一个这样的环境对象,且每个环境对象均与一个 canvas 元素相关联。 |
| toDataURL([type,quality]) | 返回 data URL。可设定为 img 元素的 src 属性值。 type:指定图像的类型,如 image/jpeg 或 image/png, 默认 image/png quality: 0-1.0 之间的 double 值,表示图像的显示质量 |
| toBlob(cb, type, args…) | cb: 浏览器会以一个指向 blob 的引用为参数,去调用该回调函数 type: 同楼上 args:同楼上quality |
context
| 属性 | 简介 |
|---|---|
| canvas | 指向 context 所属的 canvas 对象。 可通过 context.canvas.width, context.canvas.height 来获取 canvas 的宽度与高度 |
| fillstyle | 指定 context 在后续的图形填充操作中所使用的颜色、渐变色或图案 |
| font | 指定 context 执行 fillText() 或 strokeText() 时,所使用的字型 |
| globalAlpha | 全局透明度设定。取值在 0(完全透明)-1.0 之间 |
| globalCompositeOperation | 决定浏览器某个物体绘制在其他物体之上时,所采用的绘制方式。 |
| lineCap | 决定浏览器如何绘制线段的端点。 [butt, round, square], 默认 butt |
| lineWidth | 决定了在 canvas 中绘制线段的屏幕像素宽度。 默认值:1.0 |
| lineJoin | 决定浏览器在两条线段相交时如何绘制焦点。 [bevel,round,miter],默认 miter |
| miterLimit | 决定浏览器如何绘制 miter 形式的线段焦点。 |
| shadowBlur | 决定浏览器该如何延伸阴影效果。值越高,阴影效果延伸的就越远。 该值不是指阴影的像素长度,而是代表高斯模糊方程式中的参数值。 默认值是0 |
| shadowColor | 决定浏览器用何种颜色绘制阴影。 通常采用半透明色作为该属性的值。 |
| shadowOffsetX | 指定阴影效果水平方向偏移量,以 px 为单位 |
| shadowOffsetY | 指定阴影效果垂直方向偏移量 |
| strokeStyle | 指定对路径进行描边时所用的绘制风格。该值可被设定为某个颜色、渐变色或图案 |
| textAlign | 决定了以 fillText()或 strokeText()方法进行绘制时,所画文本的水平对齐方式 |
| textBaseline | 决定了以 fillText()或 strokeText()方法进行绘制时,所画文本的垂直对齐方式 |
| save() | 将当前 canvas 的状态推送到一个保存 canvas 状态的堆栈顶部。 canvas 状态包括了当前的坐标变换信息、剪辑区域以及所有context的所有属性。 canvas 状态并不包括当前的路径或位图。只能通过调用 beginPath() 来重置路径。 位图是canvas 本身的一个属性,并不属于 context,但仍然可以通过 context.getImageData() 来访问它。 |
| restore() | 将 canvas 状态堆栈顶部的条目弹出, 原来保存于栈顶的那一组状态,在弹出之后,就被设置成 canvas 的当前状态了。 因此,在调用 save() 与 restore() 之间,对 canvas 状态所进行的更改,其效果只会持续至 restore()方法被调用之前。 |
| fillText(text, x, y [, maxWidth]) | 绘制字符的轮廓 |
兼容性
支持 IE9-
- explorecanvas
- Google Chrome Frame
性能
在执行到某几行特定的代码时开始分析,在执行完后就停止分析
console.profile('Core HTML5 Animation, erasing the background');//. ..console.profileEnd();
- Profiler
- Timeline
- jsPerf.com
基本绘制制作(时钟)
制作一个时钟案例:
console.log('loaded');const node = document.getElementById('app');const canvas = document.createElement('canvas');canvas.id = 'canvas';const ctx = canvas.getContext('2d');ctx.font = '38px Arial';ctx.fillStyle = 'red';ctx.strokeStyle = 'red';console.log("canvas.width:", canvas.width, "canvas.height", canvas.height)// ctx.fillText('Hello Canvas', canvas.width/2 -150, canvas.height/2 + 15);// ctx.strokeText('Hello Canvas', canvas.width/2 -150, canvas.height/2 + 15);const FONT_HEIGHT = 15;const MARGIN = 35;const HAND_TRUNCTION = canvas.width / 25;const HOUR_HAND_TRUNCATION = canvas.width / 10;const NUMERAL_SPACING = 20;const RADIUS = canvas.width/2 - MARGIN; // 半径const HAND_RADIUS = RADIUS + NUMERAL_SPACINGconst drawCircle = () => {ctx.beginPath();ctx.arc(canvas.width/2, canvas.height/2, RADIUS, 0, Math.PI * 2, true);ctx.stroke();}const drawNumerals = () => {const numerals = [1, 2, 3, 4, 5, 6, 7, 8, 9, 10, 11, 12];ctx.font = FONT_HEIGHT + 'px Arial';let angle = 0;let numeralWidth = 0;numerals.forEach((numeral) => {angle = Math.PI/6 * (numeral - 3);numeralWidth = ctx.measureText(numeral).width;ctx.fillText(numeral,canvas.width/2 + Math.cos(angle)*(HAND_RADIUS) - numeralWidth/2,canvas.height/2 + Math.sin(angle)*(HAND_RADIUS) - FONT_HEIGHT/3,)});}const drawCenter = () => {ctx.beginPath();ctx.arc(canvas.width/2, canvas.height/2, 5, 0, Math.PI*2, true);ctx.fill();}const drawHand = (loc, isHour) => {const angle = (Math.PI*2) * (loc/60) - Math.PI/2;const handRadius = isHour ? RADIUS - HAND_TRUNCTION - HOUR_HAND_TRUNCATION : RADIUS - HAND_TRUNCTION;ctx.moveTo(canvas.width/2,canvas.height/2);ctx.lineTo(canvas.width/2 + Math.cos(angle)*handRadius,canvas.height/2 + Math.sin(angle)*handRadius,);ctx.stroke()}const drawHands = () => {const date = new Date;let hour = date.getHours();hour = hour > 12 ? hour - 12 : hour;drawHand(hour*5 + (date.getMinutes()/60)*5, true, 0.5);drawHand(date.getMinutes(), false, 0.5);drawHand(date.getSeconds(), false, 0.2);}const drawClock = () => {ctx.clearRect(0, 0, canvas.width, canvas.height);drawNumerals();drawCircle();drawCenter();drawHands();}drawClock()const loop = setInterval(drawClock, 1000);node.append(canvas)
事件
监听事件有两种方式:区别是 addEventListener 可以同时监听多个事件。
canvas.onmousedown = function (e) {console.log('mousedown');}canvas.addEventListener('mousedown', (e) => console.log('mousedown'));
鼠标事件
- mousemove
- mouseup
- mouseout
键盘事件
canvas 是一个不可获取焦点的元素,即无法监听键盘事件,只能通过document或window对象添加键盘事件监听器。
- keydown
- keypress
- keyup
keycode 参考列表:https://developer.mozilla.org/zh-CN/docs/Web/API/KeyboardEvent/keyCode
获取可打印字符,浏览器只会在产生可打印字符时才会触发 keypress 事件:
document.addEventListener('keypress', (e) => {const key = String.fromCharCode(e.which);console.log('key', key, e.keyCode)})
触摸事件
转换坐标
浏览器监听的鼠标坐标是窗口坐标(window coordinate), 而非相对于 canvas 的坐标,可以进行相应的转换。
const windowToCanvas = (canvas, x, y) => {// 获取canvas的边界框(bounding box)const bbox = canvas.getBoundingClientRect();console.log('bbox', bbox);// 当canvas元素大小与绘图表面大小不相符时,对坐标进行缩放return {x: x - bbox.left * (canvas.width / bbox.width),y: y - bbox.top * (canvas.height / bbox.height)};}canvas.onmousemove = (e) => {const loc = windowToCanvas(canvas, e.clientX, e.clientY);console.log('onmousemove', 'loc', loc)}
canvas: 立即模式(immediate-mode),立刻将指定的内容绘制上去,然后忘记刚才绘制的内容,即canvas不会包含将要绘制的图形对象列表。是直接向屏幕上绘制的。更适合制作“绘画APP”,因为不需要跟踪记录用户所绘制的东西。
SVG: 保留模式(retained-mode):会维护一份所绘图形对象的列表。更适合制作“画图APP”,可以让用户操作其所创建的图形对象。
将HTML定位到Canvas上

<div id="app"><div id="glasspane"><h2 class="title">Bouncing Balls</h2><p>One hundred balls bouncing</p><a href="" id="startButton">Start</a></div></div>
const node = document.getElementById('app');const canvas = document.createElement('canvas');canvas.id = 'canvas';canvas.height = 320;node.append(canvas)
body {background: #ddd;}#canvas {margin-left: 10px;margin-top: 10px;background: #fff;border: thin solid #aaa;}#glasspane {position: absolute;left: 50px;top: 50px;padding: 0 20px 10px 10px;background: rgba(0, 0, 0, 0.3);border: thin solid rgba(0, 0, 0, 0.6);color: #eee;font-family: sans-serif;font-style: 12px;cursor: pointer;box-shadow: rgba(0, 0, 0, 0.5) 5px 5px 20px;}#glasspane h2 {font-weight: normal;}#glasspane .title {font-size: 2em;color: rgba(255, 255, 0, 0.8);}#glasspane a:hover {color: yellow;}#glasspane a {text-decoration: none;color: #ccc;font-style: 3.5em;}#glasspane p {margin: 10px;color: rgba(65, 65, 220, 1.0);font-style: 12pt;font-family: sans-serif;}
橡皮筋式选取框(Rubberbanding)
起初,canvas显示一张图片,当选定图像的某一部分时,应用程序会将你选取的部分放大。
<div id="app"><div id="controls"><input type="button" id='resetButton' value="Reset"></div><div id="rubberbandDiv"></div></div>
// 橡皮筋式选取框 startconst rubberbandDiv = document.getElementById('rubberbandDiv');const resetBtn = document.getElementById('resetButton')const image = new Image()const mousedown = {}let rubberbandRectangle = {}let dragging = falseconst moveRubberbandDiv = () => {console.log('moveRubberbandDiv')rubberbandDiv.style.top = rubberbandRectangle.top + 'px';rubberbandDiv.style.left = rubberbandRectangle.left + 'px';}const resizeRubberbandDiv = () => {console.log('resizeRubberbandDivs')rubberbandDiv.style.width = rubberbandRectangle.width + 'px';rubberbandDiv.style.height = rubberbandRectangle.height + 'px';}const showRubberbandDiv = () => {console.log('showRubberbandDiv')rubberbandDiv.style.display = 'inline';}const hideRubberbandDiv = () => {console.log('hideRubberbandDiv')rubberbandDiv.style.display = 'none';}const resetRubberbandRectangle = () => {console.log('resetRubberbandRectangle')rubberbandRectangle = {top : 0,left: 0,width: 0,height: 0};}// 将 DIV 元素的左上角移动到鼠标按下的地点,并使 DIV 元素可见const rubberbandStart = (x, y) => {console.log('rubberbandStart')mousedown.x = x;mousedown.y = y;rubberbandRectangle.left = mousedown.x;rubberbandRectangle.top = mousedown.y;moveRubberbandDiv()showRubberbandDiv()dragging = true;}// 会对 DIV 元素进行移动和缩放操作const rubberbandStretch = (x, y) => {console.log('rubberbandStretch')rubberbandRectangle.left = x < mousedown.x ? x : mousedown.x;rubberbandRectangle.top = y < mousedown.y ? y : mousedown.y;rubberbandRectangle.width = Math.abs(x - mousedown.x);rubberbandRectangle.height = Math.abs(y - mousedown.y);moveRubberbandDiv()resizeRubberbandDiv()}// 把选中的那部分图像放大,并绘制出来,同时将 DIV 隐藏const rubberbandEnd = () => {console.log('rubberbandEnd')const bbox = canvas.getBoundingClientRect();try {ctx.drawImage(canvas,rubberbandRectangle.left - bbox.left,rubberbandRectangle.top - bbox.top,rubberbandRectangle.width,rubberbandRectangle.height,0,0,canvas.width,canvas.height)} catch (e) {// suppress error message when mouse is released// outside the canvas}resetRubberbandRectangle()rubberbandDiv.style.width = 0;rubberbandDiv.style.height = 0;hideRubberbandDiv()dragging = false;}canvas.onmousedown = (e) => {// console.log('canvas.onmousemove')const x = e.clientX;const y = e.clientY;e.preventDefault();rubberbandStart(x, y);}window.onmousemove = (e) => {// console.log('window.onmousemove')const x = e.clientX;const y = e.clientY;e.preventDefault()if (dragging) {rubberbandStretch(x, y);}}window.onmouseup = (e) => {// console.log('window.onmouseup')e.preventDefault()rubberbandEnd()}image.onload = () => {console.log('image_onload')ctx.drawImage(image, 0, 0, canvas.width, canvas.height);}resetBtn.onClick = (e) => {ctx.clearRect(0, 0, ctx.canvas.width, ctx.canvas.height);ctx.drawImage(image, 0, 0, canvas.width, canvas.height);}image.src = '//img.08087.cc/uploads/20190113/18/1547376816-OosHLDBkeP.jpg'// 橡皮筋式选取框 End
使用 toDataURL() 将 canvas 的内容打印出来
<div id="controls"><input type="button" id="snapshotButton" value="Take snapshots"></div><img src="" alt="" id="snapshotImageElement">
const snapshotBtn = document.getElementById('snapshotButton');const snapshotImgElm = document.getElementById('snapshotImageElement');let loop2 = '';snapshotBtn.onclick = (e) => {let dataUrl = '';if (snapshotBtn.value === 'Take snapshots') {dataUrl = canvas.toDataURL();clearInterval(loop2);snapshotImgElm.src = dataUrl;snapshotImgElm.style.display = 'inline';canvas.style.display = 'none';snapshotBtn.value = 'Return to Canvas';} else {canvas.style.display = 'inline';snapshotImgElm.style.display = 'none';loop2 = setInterval(drawClock, 1000);snapshotBtn.value = 'Take snapshots'}}
数学知识
角度转弧度
180 度 =  弧度
弧度
注意:JS 中的 Math.sin()、Math.cos()、Math.tan() 采用的是弧度值,而非角度值。
第二章
需求描述:
- 对线条、弧形、圆、曲线及多边形进行描边与填充
- 通过设置绘图环境的属性来改变所绘图形的外观
- 绘制圆角矩形
- 绘制并编辑贝塞尔曲线
- 对 2d 绘制环境进行扩展,使之可以绘制虚线
- 使用纯色、渐变色及图案来对图形进行描边及填充
- 用阴影效果来模拟具有深度的立体图形效果
- 在不影响背景的情况下,使用“剪辑区域”技术来擦除图形与文本
- 实现橡皮筋式辅助线技术,以便让用户可以交互式地绘制图形
- 在 canvas 中拖动图形对象
- 坐标系统的变换
矩形

| 功能 | 方法 | 描述 |
|---|---|---|
| 清除 | clearRect(double x, double y, double w, double h) | 将指定矩形与当前剪辑区域相交范围内的所有像素清除。 在默认情况下,剪辑区域的大小就是整个 canvas。所以如果你没有改动剪辑区域的话,那么在参数所指范围内的所有像素都会被清除。 “清除像素”:指的是将其颜色设置为全透明的黑色。这在实际效果上就等同于“擦除”或者“清除”了某个像素,从而使得 canvas 的背景可以透过该像素显示出来。 |
| 描边 | strokeRect(double x, double y, double w, double h) | 使用如下属性,为指定的矩形描边: - strokeStyle - lineWidth - lineJoin - miterLimit |
如果宽度或高度有一个为0的话,那么该方法将会分别绘制一条竖线或横线。
如果均为0,则不会绘制任何东西。 |
| 填充 | fillRect(double x, double y, double w, double h) | 使用 fillStyle 属性填充指定的矩形。
如果宽度或高度为0,则不会进行任何绘制 |
| 功能 | 属性 |
|---|---|
| 描边色 | strokeStyle |
| 填充色 | fillStyle |
| 创造线性渐变 | CanvasGradient createLinearGradient( double x0, double y0, double x1, double y1 ) |
填充整个canvas,通过最后一个颜色来填充渐变线以外的区域。 参数表示渐变线的两个端点。 |
|---|---|---|
| 颜色停止点(color stop) | addColorStop(double x, string color) | |
| 创造放射渐变 | CanvasGradient createRadialGradient( double x0, double y0, double r0, double x1, double y1, double r1 ) |
填充范围仅限于两个圆形定义的圆锥区域 |
const node = document.getElementById('app');const canvas = document.createElement('canvas');canvas.id = 'canvas';canvas.height = 320;canvas.width = 600;const ctx = canvas.getContext('2d');ctx.lineJoin = 'round';ctx.lineWidth = 30;ctx.font = '24px Helvetica'ctx.fillText('Click anywhere to erase', 175, 40);ctx.strokeStyle = 'goldenrod'ctx.fillStyle = 'rgba(0, 0, 255, 0.5)'ctx.strokeRect(75, 100, 200, 200);ctx.fillRect(325, 100, 200, 200)
生成线性渐变色: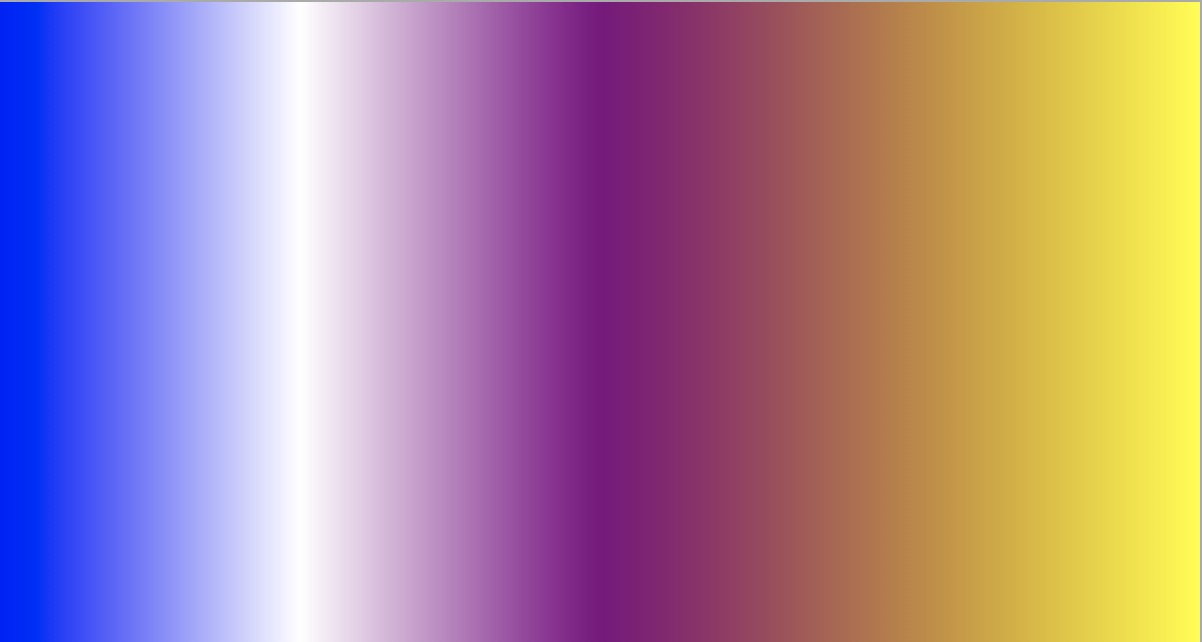
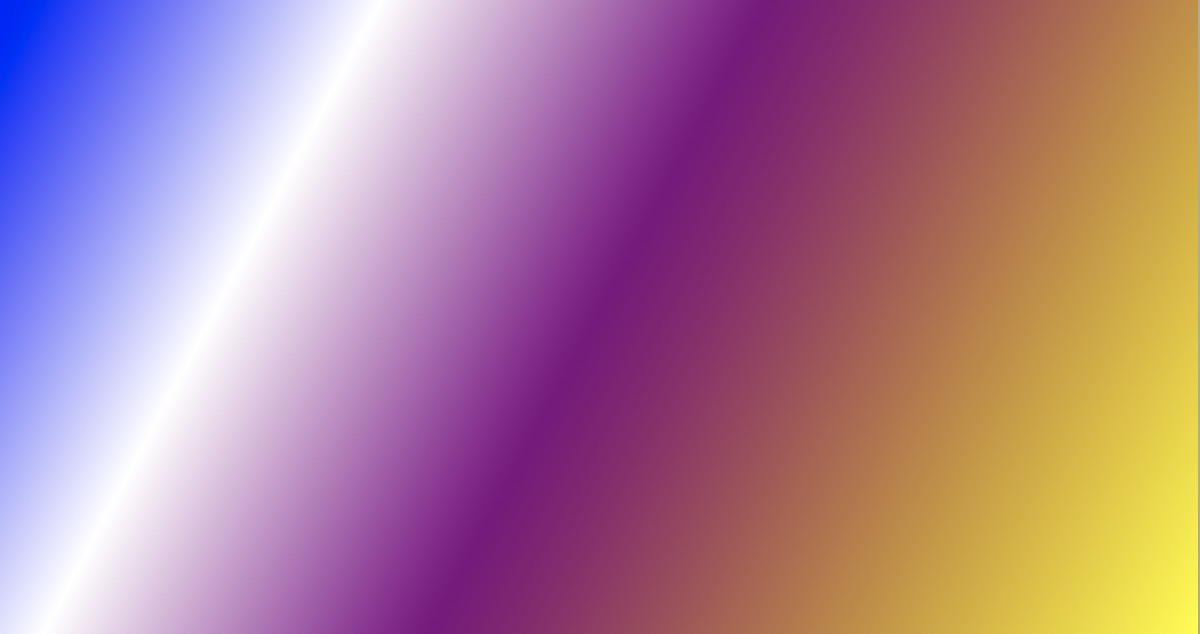
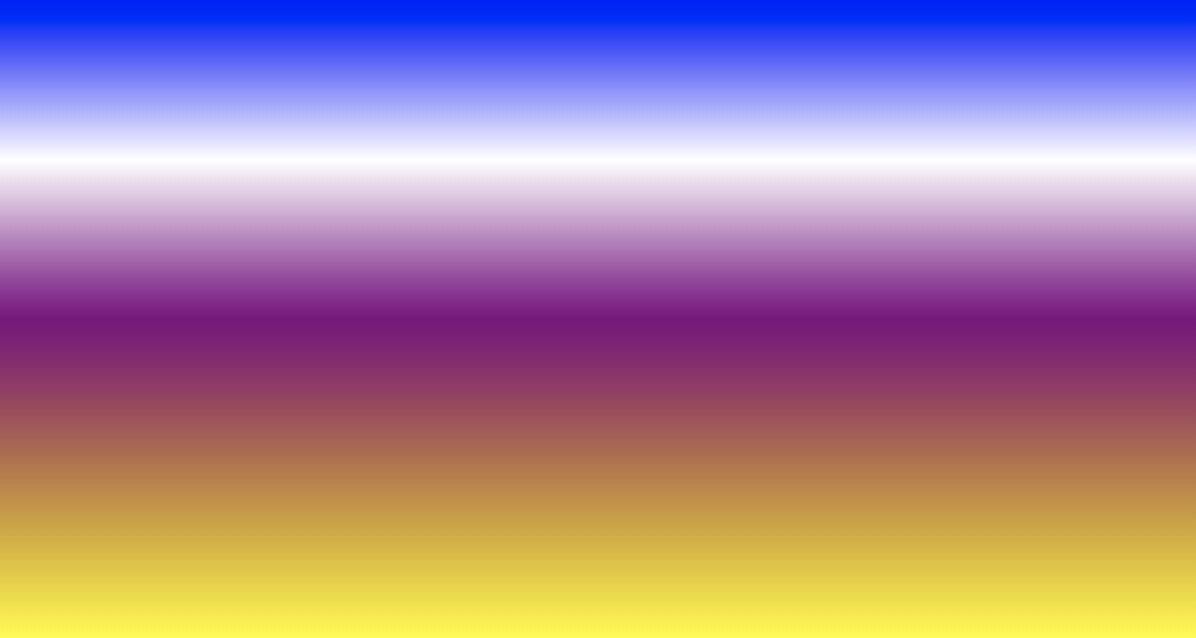
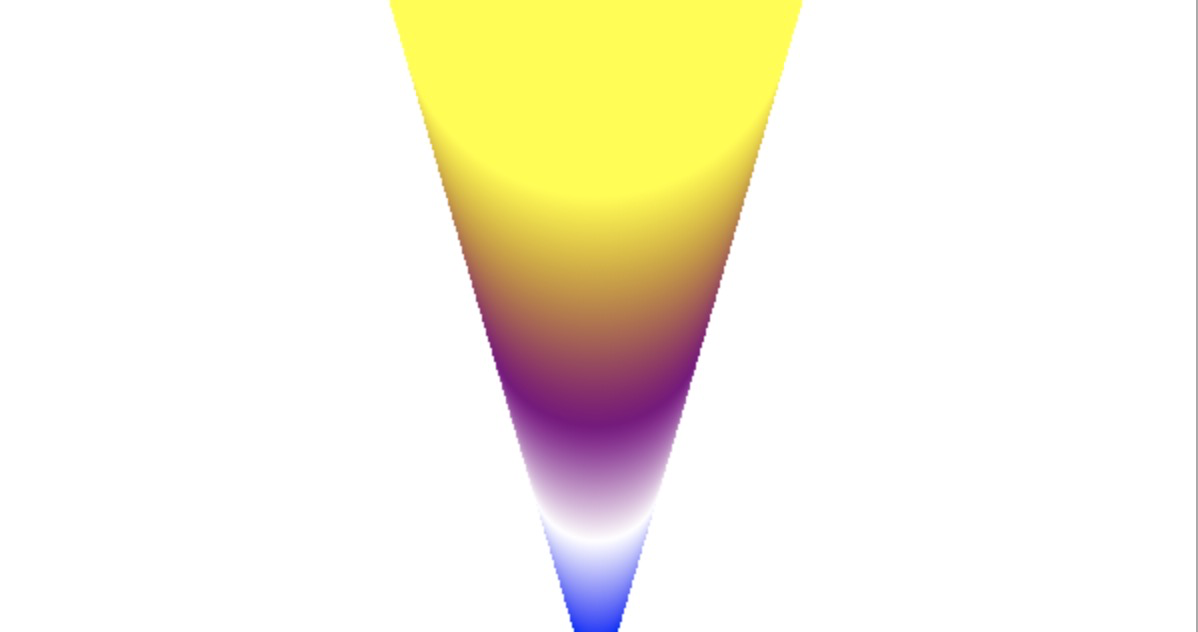
const gradient = ctx.createLinearGradient(0, 0, canvas.width, 0);// const gradient = ctx.createLinearGradient(0, 0, 0, canvas.height);// const gradient = ctx.createLinearGradient(0, 0, canvas.width, canvas.height);// const gradient = ctx.createLinearGradient(0, 0, 0, canvas.height/2);const gradient = ctx.createRadialGradient(canvas.width/2, canvas.height, 10,canvas.width/2, 0, 100)gradient.addColorStop(0, 'blue')gradient.addColorStop(0.25, 'white')gradient.addColorStop(0.5, 'purple')gradient.addColorStop(1, 'yellow')ctx.fillStyle = gradient;ctx.fillRect(0, 0, canvas.width, canvas.height)
图案填充
- image 元素
- canvas 元素
- video 元素
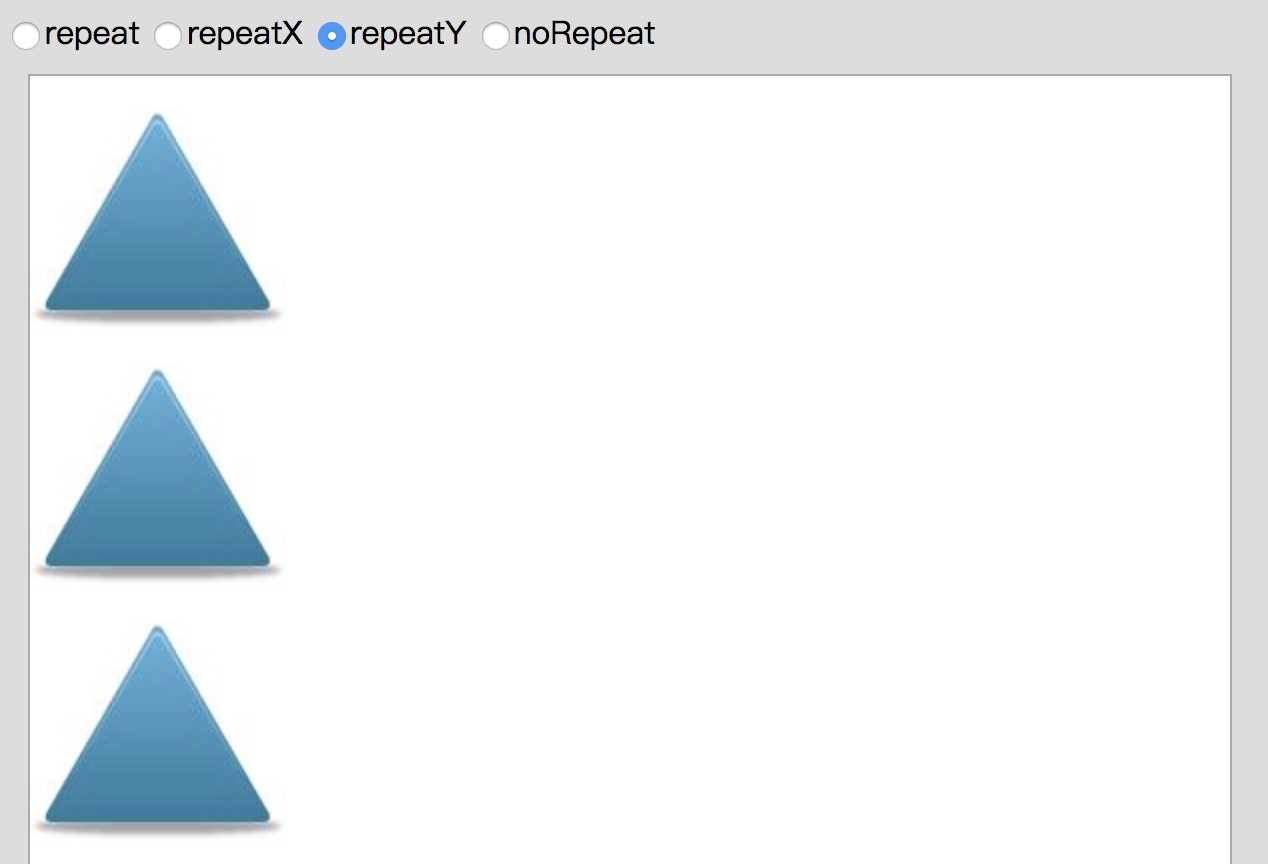
<div id="radios"><input type="radio" id="repeatRadio" name='patternRadio' checked>repeat<input type="radio" id="repeatXRadio" name='patternRadio'>repeatX<input type="radio" id="repeatYRadio" name='patternRadio'>repeatY<input type="radio" id="noRepeatRadio" name='patternRadio'>noRepeat</div>
canvas.height = 800const repeatRadio = document.getElementById('repeatRadio');const repeatXRadio = document.getElementById('repeatXRadio')const repeatYRadio = document.getElementById('repeatYRadio')const noRepeatRadio = document.getElementById('noRepeatRadio')const image = new Image()const fillCanvasWithPattern = (repeatString) => {const pattern = ctx.createPattern(image, repeatString)ctx.clearRect(0, 0, canvas.width, canvas.height)ctx.fillStyle = patternctx.fillRect(0, 0, canvas.width, canvas.height)ctx.fill()}repeatRadio.onclick = () => {fillCanvasWithPattern('repeat')}repeatXRadio.onclick = () => {fillCanvasWithPattern('repeat-x')}repeatYRadio.onclick = () => {fillCanvasWithPattern('repeat-y')}noRepeatRadio.onclick = () => {fillCanvasWithPattern('no-repeat')}image.src = '//timgsa.baidu.com/timg?image&quality=80&size=b9999_10000&sec=156878881309' +'9&di=47c2254fc9072d61558d5081bb94d45c&imgtype=0&src=http%3A%2F%2Fico.58pic.com%2' +'Ficonset01%2Fpretty-office-9-icons%2Fgif%2F319331.gif'image.width = '10px'image.height = '10px'image.onload = (e) => {fillCanvasWithPattern('repeat')}
阴影
shadowColor 不是全透明的,其余属性中,存在一个非0值:
| 属性 | 描述 |
|---|---|
| shadowColor | CSS3 格式的颜色。默认值是rgba(0, 0, 0, 0) |
| shadowOffsetX | 从图形或文本到阴影的水平像素偏移。默认值是0 |
| shadowOffsetY | 从图形或文本到阴影的垂直像素偏移。默认值是0 |
| shadowBlur | 一个与像素无关的值。该值被用于高斯模糊方程中,以便对阴影进行模糊化处理 |
路径

使用rect() 与 arc() 来创建路径,然后调用 stroke() 或 fill() 令其可见。
| 方法 | 描述 |
|---|---|
| rect( double x, double y, double width, double height) |
在坐标(x,y)处建立一个宽度为width、高度为height的矩形子路径。 该子路径是封闭的,而且总是按逆时针方向来创建。 |
| arc( double x, double y, double radius, double startAngle, double endAngle [, boolean anticlockwise]) |
在当前路径中增加一段表示圆弧或圆形的子路径。 可通过 boolean 值来控制该段子路径的方向。false(默认)为顺时针。 如果在调用该方法时已经有其他的子路径存在,那么arc()方法则会用一条线段把已有路径的终点与这段圆弧路径的起点连接起来。 |
| beginPath() | 将当前路径中的所有子路径都清除掉,以此来重置当前路径。 |
| closePath() | 显式地封闭某段开放路径。该方法用于封闭圆弧路径以及由曲线或线段所创建的开放路径。 |
| fill() | 使用 fillStyle 对当前路径的内部进行填充。 |
| stroke() | 使用 strokeStyle 来描绘当前路径的轮廓线。 |
const node = document.getElementById('app');const canvas = document.createElement('canvas');const ctx = canvas.getContext('2d');canvas.id = 'canvas';canvas.width = 1200canvas.height = 1000// 画笔样式ctx.font = '48pt Helvetica';ctx.strokeStyle = 'blue';ctx.fillStyle = 'red';ctx.lineWidth = '2'; // 设置线条宽度为 2// 文本ctx.strokeText('Stroke', 60, 110);ctx.fillText('Fill', 440, 110);ctx.strokeText('Stroke && Fill', 700, 110);ctx.fillText('Stroke && Fill', 700, 110);// 矩形ctx.lineWidth = '5' // 设置线条宽度为 5ctx.beginPath()ctx.rect(80, 150, 150, 100)ctx.stroke()ctx.beginPath()ctx.rect(400, 150, 150, 100)ctx.fill()ctx.beginPath()ctx.rect(750, 150, 150, 100)ctx.stroke()ctx.fill()// 开放弧形ctx.beginPath()ctx.arc(150, 370, 60, 0, Math.PI*3/2)ctx.stroke()ctx.beginPath()ctx.arc(475, 370, 60, 0, Math.PI*3/2)ctx.fill()ctx.beginPath()ctx.arc(820, 370, 60, 0, Math.PI*3/2)ctx.stroke()ctx.fill()// 封闭弧形ctx.beginPath()ctx.arc(150, 550, 60, 0, Math.PI*3/2)ctx.closePath()ctx.stroke()ctx.beginPath()ctx.arc(475, 550, 60, 0, Math.PI*3/2)ctx.closePath()ctx.fill()ctx.beginPath()ctx.arc(820, 550, 60, 0, Math.PI*3/2)ctx.closePath()ctx.stroke()ctx.fill()
非零环绕规则

有自我交叉情况的路径:对于路径中的任意给定区域,从该区域内部画一条足够长的线段,使此线段的终点完全落在路径范围之外。
将计数器初始化为 0,然后,每当这条线段与路径上的直线或曲线相交时,就改变计数器的值。如果是与路径的顺时针部分相交,则 +1,如果是与路径的逆时针部分相交,则 -1。若计数器的最终值不是 0,那么此区域就在路径里面,在调用fill()方法时,浏览器就会对其进行填充。如果最终值非0,那么此区域就不在路径内部,浏览器也就不会对其进行填充。
剪纸效果

为什么会有一根横线?
根据 Canvas 规范,当使用 arc() 方法向当前路径中增加子路径时,该方法必须将上一条子路径的终点与所画圆弧的起点相连。可以在调用 arc()前先调用 beginPath()。调用此方法会将当前路径下的所有子路径都清除掉。
const drawTwoArcs = () => {ctx.beginPath()// Outer: 逆时针ctx.arc(300, 190,150,0, Math.PI*2,false);// Inner: 顺时针ctx.arc(300, 190,100,0, Math.PI*2,true);ctx.fill()ctx.stroke()}const draw = () => {ctx.clearRect(0, 0, ctx.canvas.width, ctx.canvas.height);drawTwoArcs()}ctx.fillStyle = 'rgba(100, 140, 230, 0.5)'ctx.strokeStyle = ctx.fillStyle;draw()
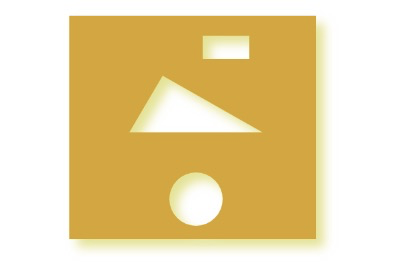
const node = document.getElementById('app');const canvas = document.createElement('canvas');const ctx = canvas.getContext('2d');canvas.id = 'canvas';canvas.height = 1000;const rect = (x, y, w, h, direction) => {if (direction) {// 顺时针ctx.moveTo(x, y)ctx.lineTo(x, y+h)ctx.lineTo(x + w, y + h)ctx.lineTo(x + w, y)} else {// 逆时针ctx.moveTo(x, y)ctx.lineTo(x+w, y)ctx.lineTo(x+w, y+h)ctx.lineTo(x, y+h)}ctx.closePath()}const addOuterRectPath = () => {ctx.rect(110, 25, 370, 335)}const addRectPath = () => {rect(310, 55, 70, 35, true)}const addCirclePath = () => {ctx.arc(300, 300, 40, 0, Math.PI*2, true)}const addTrianglePath = () => {ctx.moveTo(400, 200);ctx.lineTo(250, 115);ctx.lineTo(200, 200);ctx.closePath()}const drawCutouts = () => {ctx.beginPath()addOuterRectPath()addCirclePath()addRectPath()addTrianglePath()ctx.fill()}const draw = () => {ctx.clearRect(0, 0, ctx.canvas.width, ctx.canvas.height);ctx.shadowColor = 'rgba(200, 200, 0, 0.5)';ctx.shadowOffsetX = 12;ctx.shadowOffsetY = 12;ctx.shadowBlur = 15;drawCutouts()}ctx.fillStyle = 'goldenrod'draw()
线段
| 方法 | 描述 |
|---|---|
| moveTo(x, y) | 向当前路径中增加一条子路径,该子路径只包含一个点,就是由参数传入的那个点。该方法并不会从当前路径中清除任何子路径。 |
| lineTo(x, y) | 如果当前路径中没有子路径,那么这个方法的行为与moveTo() 一样:它会创建一条新的子路径,其中包含了经由参数所传入的那个点。如果当前路径中存在子路径,那么该方法会将你所指定的那个点加入子路径中。 |
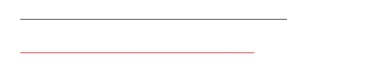
ctx.lineWidth = 1;ctx.beginPath()ctx.moveTo(50, 50)ctx.lineTo(450, 50)ctx.stroke()ctx.strokeStyle = 'red'ctx.beginPath()ctx.moveTo(50.5, 100)ctx.lineTo(400.5, 100)ctx.stroke()
网格

// 绘制网络const drawGrid = (ctx, color, stepx, stepy) => {ctx.strokeStyle = color;ctx.lineWidth = 0.5;for (let i = stepx+0.5; i < ctx.canvas.width; i+=stepx) {ctx.beginPath()ctx.moveTo(i, 0)ctx.lineTo(i, ctx.canvas.width)ctx.stroke()}for (let i = stepy+0.5; i < ctx.canvas.height; i+=stepy) {ctx.beginPath()ctx.moveTo(0, i)ctx.lineTo(ctx.canvas.width, i)ctx.stroke()}}drawGrid(ctx, 'lightgray', 10, 10)
坐标轴

// 绘制坐标轴const AXIS_MARGIN = 40;const AXIS_ORIGIN = {x: AXIS_MARGIN,y: canvas.height - AXIS_MARGIN,}const AXIS_TOP = AXIS_MARGIN;const AXIS_RIGHT = canvas.width - AXIS_MARGIN;const HORIZONTAL_TICK_SPACING = 10;const VERTICAL_TICK_SPACING = 10;const AXIS_WIDTH = AXIS_RIGHT - AXIS_ORIGIN.x;const AXIS_HEIGHT = AXIS_ORIGIN.y - AXIS_TOP;const NUM_VERTICAL_TICKS = AXIS_HEIGHT / VERTICAL_TICK_SPACING;const NUM_HORIZONTAL_TICKS = AXIS_WIDTH / HORIZONTAL_TICK_SPACING;const TICK_WIDTH = 10;const TICKS_LINEWIDTH = 0.5;const TICKS_COLOR = 'navy';const AXIS_LINEWIDTH = 1.0;const AXIS_COLOR = 'blue';const drawAxes = () => {ctx.save();ctx.strokeStyle = AXIS_COLOR;ctx.lineWidth = AXIS_LINEWIDTH;drawHorizontalAxis()drawVertialAxis()ctx.lineWidth = TICKS_LINEWIDTHctx.strokeStyle = TICKS_COLORdrawHorizontalAxisTicks()drawVerticalAxisTicks()ctx.restore()}const drawHorizontalAxis = () => {ctx.beginPath()ctx.moveTo(AXIS_ORIGIN.x, AXIS_ORIGIN.y)ctx.lineTo(AXIS_RIGHT, AXIS_ORIGIN.y)ctx.stroke()}const drawVertialAxis = () => {ctx.beginPath()ctx.moveTo(AXIS_ORIGIN.x, AXIS_ORIGIN.y)ctx.lineTo(AXIS_ORIGIN.x, AXIS_TOP)ctx.stroke()}const drawHorizontalAxisTicks = () => {let deltaX = '';for (let i = 1; i < NUM_HORIZONTAL_TICKS; ++i) {ctx.beginPath()if (i % 5 === 0) {deltaX = TICK_WIDTH;} else {deltaX = TICK_WIDTH / 2;}ctx.moveTo(AXIS_ORIGIN.x + i * HORIZONTAL_TICK_SPACING,AXIS_ORIGIN.y - deltaX);ctx.lineTo(AXIS_ORIGIN.x + i * HORIZONTAL_TICK_SPACING,AXIS_ORIGIN.y + deltaX);ctx.stroke()}}const drawVerticalAxisTicks = () => {let deltaY = '';for (let i = 1; i < NUM_HORIZONTAL_TICKS; ++i) {ctx.beginPath()if (i % 5 === 0) {deltaY = TICK_WIDTH;} else {deltaY = TICK_WIDTH / 2;}ctx.moveTo(AXIS_ORIGIN.x - deltaY,AXIS_ORIGIN.y - i * VERTICAL_TICK_SPACING);ctx.lineTo(AXIS_ORIGIN.x + deltaY,AXIS_ORIGIN.y - i * VERTICAL_TICK_SPACING);ctx.stroke()}}drawAxes()
涂鸦线条绘制
const eraseAllButton = document.getElementById('eraseAllButton');const strokeStyleSelect = document.getElementById('strokeStyleSelect');const guidewireCheckbox = document.getElementById('guidewireCheckbox');let drawingSurfaceImageData = '';const mousedown = {};const rubberbandRect = {};let dragging = false;let guidewires = guidewireCheckbox.checked;const saveDrawingSurface = () => {drawingSurfaceImageData = ctx.getImageData(0, 0, canvas.width, canvas.height);}const restoreDrawingSurface = () => {ctx.putImageData(drawingSurfaceImageData, 0, 0);}const updateRubberbandRect = (loc) => {rubberbandRect.width = Math.abs(loc.x - mousedown.x);rubberbandRect.height = Math.abs(loc.y - mousedown.y);if (loc.x > mousedown.x) {rubberbandRect.left = mousedown.x;} else {rubberbandRect.left = loc.x;}if (loc.y > mousedown.y) {rubberbandRect.top = mousedown.y;} else {rubberbandRect.top = loc.y;}}const drawRubberbandShape = (loc) => {ctx.beginPath()ctx.moveTo(mousedown.x, mousedown.y)ctx.lineTo(loc.x, loc.y)ctx.stroke()}const updateRubberband = (loc) => {updateRubberbandRect(loc);drawRubberbandShape(loc);}const drawHorizontalLine = (y) => {ctx.beginPath()ctx.moveTo(0, y + 0.5)ctx.lineTo(ctx.canvas.width, y+0.5)ctx.stroke()}const drawVerticalLine = (x) => {ctx.beginPath()ctx.moveTo(x+0.5, 0)ctx.lineTo(x+0.5, ctx.canvas.height)ctx.stroke()}const drawGuidewires = (x, y) => {ctx.save()ctx.strokeStyle = 'rgba(0, 0, 230, 0.4)'ctx.lineWidth = 0.5drawVerticalLine(x)drawHorizontalLine(y)ctx.restore()}canvas.onmousedown = (e) => {let loc = windowToCanvas(canvas, e.clientX, e.clientY);e.preventDefault()saveDrawingSurface()mousedown.x = loc.x;mousedown.y = loc.y;dragging = true;}canvas.onmousemove = (e) => {let loc = {};if (dragging) {e.preventDefault()loc = windowToCanvas(canvas, e.clientX, e.clientY);restoreDrawingSurface()updateRubberband(loc)if (guidewires) {drawGuidewires(loc.x, loc.y);}}}canvas.onmouseup = (e) => {let loc = windowToCanvas(canvas, e.clientX, e.clientY);restoreDrawingSurface()updateRubberband(loc)dragging = false}eraseAllButton.onclick = (e) => {ctx.clearRect(0, 0, canvas.width, canvas.height);saveDrawingSurface()}strokeStyleSelect.onchange = (e) => {ctx.strokeStyle = strokeStyleSelect.value;}guidewireCheckbox.onchange = (e) => {guidewires = guidewireCheckbox.checked;}ctx.strokeStyle = strokeStyleSelect.value;
虚线
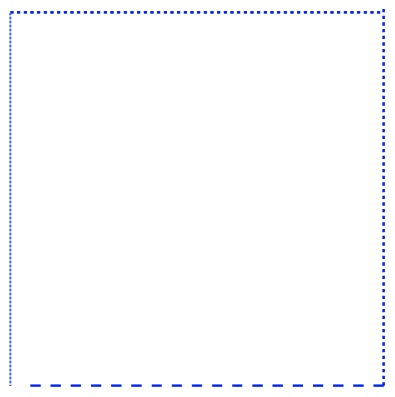
const drawDashedLine = (ctx, x1, y1, x2, y2, dashLength=5) => {const deltaX = x2 - x1;const deltaY = y2 - y1;const numDashes = Math.floor(Math.sqrt(Math.pow(deltaX, 2) + Math.pow(deltaY, 2)) / dashLength);for (let i = 0; i < numDashes; ++i) {ctx[i%2 === 0 ? 'moveTo' : 'lineTo'](x1 + (deltaX/numDashes)*i, y1 + (deltaY / numDashes) * i);}ctx.stroke();}ctx.lineWidth = 3;ctx.strokeStyle = 'blue';drawDashedLine(ctx,20,20,ctx.canvas.width - 20,20);drawDashedLine(ctx,ctx.canvas.height - 20,ctx.canvas.width - 20,ctx.canvas.height - 20,10);drawDashedLine(ctx,ctx.canvas.width - 20,ctx.canvas.height - 20,20,ctx.canvas.height - 20,15);drawDashedLine(ctx,20,ctx.canvas.height - 20,20,20,1);
扩展 CanvasRenderingContext2D 对象
const moveToFunction = CanvasRenderingContext2D.prototype.moveTo;CanvasRenderingContext2D.prototype.lastMoveToLocation = {};CanvasRenderingContext2D.prototype.moveTo = (x, y) => {moveToFunction.apply(ctx, [x, y]);this.lastMoveToLocation.x = x;this.lastMoveToLocation.y = y;}CanvasRenderingContext2D.prototype.dashedLineTo = (x, y, dashLength=5) => {const startX = this.lastMoveToLocation.x;const startY = this.lastMoveToLocation.y;const deltaX = x - startX;const deltaY = y - startY;const numDashes = Math.floor(Math.sqrt(Math.pow(deltaX) + Math.pow(deltaY)) / dashLength);for (let i = 0; i < numDashes; ++i) {this[i % 2 === 0 ? 'moveTo' : 'lineTo'](startX + (deltaX / numDashes) * i, startY + (deltaY / numDashes) * i);}this.moveTo(x, y);}ctx.lineWidth = 3;ctx.strokeStyle = 'blue';ctx.moveTo(20, 20)ctx.dashedLineTo(ctx,20,20,ctx.canvas.width - 20,20);ctx.dashedLineTo(ctx,ctx.canvas.height - 20,ctx.canvas.width - 20,ctx.canvas.height - 20,10);ctx.dashedLineTo(ctx,ctx.canvas.width - 20,ctx.canvas.height - 20,20,ctx.canvas.height - 20,15);ctx.dashedLineTo(ctx,20,ctx.canvas.height - 20,20,20,1);
线帽与连接点
| 属性 | 描述 | 类型 | 取值范围 |
|---|---|---|---|
| lineWidth | 以像素为单位的线段宽度 | double | 非0正数,默认值 1.0 |
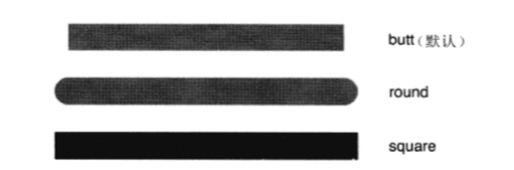
| lineCap | 决定浏览器如何绘制线段的端点 | DOMString | butt(默认值) round square |
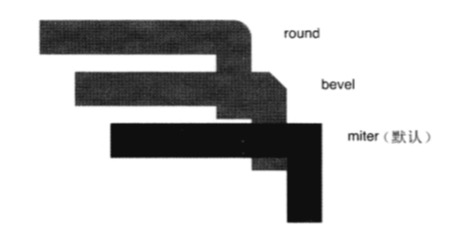
| lineJoin | 决定浏览器如何绘制线段的连接点 | DOMString | round bevel(默认值) miter |
| miterLimit | 斜接线长度与1/2线宽的比值。如果斜接线的长度超过了该值。浏览器就会以bevel方式来绘制线段的连接点 | double | 非0正数,默认值 10.0 |
圆弧与圆形
| 方法 | 描述 |
|---|---|
| arc( double x, double y, double radius, double startAngle, double endAngle[, boolean counter-clockwise] ) |
创建一条以(x,y)为圆心,以 radius 为半径,以 startAngle 与 endAngle 为起止角的圆弧路径。角的单位是弧度,不是角度(180角度 = 弧度)。 最后一个参数是可选的。如果为true,则按逆时针画弧,如果是 false,则按顺时针画弧。 如果在调用该方法时,当前路径中有子路径存在,那么浏览器就会将子路径的终点与所画圆弧的起点以线段相连。 |
| arcTo( double x1, double y1, double x2, double y2, double radius ) |
参考(x1, y1) 与 (x2, y2)两个点,创建一条以 radius 为半径的圆弧路径。该圆弧与当前点到(x1, y1)点的连线相切,同时也与(x1, y1) 到(x2, y2)的连线相切。 与 arc()方法一样,如果在调用该方法时,当前路径中有子路径存在,那么浏览器将会从子路径的终点向圆弧路径的起点处画一条线段。 |
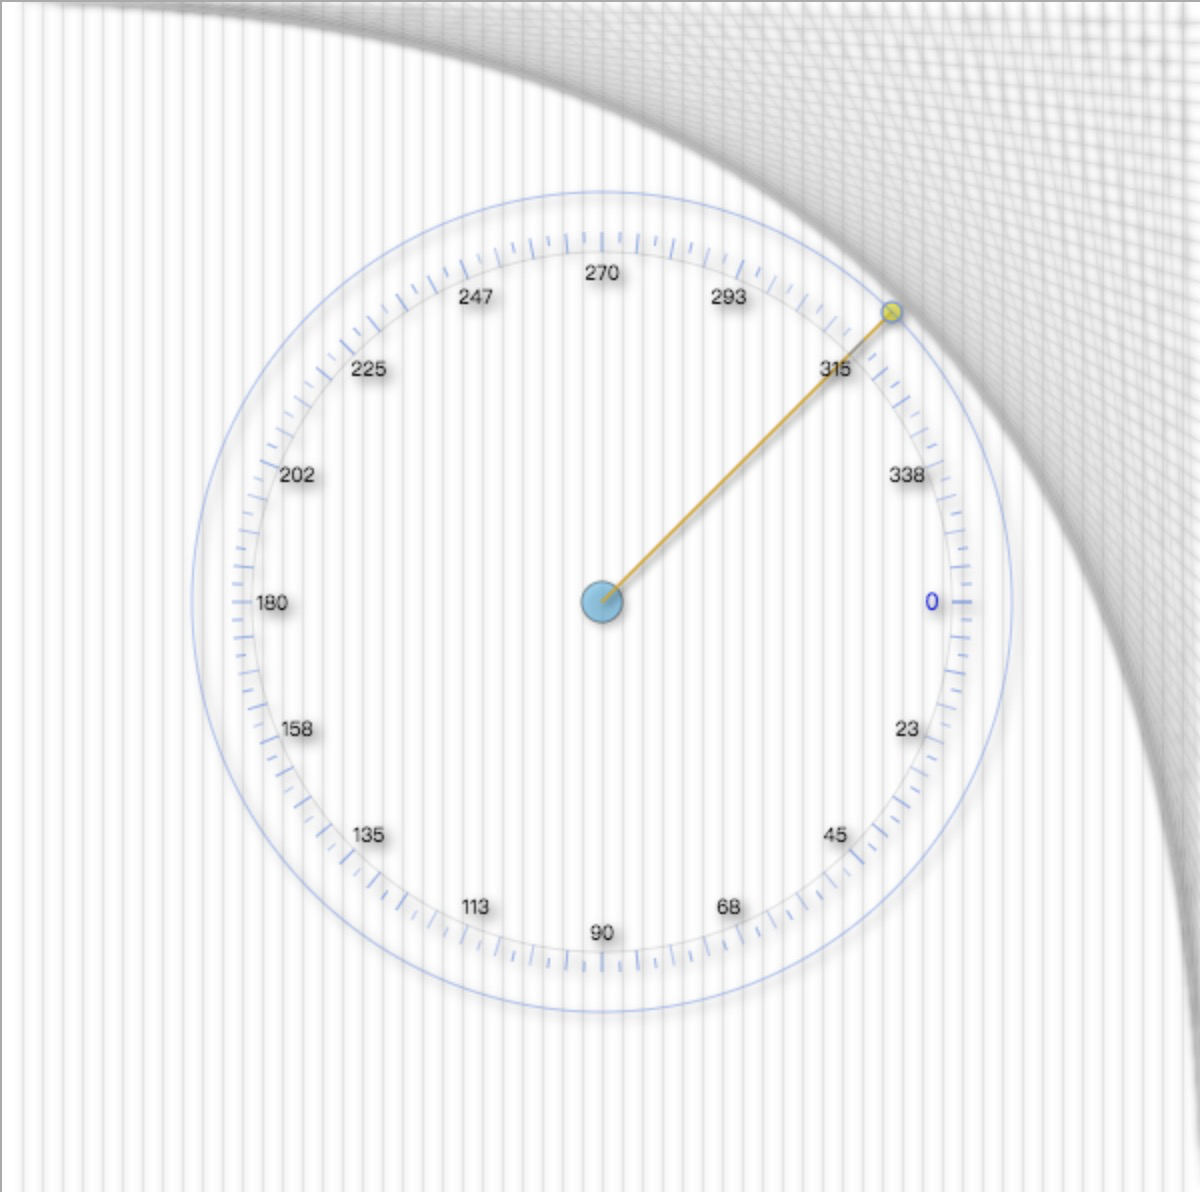
const CENTROID_RADIUS = 10;const CENTROID_STROKE_STYLE = 'rgba(0, 0, 0, 0.5)';const CENTROID_FILL_STYLE = 'rgba(80, 190, 240, 0.6)';const RING_INNER_RADIUS = 35;const RING_OUTER_RADIUS = 55;const ANNOTATIONS_FILL_STYLE = 'rgba(0, 0, 230, 0.9)';const ANNOTATIONS_TEXT_SIZE = 12;const TICK_WIDTH = 10;const TICK_LONG_STROKE_STYLE = 'rgba(100, 140, 230, 0.9)';const TICK_SHORT_STROKE_STYLE = 'rgba(100, 140, 230, 0.7)';const TRACKING_DIAL_STROKING_STYLE = 'rgba(100, 140, 230, 0.5)';const GUIDEWIRE_STROKE_STYLE = 'goldenrod';const GUIDEWIRE_FILL_STYLE = 'rgba(250, 250, 0, 0.6)';const circle = {x: canvas.width / 2,y: canvas.height / 2,radius: 150}const drawGrid = (color, stepx, stepy) => {ctx.save()ctx.shadowColor = undefined;ctx.shadowOffsetX = 0;ctx.shadowOffsetY = 0;ctx.strokeStyle = color;ctx.fillStyle = '#fff';ctx.lineWidth = 0.5;ctx.fillRect(0, 0, ctx.canvas.width, ctx.canvas.height);for (let i = stepx + 0.5; i < ctx.canvas.width; i+=stepx) {ctx.beginPath();ctx.moveTo(i, 0);ctx.lineTo(i, ctx.canvas.height);ctx.stroke();}for (let i = stepy + 0.5; i < ctx.canvas.height; i+=stepx) {ctx.beginPath();ctx.moveTo(i, 0);ctx.lineTo(ctx.canvas.width, i);ctx.stroke();}ctx.restore();}const drawCentroid = () => {ctx.beginPath()ctx.save()ctx.strokeStyle = CENTROID_STROKE_STYLE;ctx.fillStyle = CENTROID_FILL_STYLE;ctx.arc(circle.x, circle.y, CENTROID_RADIUS, 0, Math.PI*2, false)ctx.stroke()ctx.fill()ctx.restore()}const drawCentroidGuidewire = (loc) => {const angle = -Math.PI /4;let endpt = '';let radius = circle.radius + RING_OUTER_RADIUS;if (loc.x >= circle.x) {endpt = {x: circle.x + radius * Math.cos(angle),y: circle.y + radius * Math.sin(angle),}} else {endpt = {x: circle.x - radius * Math.cos(angle),y: circle.y + radius * Math.sin(angle)}}ctx.save()ctx.strokeStyle = GUIDEWIRE_STROKE_STYLE;ctx.fillStyle = GUIDEWIRE_FILL_STYLE;ctx.beginPath()ctx.moveTo(circle.x, circle.y)ctx.lineTo(endpt.x, endpt.y)ctx.stroke()ctx.beginPath()ctx.moveTo(circle.x, circle.y)ctx.lineTo(endpt.x, endpt.y)ctx.stroke()ctx.beginPath()ctx.strokeStyle = TICK_LONG_STROKE_STYLE;ctx.arc(endpt.x, endpt.y, 5, 0, Math.PI*2, false)ctx.fill()ctx.stroke()ctx.restore()}const drawRingOuterCircle = () => {ctx.shadowColor = 'rgba(0, 0, 0, 0.7)';ctx.shadowOffsetX = 3;ctx.shadowOffsetY = 3;ctx.shadowBlur = 6;ctx.strokeStyle = TRACKING_DIAL_STROKING_STYLE;ctx.beginPath();ctx.arc(circle.x, circle.y, circle.radius + RING_OUTER_RADIUS, 0, Math.PI*2, true);ctx.stroke()}const drawTickInnerCircle = () => {ctx.save()ctx.beginPath()ctx.strokeStyle = 'rgba(0, 0, 0, 0.1'ctx.arc(circle.x,circle.y,circle.radius + RING_INNER_RADIUS - TICK_WIDTH,Math.PI*2,false)ctx.stroke()ctx.restore()}const drawRing = () => {drawRingOuterCircle()ctx.strokeStyle = 'rgba(0, 0, 0, 0.1)';ctx.arc(circle.x,circle.y,circle.radius + RING_INNER_RADIUS,0,Math.PI*2,false)}const drawTick = (angle, radius, cnt) => {const tickWidth = cnt % 4 === 0 ? TICK_WIDTH : TICK_WIDTH / 2;ctx.beginPath();ctx.moveTo(circle.x + Math.cos(angle) * (radius - tickWidth),circle.y + Math.sin(angle) * (radius - tickWidth));ctx.lineTo(circle.x + Math.cos(angle) * radius,circle.y + Math.sin(angle) * radius);ctx.strokeStyle = TICK_SHORT_STROKE_STYLE;ctx.stroke();}const drawTicks = () => {const radius = circle.radius + RING_INNER_RADIUS;const ANGLE_MAX = 2 * Math.PI;const ANGLE_DELTA = Math.PI / 64;ctx.save();for (let angle = 0, cnt = 0; angle < ANGLE_MAX; angle+=ANGLE_DELTA, cnt++) {drawTick(angle, radius, cnt++);}ctx.restore();}const drawAnnotations = () => {const radius = circle.radius + RING_INNER_RADIUS;ctx.save();ctx.fillStyle = ANNOTATIONS_FILL_STYLE;ctx.font = ANNOTATIONS_TEXT_SIZE + 'px Helvetica';for (let angle = 0; angle < 2*Math.PI; angle+=Math.PI/8) {ctx.beginPath();ctx.fillText((angle * 180 / Math.PI).toFixed(0),circle.x + Math.cos(angle) * (radius - TICK_WIDTH *2),circle.y + Math.sin(angle) * (radius - TICK_WIDTH *2),);ctx.restore();}}const drawDial = () => {const loc = {x: circle.x,y: circle.y,}drawCentroid();drawCentroidGuidewire(loc);drawRing();drawTickInnerCircle();drawTicks();drawAnnotations();}ctx.shadowColor = 'rgba(0, 0, 0, 0.4)'ctx.shadowOffsetX = 2;ctx.shadowOffsetY = 2;ctx.shadowBlur = 4;ctx.textAlign = 'center';ctx.textBaseline = 'middle';drawGrid('lightgray', 10, 10)drawDial();
贝塞尔曲线
- 平方贝塞尔曲线由两个锚点及一个控制点定义
- 立方贝塞尔曲线由两个锚点及两个控制点定义
| 方法 | 描述 |
|---|---|
| quadraticCurveTo( double cpx, double cpy, double x, double y ) |
创建一条表示二次方贝塞尔曲线的路径。该方法需要传入两个点: 第一个是曲线的控制点, 第二个是锚点 |
| bezierCurveTo( double cpx, double cpy, double cp2x, double cp2y, double x, double y ) |
创建一条代表三次方贝塞尔曲线的路径。 需要传入三个点坐标: 前两个是控制点, 最后一个点是锚点 |

// 绘制二次方贝塞尔曲线const drawCurve = () => {ctx.fillStyle = 'cornflowerblue';ctx.strokeStyle = 'yellow';ctx.shadowColor = 'rgba(50, 50, 50, 1.0)';ctx.shadowOffsetX = 2;ctx.shadowOffsetY = 2;ctx.shadowBlur = 4;ctx.lineWidth = 20;ctx.lineCap = 'round';ctx.beginPath()ctx.moveTo(120.5, 130)ctx.quadraticCurveTo(150.8, 130, 160.6, 150.5);ctx.quadraticCurveTo(190, 250.0, 210.5, 160.5);ctx.quadraticCurveTo(240, 100.5, 290, 70.5);ctx.stroke()}drawCurve()
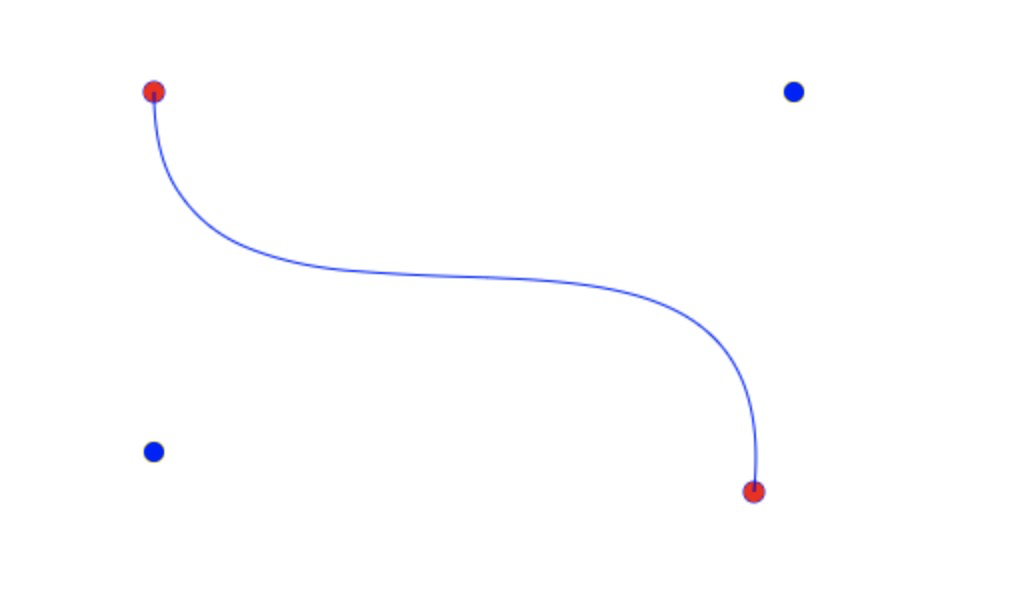
// 绘制三次方贝塞尔曲线const endPoints = [{ x: 130, y: 70 },{ x: 430, y: 270 },];const controlPoints = [{ x: 130, y: 250 },{ x: 450, y: 70 },]const drawBezierCurve = () => {ctx.strokeStyle = 'blue';ctx.beginPath();ctx.moveTo(endPoints[0].x,endPoints[0].y);ctx.bezierCurveTo(controlPoints[0].x,controlPoints[0].y,controlPoints[1].x,controlPoints[1].y,endPoints[1].x,endPoints[1].y);ctx.stroke();}const drawEndPoints = () => {ctx.strokeStyle = 'blue';ctx.fillStyle = 'red';endPoints.forEach((point) => {ctx.beginPath()ctx.arc(point.x,point.y,5,0,Math.PI*2,false);ctx.stroke();ctx.fill();})}const drawControlPoints = () => {ctx.strokeStyle = 'yellow';ctx.fillStyle = 'blue';controlPoints.forEach((point) => {ctx.beginPath();ctx.arc(point.x,point.y,5,0,Math.PI*2,false);ctx.stroke();ctx.fill();})}drawControlPoints()drawEndPoints()drawBezierCurve()
任意边形
使用moveTo() 和 lineTo() 再结合一些三角函数

若有收获,就点个赞吧
0 人点赞
