关于apply家住大家总是很困惑,我将自己的理解写出来,有更好的建议,欢迎留言。
apply家族
apply(array, margin, …)输入array输出vetor
margin:1表示行, 2表示列
mat = matrix(1:24,nrow = 4,ncol = 6);mat## [,1] [,2] [,3] [,4] [,5] [,6]## [1,] 1 5 9 13 17 21## [2,] 2 6 10 14 18 22## [3,] 3 7 11 15 19 23## [4,] 4 8 12 16 20 24apply(mat, 1, sum)## [1] 66 72 78 84
lapply(list, function) 输入list遍历list的元素,返回的也是list。
适合回归函数lm,因为lm返回也是list。
x = list(1:5)lapply(x , FUN = log)#output[[1]][1] 0.0000000 0.6931472 1.0986123 1.3862944 1.6094379colnames(iris)# output[1] "Sepal.Length" "Sepal.Width" "Petal.Length" "Petal.Width"[5] "Species"lapply(iris[,1:3], function(x) lm(x~iris$Sepal.Width, data = iris))# output$Sepal.LengthCall:lm(formula = x ~ iris$Sepal.Width, data = iris)Coefficients:(Intercept) iris$Sepal.Width6.5262 -0.2234$Sepal.WidthCall:lm(formula = x ~ iris$Sepal.Width, data = iris)Coefficients:(Intercept) iris$Sepal.Width2.321e-15 1.000e+00$Petal.LengthCall:lm(formula = x ~ iris$Sepal.Width, data = iris)Coefficients:(Intercept) iris$Sepal.Width9.063 -1.735
sapply(list, function) 输入list,返回向量和矩阵,数据框
sapply(1:5,log)#output[1] 0.0000000 0.6931472 1.0986123 1.3862944 1.6094379sapply(1:5, function(x)(x+3))#output[1] 4 5 6 7 8
tapply(vector, index, function) 输入vector,输出array
index表示按什么切分,将一个连续变量根据一个分类变量进行切分,并分类汇总
tapply(X = iris$Sepal.Length,INDEX = iris$Species,FUN = mean) #不能使用小写x#outputsetosa versicolor virginica5.006 5.936 6.588
mapply(function, …) 输入函数,输出vector
操作函数,mapply具有向量化操作的功能
myfun = function(x,y) {if(x>4) return(y)else return(x+y)}myfun(1:5,2:6) 直接运行会报错,因为此函数没有向量化操作的功能#output[1] 3 5 7 9 11Warning message:In if (x > 4) return(y) else return(x + y) :条件的长度大于一,因此只能用其第一元素mapply(myfun, 1:5,2:6)#output[1] 3 5 7 9 6
tips-从data.frame里以data.frame取列和以vector取列
> head(iris$Sepal.Length)[1] 5.1 4.9 4.7 4.6 5.0 5.4> class(head(iris$Sepal.Length))[1] "numeric"> class(head(iris["Sepal.Length"]))[1] "data.frame"> head(iris[,1])[1] 5.1 4.9 4.7 4.6 5.0 5.4> head(iris["Sepal.Length"]) #data.frameSepal.Length1 5.12 4.93 4.74 4.65 5.06 5.4> class(head(iris["Sepal.Length"]))[1] "data.frame"> head(iris[,1:2]) #去两列那自然就是data.frameSepal.Length Sepal.Width1 5.1 3.52 4.9 3.03 4.7 3.24 4.6 3.15 5.0 3.66 5.4 3.9> class(head(iris[,1:2]))[1] "data.frame"
dply包
以下函数的记忆法:第一个字母为输入数据结构,第二个字母为输出数据结构,a=array,d = dataframe,l=list
aaply(my_matrix,.margins = 2,.fun=mean) 输入array输出array
adply(my_matrix,.margins = 2,.fun=mean) 输入array输出data.frame
laply(my_list,.fun = mean)输入list 输出vector
ddply(.data = my_df,.variables =.(gender),.fun = mean) 输入dataframe,输出dataframe
dlply(iris,~Species,my_mode)适合回归分析,输入数据框,输出list
library(plyr)my_matrix = matrix(1:24,nrow = 3,ncol = 8)> my_matrix[,1] [,2] [,3] [,4] [,5] [,6] [,7] [,8][1,] 1 4 7 10 13 16 19 22[2,] 2 5 8 11 14 17 20 23[3,] 3 6 9 12 15 18 21 24
aaply(my_matrix,.margins = 2,.fun=mean) #输入array输出array
> aaply(my_matrix,.margins = 2,.fun=mean) #输入array输出array1 2 3 4 5 6 7 82 5 8 11 14 17 20 23#和apply比较> apply(my_matrix, 2,mean) #输入array输出vector[1] 2 5 8 11 14 17 20 23
adply(my_matrix,.margins = 2,.fun=mean) #输入array输出data.frame
> adply(my_matrix,.margins = 2,.fun=mean) #输入array输出data.frameX1 V11 1 22 2 53 3 84 4 115 5 146 6 177 7 208 8 23
laply(my_list,.fun = mean)输入list 输出vector
> my_list = list(1:10,2:8,rep(c(T,F),times = 5))> laply(my_list,.fun = mean)[1] 5.5 5.0 0.5#和lapply比较> lapply(my_list, mean) # 输入list输出array[[1]][1] 5.5[[2]][1] 5[[3]][1] 0.5
ddply(.data = my_df,.variables =.(gender),.fun = mean) 输入dataframe,输出dataframe
> my_df = data.frame (name= c('Tony','Andy','Bob', 'Mary', 'Leo'),+ height=c(178,176,175,167,199),+ gender= c('M','F','F','M','M'),+ age = c("old","young","young","old","young"))> ddply(.data = my_df$sheight,.variables =.(gender),.fun = mean) #报错,此处输入的是vectorNULL> ddply(.data = my_df,.variables =.(gender),summarise,+ mean_h= mean(height)) #.data 输入的是整个dataframe,.(gender)是此包的格式gender mean_h1 F 175.50002 M 181.3333> ddply(.data = my_df,.variables =.(gender),summarise,+ mean_h= mean(height),sd_h = sd(height)) #同时汇总mean 和sdgender mean_h sd_h1 F 175.5000 0.70710682 M 181.3333 16.2583312#和tapply比较,输入向量,输出array> tapply (my_df$height, my_df$gender,mean)F M175.5000 181.3333> class(tapply (my_df$height, my_df$gender,mean) )[1] "array"
> library(reshape2)> head(tips)total_bill tip sex smoker day time size1 16.99 1.01 Female No Sun Dinner 22 10.34 1.66 Male No Sun Dinner 33 21.01 3.50 Male No Sun Dinner 34 23.68 3.31 Male No Sun Dinner 25 24.59 3.61 Female No Sun Dinner 46 25.29 4.71 Male No Sun Dinner 4> ddply(tips,.(sex,smoker),function(x) sum(x$tip)/sum(x$total_bill))sex smoker V11 Female No 0.15318922 Female Yes 0.16306233 Male No 0.15731224 Male Yes 0.1369188>> ddply(tips,~sex+smoker,function(x) sum(x$tip)/sum(x$total_bill)) #另一种写法sex smoker V11 Female No 0.15318922 Female Yes 0.16306233 Male No 0.15731224 Male Yes 0.1369188
dlply(iris,~Species,my_mode)适合回归分析,输入数据框,输出list
lapply() 返回list 回归分析返回的是list,所有lapply适合回归分析
dlply适合回归分析,输入数据框,输出list
> my_mode = function(x) lm(Sepal.Length~Sepal.Width,data = x)> dlply(iris,~Species,my_mode) #iris是数据,~Species是分类变量,my_mode是函数输出的是list$setosaCall:lm(formula = Sepal.Length ~ Sepal.Width, data = x)Coefficients:(Intercept) Sepal.Width2.6390 0.6905$versicolorCall:lm(formula = Sepal.Length ~ Sepal.Width, data = x)Coefficients:(Intercept) Sepal.Width3.5397 0.8651$virginicaCall:lm(formula = Sepal.Length ~ Sepal.Width, data = x)Coefficients:(Intercept) Sepal.Width3.9068 0.9015attr(,"split_type")[1] "data.frame"attr(,"split_labels")Species1 setosa2 versicolor3 virginica
彩蛋
each、colwise、numwise和ddply函数
> each(mean,sd,median)(iris$Sepal.Length) #一次性的对某个对象(第二个括号)进行多种操作mean sd median5.8433333 0.8280661 5.8000000> colwise(mean)(iris)#对列进行操作Sepal.Length Sepal.Width Petal.Length Petal.Width Species1 5.843333 3.057333 3.758 1.199333 NAWarning message:In mean.default(X[[i]], ...) :argument is not numeric or logical: returning NA> numcolwise(mean)(iris) #只对为数据的列进行操作Sepal.Length Sepal.Width Petal.Length Petal.Width1 5.843333 3.057333 3.758 1.199333> #ddply的好处> #写法一> ddply(iris,~Species,colwise(mean,c('Sepal.Length','Sepal.Width')))Species Sepal.Length Sepal.Width1 setosa 5.006 3.4282 versicolor 5.936 2.7703 virginica 6.588 2.974> #写法二> ddply(iris,~Species,colwise(mean,.(Sepal.Length,Sepal.Width)))Species Sepal.Length Sepal.Width1 setosa 5.006 3.4282 versicolor 5.936 2.7703 virginica 6.588 2.974> #写法三> ddply(iris,~Species,colwise(mean,~Sepal.Length+Sepal.Width))Species Sepal.Length Sepal.Width1 setosa 5.006 3.4282 versicolor 5.936 2.7703 virginica 6.588 2.974
参考总结图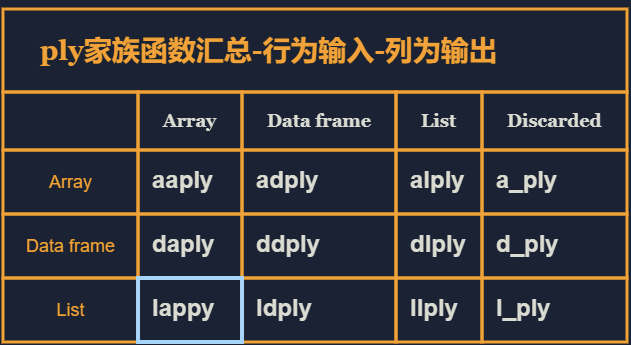

若有收获,就点个赞吧
0 人点赞
