代码
import cv2, mathimport numpy as npimport matplotlib.pyplot as plt## 定义图像目录image_directory = 'D:\\Data_documents\\ImageProcess\\images\\'# 图像读取imgname = image_directory + 'lena.jpg'img = cv2.imread(imgname)# 图像显示在一个新的名字为'image'的窗口中,如果看不到,在任务栏中把窗口恢复后观察图像,在窗口中按任意键关闭窗口cv2.imshow('image',img)cv2.waitKey(0)cv2.destroyAllWindows()# 彩色图像转化为灰度图像image = cv2.cvtColor(img, cv2.COLOR_BGR2GRAY)
1. 图像加噪声
1.1 高斯噪声
# 产生高斯随机噪声,并显示 (mean value to 128 and a standard deviation to 20.)gaussian_noise = np.zeros((image.shape[0], image.shape[1]),dtype=np.uint8)cv2.randn(gaussian_noise, 128,10)cv2.imshow('Gaussian noise',gaussian_noise)cv2.waitKey(0)cv2.destroyAllWindows()
1.2 随机噪声
# 产生随机噪声,并显示 ( random values drawn from an uniform distribution, the pixel values were set from 0 to 255)uniform_noise = np.zeros((image.shape[0], image.shape[1]),dtype=np.uint8)cv2.randu(uniform_noise,0,255)cv2.imshow('uniform noise',uniform_noise)cv2.waitKey(0)cv2.destroyAllWindows()
1.3 脉冲噪声
# 产生脉冲噪声,并显示 (大于250的设置为255(白色),其余设置为0)impulse_noise = uniform_noise.copy()ret,impulse_noise = cv2.threshold(uniform_noise,250,255,cv2.THRESH_BINARY)cv2.imshow('Impulse noise',impulse_noise)cv2.waitKey(0)cv2.destroyAllWindows()
1.4 添加噪声到图像
# 1gaussian_noise = (gaussian_noise*0.5).astype(np.uint8)noisy_image1 = cv2.add(image,gaussian_noise)cv2.imshow('Noisy image - Gaussian noise',noisy_image1)# 2uniform_noise = (uniform_noise*0.5).astype(np.uint8)noisy_image2 = cv2.add(image,uniform_noise)cv2.imshow('Noisy image - Uniform noise',noisy_image2)# 3impulse_noise = (impulse_noise*0.5).astype(np.uint8)noisy_image3 = cv2.add(image,impulse_noise)cv2.imshow('Noisy image - Impuls noise',noisy_image3)cv2.waitKey(0)cv2.destroyAllWindows()
1.5 中值滤波
blurred1 = cv2.medianBlur(noisy_image1, 3)cv2.imshow('Median filter - Gaussian noise',blurred1)blurred2 = cv2.medianBlur(noisy_image2, 3)cv2.imshow('Median filter - Uniform noise',blurred2)blurred3 = cv2.medianBlur(noisy_image3, 3)cv2.imshow('Median filter - Impuls noise',blurred3)cv2.waitKey(0)cv2.destroyAllWindows()# 观察: 中值滤波对于脉冲噪声的滤波效果较好
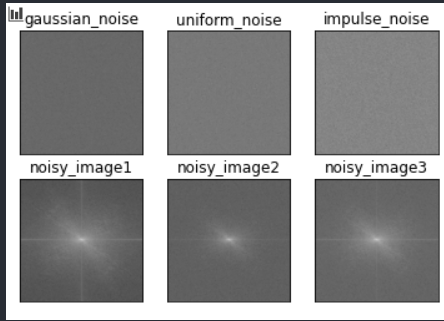
#观察三种噪声的能量分布filters = [gaussian_noise, uniform_noise, impulse_noise, noisy_image1, noisy_image2, noisy_image3]filter_name = ['gaussian_noise', 'uniform_noise','impulse_noise', 'noisy_image1', 'noisy_image2', 'noisy_image3']fft_filters = [np.fft.fft2(x) for x in filters]fft_shift = [np.fft.fftshift(y) for y in fft_filters]mag_spectrum = [np.log(np.abs(z)+1) for z in fft_shift]for i in range(6): plt.subplot(2,3,i+1),plt.imshow(mag_spectrum[i],cmap = 'gray') plt.title(filter_name[i]), plt.xticks([]), plt.yticks([])plt.show()

2. 图像模糊的检测问题
2.1 图像模糊检测方法
# 下面的函数计算并返回图像的FFT变换的高频部分的均值def detect_blur_fft(image, size=60, vis=False): # grab the dimensions of the image and use the dimensions to # derive the center (x, y)-coordinates (h, w) = image.shape (cX, cY) = (int(w / 2.0), int(h / 2.0)) # FFT fft = np.fft.fft2(image) fftShift = np.fft.fftshift(fft) magnitude = 20 * np.log(np.abs(fftShift)) if vis: # display the original input image (fig, ax) = plt.subplots(1, 2, ) ax[0].imshow(image, cmap="gray") ax[0].set_title("Input") ax[0].set_xticks([]) ax[0].set_yticks([]) # display the magnitude image ax[1].imshow(magnitude, cmap="gray") ax[1].set_title("Magnitude Spectrum") ax[1].set_xticks([]) ax[1].set_yticks([]) # show our plots plt.show() # FFT 取高频,并求反变换 fftShift[cY - size:cY + size, cX - size:cX + size] = 0 fftShift = np.fft.ifftshift(fftShift) recon = np.fft.ifft2(fftShift) magnitude = 20 * np.log(np.abs(recon)) # 返回均值 mean = np.mean(magnitude) return mean
# 利用该函数对不同的图像进行检测,显示FFT结果,并返回结果detect_blur_fft(image, size=60,vis=True)# 利用该函数对不同的图像进行检测,不显示FFT结果,返回结果detect_blur_fft(image, size=60,vis=False)
# orgimg: 输入的图像# thres: 阈值def display_blur_fft(orgimg, thres): gray = cv2.resize(orgimg, (500, int(orgimg.shape[1]/orgimg.shape[0]*500)) ) # 判断是否彩色图像,是则转换成灰度图像 if (len(gray.shape)>2): gray = cv2.cvtColor(gray, cv2.COLOR_BGR2GRAY) mean_value = detect_blur_fft(gray) # 大于阈值则设置为 Blurry blurry = (mean_value < thres) # 在图像上显示 # 构造一个三通道BGR的彩色图像 image = np.dstack([gray] * 3) # 设置显示mean值的颜色(BGR)和格式 color = (0, 0, 255) if blurry else (0, 255, 0) text = "Blurry ({:.4f})" if blurry else "Not Blurry ({:.4f})" text = text.format(mean_value) # 设置显示mean值的位置和字体、宽度 cv2.putText(image, text, (10, 25), cv2.FONT_HERSHEY_SIMPLEX, 0.7, color, 2)# print("[INFO] {}".format(text)) # 显示图像 cv2.imshow("Output", image)
# 阈值设为 15display_blur_fft(image, 15)cv2.waitKey(0)cv2.destroyAllWindows()# 阈值设为 20img_Guassian = cv2.GaussianBlur(image,(5,5),0)display_blur_fft(img_Guassian, 20)cv2.waitKey(0)cv2.destroyAllWindows()
2.2 视频实时显示图像,判断是否模糊
# 开启计算机的摄像头,降噪后显示实时图像和是否模糊,按q退出cap = cv2.VideoCapture(0)cv2.imshow("Output", image)while True: # Capture frame-by-frame ret, frame = cap.read() if ret==True: frameimg = cv2.medianBlur(frame, 3) # 显示是否模糊 display_blur_fft(frameimg, 15.5) # 判断键盘输入q后,退出 key = cv2.waitKey(1) & 0xFF if key == ord("q"): break;# When everything done, release the capturecap.release()cv2.destroyAllWindows()
知识点
5.1 图像退化模型
5.2 噪声模型及参数估计
5.3 图像复原方法
5.4 图像几何校正
课件
机器视觉-第5章-图像复原.pdf


