代码
import cv2, mathimport numpy as npimport matplotlib.pyplot as plt## 定义图像目录image_directory = 'D:\\Data_documents\\ImageProcess\\images\\'# 图像读取imgname = image_directory + 'lena.jpg'img = cv2.imread(imgname)# 图像显示在一个新的名字为'image'的窗口中,如果看不到,在任务栏中把窗口恢复后观察图像,在窗口中按任意键关闭窗口cv2.imshow('image',img)cv2.waitKey(0)cv2.destroyAllWindows()
计算计算Fourier变换
1.1 图像的2D DFFT直接显示
# 计算Fourier变换# 彩色图像转化为灰度图像, 只有灰度图像才能计算Fourier变换grayimg = cv2.cvtColor(img, cv2.COLOR_BGR2GRAY) f = np.fft.fft2(grayimg)# 先取幅值freq = np.abs(f)# 再显示一下Fourier变换结果的直方图看看fig, ax = plt.subplots(nrows=2, ncols=2, figsize=(14, 6))ax[0,0].hist(freq.ravel(), bins=100)ax[0,0].set_title('hist(freq)')# 观察:有一部分的数值非常大,其余的很小,看不到了ax[0,1].hist(np.log(freq).ravel(), bins=100)ax[0,1].set_title('hist(log(freq))')# 观察:取对数之后才能看到其它部分# 显示一下数据的二维分布,数值越大自动显示的颜色越亮ax[1,0].imshow(np.log(freq), interpolation="none")ax[1,0].set_title('log(freq)')# 观察:频谱图可以看到四个角比较亮,中间比较暗# 显示灰度图像ax[1,1].imshow(grayimg, interpolation="none")plt.show()# 观察:灰度图像 也按照灰度的大小用色彩显示出来,这是一种伪彩色显示图像的方法
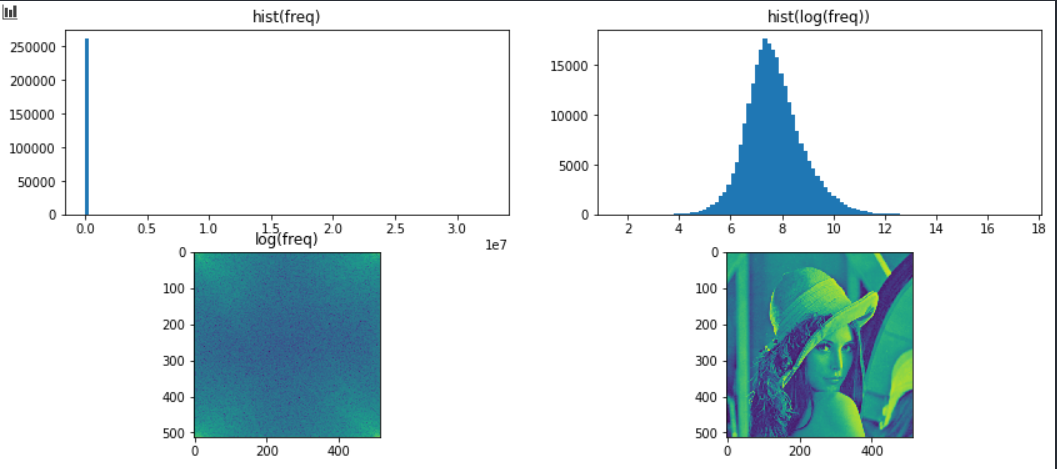
1.2 图像的2D DFFT 偏移后能量集中的显示
grayimg = cv2.cvtColor(img, cv2.COLOR_BGR2GRAY) # 通常的 Fourier 2D 变换dft = np.fft.fft2(grayimg)fshift = np.fft.fftshift(dft)freq = np.log(np.abs(fshift))# 显示, 和上面类似,这里采用 cmap = 'gray' 参数 显示为灰度图像plt.subplot(121),plt.imshow(grayimg, cmap = 'gray')plt.title('Input Image'), plt.xticks([]), plt.yticks([])plt.subplot(122),plt.imshow( freq, cmap = 'gray')plt.title('Magnitude Spectrum'), plt.xticks([]), plt.yticks([])plt.show()# 观察:频谱图中间亮,体现能量集中的特点
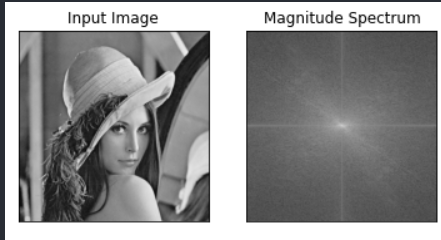
1.3 图像的2D DFFT反变换
# Fourier反变换ishift = np.fft.ifftshift(fshift)iimg = np.fft.ifft2(ishift)iimg = np.abs(iimg)#展示结果plt.subplot(131), plt.imshow(grayimg, 'gray'), plt.title('Original Image')plt.axis('off')plt.subplot(132), plt.imshow(freq, 'gray'), plt.title('Fourier Image')plt.axis('off')plt.subplot(133), plt.imshow(iimg, 'gray'), plt.title('Inverse Fourier Image')plt.axis('off')plt.show()

1.4 CV函数进行 2D DFFT计算
# Fourier变换dft = cv2.dft(np.float32(grayimg), flags = cv2.DFT_COMPLEX_OUTPUT)# 将频谱低频从左上角移动至中心位置dftshift = np.fft.fftshift(dft)# 频谱图像双通道复数转换为0-255区间result = 20*np.log(cv2.magnitude(dftshift[:,:,0], dftshift[:,:,1]))# Fourier反变换ishift = np.fft.ifftshift(dftshift)iimg = cv2.idft(ishift)res2 = cv2.magnitude(iimg[:,:,0], iimg[:,:,1])#显示plt.subplot(131), plt.imshow(grayimg, 'gray'), plt.title('Original Image')plt.axis('off')plt.subplot(132), plt.imshow(result, 'gray'), plt.title('Fourier Image')plt.axis('off')plt.subplot(133), plt.imshow(res2, 'gray'), plt.title('Inverse Fourier Image')plt.axis('off')plt.show()
图像的频域处理
2.1 低频观察
grayimg = cv2.cvtColor(img, cv2.COLOR_BGR2GRAY) # 通常的 Fourier 2D 变换dft = np.fft.fft2(grayimg)fshift = np.fft.fftshift(dft)freq = np.log(1+np.abs(fshift))# 去掉矩形框之外的数据(置0)freq_center = fshift[256-32:256+32,256-32:256+32].copy()fshift2 = np.zeros([fshift.shape[0],fshift.shape[1]] ,dtype = np.complex64)fshift2[256-32:256+32,256-32:256+32] = freq_centerfreq2 = np.log(1+np.abs(fshift2))# Fourier反变换ishift3 = np.fft.ifftshift(fshift2)iimg = np.fft.ifft2(ishift3)iimg = np.abs(iimg)#展示结果plt.subplot(221), plt.imshow(grayimg, 'gray'), plt.title('Original')plt.axis('off')plt.subplot(222), plt.imshow(freq, 'gray'), plt.title('Fourier1')plt.axis('off')plt.subplot(223), plt.imshow(freq2, 'gray'), plt.title('Fourier2')plt.axis('off')plt.subplot(224), plt.imshow(iimg, 'gray'), plt.title('New Image')plt.axis('off')plt.show()
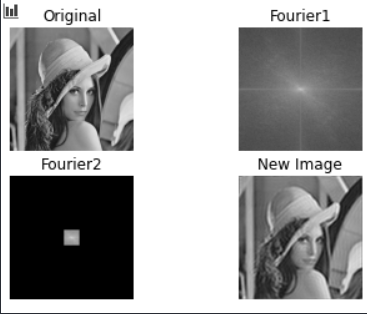
2.2 高频观察
grayimg = cv2.cvtColor(img, cv2.COLOR_BGR2GRAY) # 通常的 Fourier 2D 变换dft = np.fft.fft2(grayimg)fshift = np.fft.fftshift(dft)freq = np.log(1+np.abs(fshift))# 去掉矩形框之内的数据(置0)fshift2 = fshift.copy()fshift2[256-32:256+32,256-32:256+32] = 0freq2 = np.log(1+np.abs(fshift2))# Fourier反变换ishift3 = np.fft.ifftshift(fshift2)iimg = np.fft.ifft2(ishift3)iimg = np.abs(iimg)#展示结果plt.subplot(221), plt.imshow(grayimg, 'gray'), plt.title('Original')plt.axis('off')plt.subplot(222), plt.imshow(freq, 'gray'), plt.title('Fourier1')plt.axis('off')plt.subplot(223), plt.imshow(freq2, 'gray'), plt.title('Fourier2')plt.axis('off')plt.subplot(224), plt.imshow(iimg, 'gray'), plt.title('New Image')plt.axis('off')plt.show()
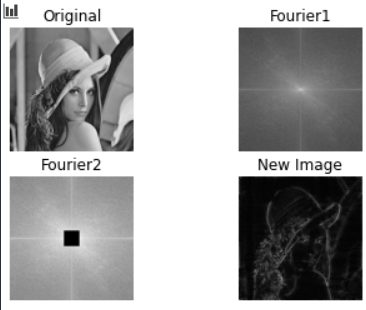
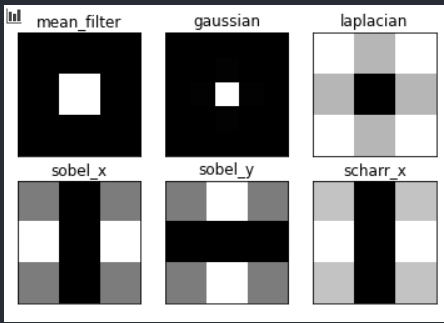
2.3 观察一个算子是低频滤波还是高频滤波
# simple averaging filter without scaling parametermean_filter = np.ones((3,3))# creating a guassian filterx = cv2.getGaussianKernel(5,10)#x.T 为矩阵转置gaussian = x*x.T# different edge detecting filters# scharr in x-directionscharr = np.array([[-3, 0, 3], [-10,0,10], [-3, 0, 3]])# sobel in x directionsobel_x= np.array([[-1, 0, 1], [-2, 0, 2], [-1, 0, 1]])# sobel in y directionsobel_y= np.array([[-1,-2,-1], [0, 0, 0], [1, 2, 1]])# laplacianlaplacian=np.array([[0, 1, 0], [1,-4, 1], [0, 1, 0]])filters = [mean_filter, gaussian, laplacian, sobel_x, sobel_y, scharr]filter_name = ['mean_filter', 'gaussian','laplacian', 'sobel_x', 'sobel_y', 'scharr_x']fft_filters = [np.fft.fft2(x) for x in filters]fft_shift = [np.fft.fftshift(y) for y in fft_filters]mag_spectrum = [np.log(np.abs(z)+1) for z in fft_shift]for i in range(6): plt.subplot(2,3,i+1),plt.imshow(mag_spectrum[i],cmap = 'gray') plt.title(filter_name[i]), plt.xticks([]), plt.yticks([])plt.show()# 观察亮的区域在图像的高频位置(外侧) ,还是低频位置 (中心),对应能通过信号的区域
知识点
4.1 Fourier变换
4.2 DFT的计算与可视化
4.3 频域滤波
课件
机器视觉-第4章-频域图像增强.pdf


