安装
安装numpy
pip3 install numpy
安装matplotlib
pip3 install matplotlib
基础
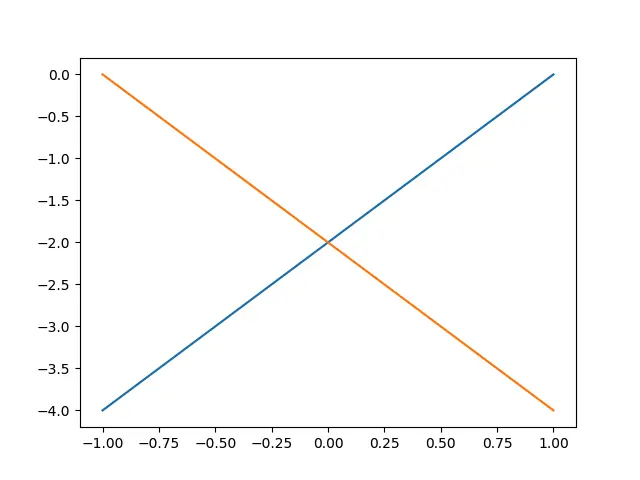
import numpy as npimport matplotlib.pyplot as pltx1 = np.linspace(-3, 3)y1 = 2*x1-2y2 = -2*x1-2plt.plot(x1, y1)plt.plot(x1, y2)plt.show()
设置坐标轴
plt.xlim设置x坐标轴范围
plt.ylim设置y坐标轴范围
plt.xlabel设置x坐标轴名称
plt.ylabel设置y坐标轴名称
plt.xticks设置x轴刻度
plt.yticks设置y轴刻度
import numpy as npimport matplotlib.pyplot as pltx = np.linspace(-3, 3,)y1 = 2 *x+1y2 = x**2plt.figure()plt.plot(x,y2)plt.plot(x,y1,color='red', linewidth=1.0, linestyle='--')plt.xlim(-1,2)plt.ylim(-2,3)plt.xlabel('x')plt.ylabel('y')new_ticks = np.linspace(-1,2,5)print(new_ticks)plt.xticks(new_ticks)plt.yticks([-2,-1.8,-1,1.22,3])plt.show()

设置边框
plt.gca获取当前坐标轴信息. 使用.spines设置边框,使用.set_color设置边框颜色:默认白色.
import numpy as npimport matplotlib.pyplot as pltx = np.linspace(-3, 3)y1 = 2 *x+1plt.plot(x,y1)plt.xlim(-1,2)plt.ylim(-2,3)ax = plt.gca()ax.spines['top'].set_color('none')ax.spines['right'].set_color('none')plt.show()
调整坐标轴位置
使用.xaxis.set_ticks_position设置x坐标刻度数字或名称的位置(所有位置:top,bottom,both,default,none)。使用.set_position设置边框位置:y=0的位置;(位置所有属性:outward,axes,data)
import numpy as npimport matplotlib.pyplot as pltx = np.linspace(-3, 3)y1 = x**2plt.plot(x,y1)plt.xlim(-3,3)plt.ylim(-1,3)ax = plt.gca()ax.xaxis.set_ticks_position('bottom')ax.spines['top'].set_color('none')ax.spines['right'].set_color('none')ax.spines['left'].set_position(('data', 0))ax.spines['bottom'].set_position(('data', 0))plt.show()
图例
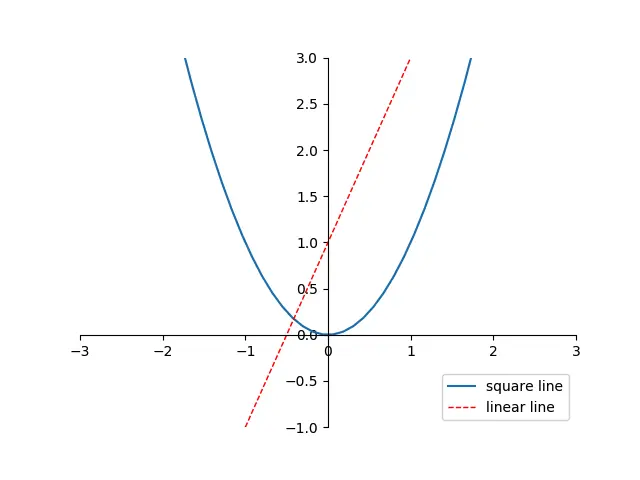
import numpy as npimport matplotlib.pyplot as pltx = np.linspace(-3, 3)y1 = x**2l1, = plt.plot(x,y1,label='square line')y2 = 2*x + 1l2, = plt.plot(x,y2,color='red', linewidth=1.0, linestyle='--', label='linear line')plt.xlim(-3,3)plt.ylim(-1,3)#plt.legend(loc='lower right')plt.legend(handles=[l1, l2], labels=['x^2', '2*x+1'], loc='best')ax = plt.gca()ax.xaxis.set_ticks_position('bottom')ax.spines['top'].set_color('none')ax.spines['right'].set_color('none')ax.spines['left'].set_position(('data', 0))ax.spines['bottom'].set_position(('data', 0))plt.show()
l1, l2,要以逗号结尾, 因为plt.plot() 返回的是一个列表.
位置信息
=============== =============Location String Location Code=============== ============='best' 0'upper right' 1'upper left' 2'lower left' 3'lower right' 4'right' 5'center left' 6'center right' 7'lower center' 8'upper center' 9'center' 10=============== =============

若有收获,就点个赞吧
0 人点赞
