cd /optwget https://dl.grafana.com/oss/release/grafana-7.4.3.linux-amd64.tar.gz
编写服务脚本
cat > /usr/lib/systemd/system/grafana.service <<EOF
[Unit]
Description=grafana
Documentation=
After=network.target

[Service]
Type=simple
WorkingDirectory=/opt/grafana
ExecStart=/opt/grafana/bin/grafana-server
ExecStop=/bin/kill -KILL \$MAINPID
ExecReload=/bin/kill -HUP \$MAINPID
KillMode=control-group
Restart=on-failure
RestartSec=3s

[Install]
WantedBy=multi-user.target
EOF
启动
[root@bogon bin]# systemctl enable grafana
Created symlink from /etc/systemd/system/multi-user.target.wants/grafana.service to /usr/lib/systemd/system/grafana.service.
[root@bogon bin]# systemctl start grafana
[root@bogon bin]# systemctl status grafana
浏览器访问http://192.168.0.15:3000/
用户admin
密码admin
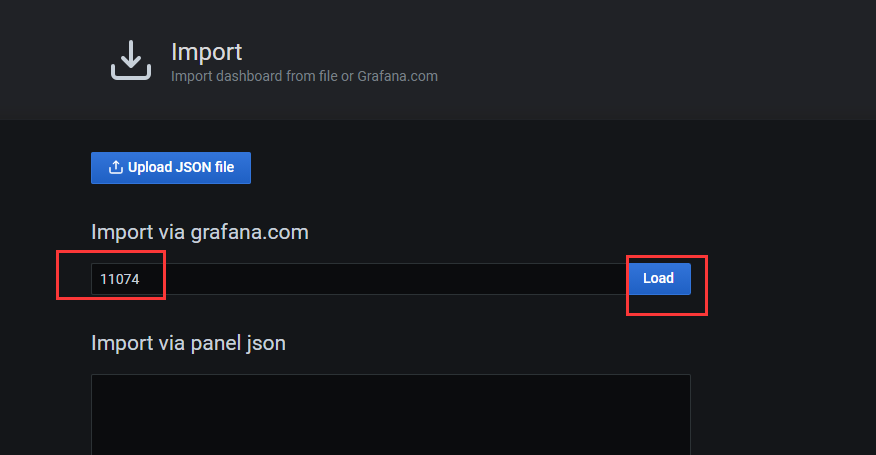
导入node dashboards
#英文版本
https://grafana.com/grafana/dashboards/11074
#中文版本
https://grafana.com/grafana/dashboards/8919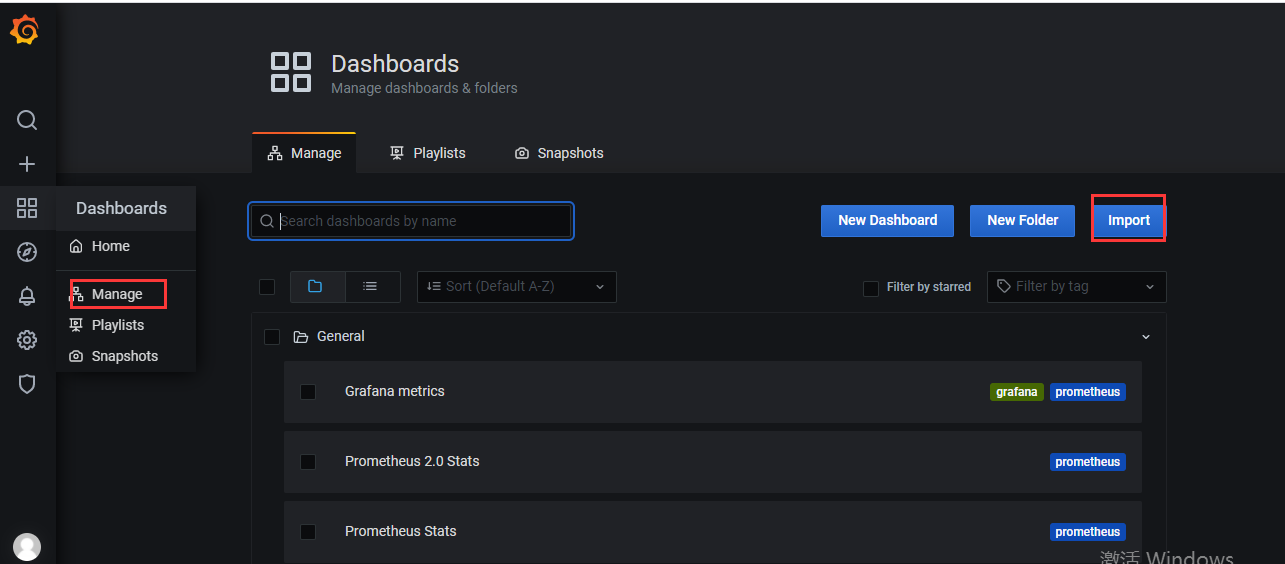
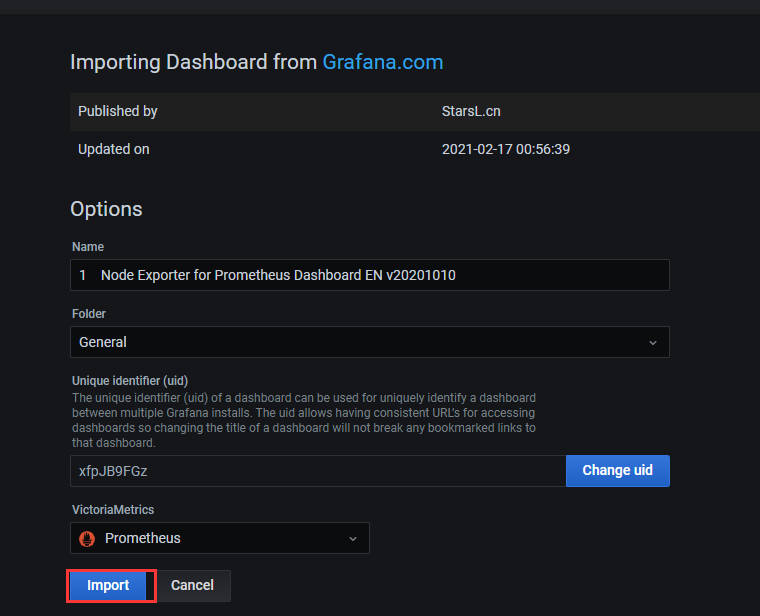
就可以看到漂亮的node监控数据了

若有收获,就点个赞吧
0 人点赞
