水平分割
names = ['group_a', 'group_b', 'group_c']values = [1, 10, 100]plt.figure(figsize=(9, 3))plt.subplot(131)plt.bar(names, values)plt.subplot(132)plt.scatter(names, values)plt.subplot(133)plt.plot(names, values)plt.suptitle('Categorical Plotting')plt.show()
plt.figure(figsize=(9, 3)) 生成一个 9*3 的画布, 通过 subplot 可以将画布切分为多个子图, 其中 131 代表 “1行3列的第1个”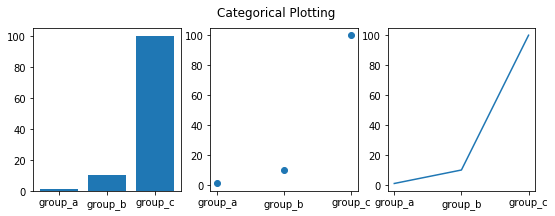
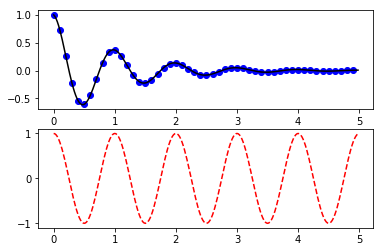
垂直分割
def f(t):return np.exp(-t) * np.cos(2*np.pi*t)t1 = np.arange(0.0, 5.0, 0.1)t2 = np.arange(0.0, 5.0, 0.02)plt.figure()plt.subplot(211)plt.plot(t1, f(t1), 'bo', t2, f(t2), 'k')plt.subplot(212)plt.plot(t2, np.cos(2*np.pi*t2), 'r--')plt.show()
其中 211 代表 “2行1列的第1个”
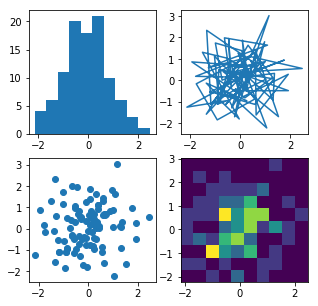
创建子图
除了上面的 subplot 切割子图, 还可以通过 subplots 方法预先创建子图, 然后对每个子图填充图像:
data = np.random.randn(2, 100)fig, axs = plt.subplots(2, 2, figsize=(5, 5))axs[0, 0].hist(data[0])axs[1, 0].scatter(data[0], data[1])axs[0, 1].plot(data[0], data[1])axs[1, 1].hist2d(data[0], data[1])plt.show()

若有收获,就点个赞吧
0 人点赞
