- 内存统计 (Memstats)
- pprof (pprof)
- 减少长寿物品的数量 (Reduce the number of long-living objects)
- 删除指针中的指针 (Remove pointers within pointers)
- 避免不必要的字符串/字节数组分配 (Avoid unnecessary string/byte array allocations)
- 对象池 (Object pooling)
- 清理未使用的字段(Clean up unused fields)
- 从堆中迁移数据 (Migrate data off the heap)
- 重新排列结构以降低内存使用量(Rearrange your structs for lower memory usage)
Despite its growing popularity as a systems language, Go programs are susceptible to severe performance regressions at large scale. In systems with high memory usage, garbage collection (GC) can cause performance regressions by cannibalizing resources from the main program. Heavy GC cycles can add hundreds of milliseconds of latency to a request, resulting in degraded user experience.
尽管 Go 程序作为一种系统语言越来越受欢迎,但它很容易受到大规模严重性能下降的影响。 在内存使用率很高的系统中,垃圾回收 (GC) 可能会吞噬主程序中的资源,从而导致性能下降。 繁重的 GC 周期会为请求增加数百毫秒的延迟,从而降低用户体验。
The goal of this post is to help you understand:
这篇文章的目的是帮助您了解:
- How Go GC works at a high level? Why would it impact your system’s performance? Go GC 如何在高水平上工作? 为什么会影响系统性能?
- What causes GC pressure (more resources spent on GC)? 是什么导致 GC 压力 (在 GC 上花费了更多资源)?
- How to determine if GC pressure is the cause of your performance problems? 如何确定 GC 压力是否是性能问题的原因?
- How to measure and profile your program’s heap usage? 如何测量和分析程序的堆使用情况?
- How to identify which part of the code is the culprit? 如何识别罪魁祸首?
- What are some steps you can take to lower heap usage and GC pressure? 您可以采取哪些步骤来降低堆使用率和 GC 压力?
Go does not require manual memory management i.e., you do not need to manually allocate memory and clear it once you’re done using it. Such functionalities are abstracted away from the user, to minimize errors that could lead to memory leaks. Go has a built-in garbage collector, which reclaims memory once it is no longer in use by the program.
Go 不需要手动内存管理,即,您不需要手动分配内存并在使用完后清除它。 此类功能是从用户那里抽象出来的,以最大程度地减少可能导致内存泄漏的错误。 Go 有一个内置的垃圾收集器,一旦程序不再使用它,它将回收内存。
Go uses a concurrent, tricolor mark-and-sweep algorithm for garbage collection. This algorithm allows GC to run concurrently with the mutator (main program), without a stop-the-world pause — when all goroutines are paused while GC runs. Go GC also aims to utilize no more than 25% of available CPU. Both these features are highly beneficial since it leaves plenty of resources for the mutator to continue running without significant impact to performance (throughout, latency, etc.)
Go 使用并发的三色标记和清除算法进行垃圾收集。 该算法允许 GC 与 mutator(主程序) 并发运行,而没有世界停顿的停顿 - 当 GC 运行时所有 goroutine 都停顿了。 Go GC 还旨在利用不超过 25%的可用 CPU。 这两个功能都是非常有益的,因为它为 mutator 留下了足够的资源来继续运行,而不会对性能造成重大影响 (贯穿,延迟等)。
The algorithm works by dividing objects on the heap into three sets (colors) during the mark phase:
该算法通过在标记阶段将堆上的对象分为三组 (颜色) 来工作:
White = collectible since it’s not in use in memory
白色\= 可收藏,因为未在内存中使用Black = not collectible since it’s definitely in use in memory
黑色\= 无法收集,因为它肯定在内存中使用Grey = might be collectible, not determined yet
灰色\= 可能是可收藏的,尚未确定
As the number of objects on the heap increases, it increases the time spent in the marking phase. Later, this collectible memory is reclaimed during the sweep phase. Sweeping occurs when a goroutine attempts to allocate new objects in memory.
随着堆上对象数量的增加,这会增加标记阶段所花费的时间。 以后,在扫描阶段将回收此可收集的内存。 当 goroutine 尝试在内存中分配新对象时,就会发生清除。
If the rate of memory allocation in the mutator (main program) is very high, then Go GC will start to “steal” more goroutines from the mutator to assist with the marking phase. This has two effects — firstly, it speeds up the GC process by providing more resources, and secondly, it takes away resources from the mutator, which slows down the rate of memory allocation. This is important to ensure that the rate of memory allocation does exceed the rate of memory cleanup, which could cause the heap to grow out of control, potentially resulting in out-of-memory crashes.
如果更改器 (主程序) 中的内存分配率很高,则 Go GC 将开始从更改器中 “窃取” 更多 goroutine,以协助标记阶段。 这有两个作用 - 首先,它通过提供更多资源来加速 GC 进程,其次,它从 mutator 中夺走了资源,这减慢了内存分配的速度。 这对于确保内存分配速率确实超过内存清除速率非常重要,因为这可能导致堆增长失控,并可能导致内存不足崩溃。
When the garbage collector starts to steal resources from the main program, it can start to have a significant impact on the performance of the main program, since CPU resources are limited. This typically manifests in the form of “tail latency”, i.e, the higher percentiles of latency (p99, p999, etc.) compared to the average latency, and can have an adverse effect on user experience. A user will remember the worst or slowest experiences more than the average request, and this can cause user dissatisfaction.
当垃圾收集器开始从主程序中窃取资源时,由于 CPU 资源有限,它可能开始对主程序的性能产生重大影响。 这通常以 “尾部等待时间” 的形式表现出来,即,与平均等待时间相比,等待时间的较高百分位数 (p99,p999 等) 会对用户体验产生不利影响。 用户将记住的最差或最慢的体验比平均请求要多,这可能会导致用户不满意。
Therefore, it’s important to understand the details of memory management and how it can impact your system’s performance and your users’ experience. This writeup explains how to diagnose whether GC pressure is the root cause of your system’s performance problems, identifying which part of the code is responsible, and some steps you can take to address the problem.
因此,了解内存管理的详细信息以及它如何影响系统性能和用户体验非常重要。 该文章说明了如何诊断 GC 压力是否是系统性能问题的根本原因,确定代码的哪一部分负责以及您可以采取一些措施解决该问题。
Usually, the heap includes explicit pointers to structs and sub-fields. Strings and byte arrays are also considered pointers even if the code does not explicitly mark them as pointers, since they are treated as pointers under the hood in Go.
通常,堆包含指向结构和子字段的显式指针。 字符串和字节数组也被视为指针,即使代码未将其明确标记为指针,因为在 Go 中,它们也被视为指针。
Go uses a technique called “escape analysis” to determine what it needs to store on the heap vs the stack. At a high-level, if an object is only referenced within the scope of a particular function call, it can be allocated to the stack for that function. The stack is cleared once the function is done executing, and we lose that object forever. If an object is needed outside that function, it needs to be allocated on the heap so it is accessible later on.
Go 使用一种称为 “转义分析” 的技术来确定需要存储在堆还是堆栈中的内容。 在较高级别上,如果仅在特定函数调用的范围内引用对象,则可以将该对象分配给该函数的堆栈。 一旦函数执行完毕,堆栈将被清除,我们将永远丢失该对象。 如果该函数之外需要一个对象,则需要在堆上分配该对象,以便以后可以访问。
Here’s a blog post that explains escape analysis in more detail.
这是一篇博客文章,更详细地解释了转义分析。
Intuition can help guide you in the right direction. As mentioned above, GC pressure typically results in high tail latency, so if you observe such symptoms, then GC pressure could be the root cause, especially if you know that your program has high memory usage.
直觉可以帮助您指引正确的方向。 如上所述,GC 压力通常会导致较高的尾部等待时间,因此,如果您观察到此类症状,则 GC 压力可能是根本原因,尤其是在您知道程序具有高内存使用量的情况下。
To confirm your hypothesis, you can leverage the Go runtime environment variable GODEBUG. By setting GODEBUG=gctrace=1 when running your program, you can force your program to output debug logs for each GC cycle, detailing the time spent on the various GC phases.
为了确认您的假设,您可以利用 Go 运行时环境变量GODEBUG 。 通过在运行程序时设置GODEBUG = gctrace = 1 ,可以强制您的程序为每个 GC 周期输出调试日志,详细说明在各个 GC 阶段花费的时间。
If you find that your system’s performance metrics (such as spikes in latency) align with the times of the GC cycles, it’s highly likely that the GC cycles are the cause of your performance regressions.
如果您发现系统的性能指标 (例如延迟峰值) 与 GC 周期的时间一致,则很有可能是 GC 周期是导致性能下降的原因。
This blog post from Ardan Labs explains how to use gctrace, and how to read the output.
Ardan Labs 的这篇博客文章介绍了如何使用 gctrace 以及如何读取输出。
Go comes with multiple built-in tools to help diagnose your program’s heap usage. I will primarily focus on two:
Go 带有多个内置工具,可帮助诊断程序的堆使用情况。 我将主要关注两个方面:
内存统计 (Memstats)
The runtime.Memstats library exposes statistics about the system’s memory usage, GC, etc. We can use this library to monitor the the total number of objects on the heap, which we can use as our indicator of success, i.e., once we start making heap optimizations, we expect this metric to drop.
runtime.Memstats库提供有关系统的内存使用情况,GC 等的统计信息。我们可以使用该库来监视堆上的对象总数,这可以用作成功的指标,即一旦开始创建堆优化,我们期望这个指标下降。
From the source code, we see that the HeapObjects field provides us with the relevant data.
从源代码中,我们看到 HeapObjects 字段为我们提供了相关数据。
This blog post provides an example of how to access Memstats data and print it out.
这篇博客文章提供了有关如何访问 Memstats 数据并将其打印出来的示例。
pprof (pprof)
The pprof package can be used to generate a heap profile of your program, and identify the stacktrace for object allocation to see which sections of your code are allocating a large number of heap objects. The pprof CLI also has a method to break down a particular function line-by-line, to identify exactly which line of code is the culprit, and focus our efforts accordingly.
pprof 包可用于生成程序的堆概要文件,并标识用于对象分配的堆栈跟踪,以查看代码的哪些部分正在分配大量堆对象。 pprof CLI 还提供了一种方法,可以逐行分解特定的功能,以准确识别出哪一行代码是罪魁祸首,并相应地集中精力。
The package documentation describes how to expose profiling data as an HTTP endpoint from your program, and examples of commands to run in your terminal to access the profile. Specifically, for heap profiles:
软件包文档描述了如何将概要分析数据作为程序中的 HTTP 端点公开,以及在终端中运行以访问配置文件的命令示例。 具体来说,对于堆配置文件:
go tool pprof [options] http://localhost:6060/debug/pprof/heap// Available options-inuse_space Display in-use memory size-inuse_objects Display in-use object counts-alloc_space Display allocated memory size-alloc_objects Display allocated object counts
This downloads the profile data to your machine as a .pb.gz file, and puts you in an interactive command-line to start visualizing the data. By running the “help” command, you can see all the available options. My personal preference to visualize profile data is to run the following command in a new terminal to open the profile data in an interactive web browser:
这会将配置文件数据作为.pb.gz文件下载到您的计算机,并使您进入交互式命令行以开始可视化数据。 通过运行“帮助”命令,您可以看到所有可用的选项。 我个人希望可视化配置文件数据是在新终端中运行以下命令以在交互式Web浏览器中打开配置文件数据:
go tool pprof -http=localhost:<port> /path/to/profile.pb.gz
In the top left corner, select **“View” > “Flame Graph”** and then **“Sample” > “inuse_objects”** to see a flamegraph of the number of objects allocated. This provides a quick and easy way to visualize which function calls are allocating a large number of objects.
在左上角,选择**“View” > “Flame Graph”** ,然后选择**“Sample” > “inuse_objects”**以查看分配的对象数量的**“View” > “Flame Graph”** 。 这提供了一种快速简便的方法来可视化哪些函数调用正在分配大量对象。
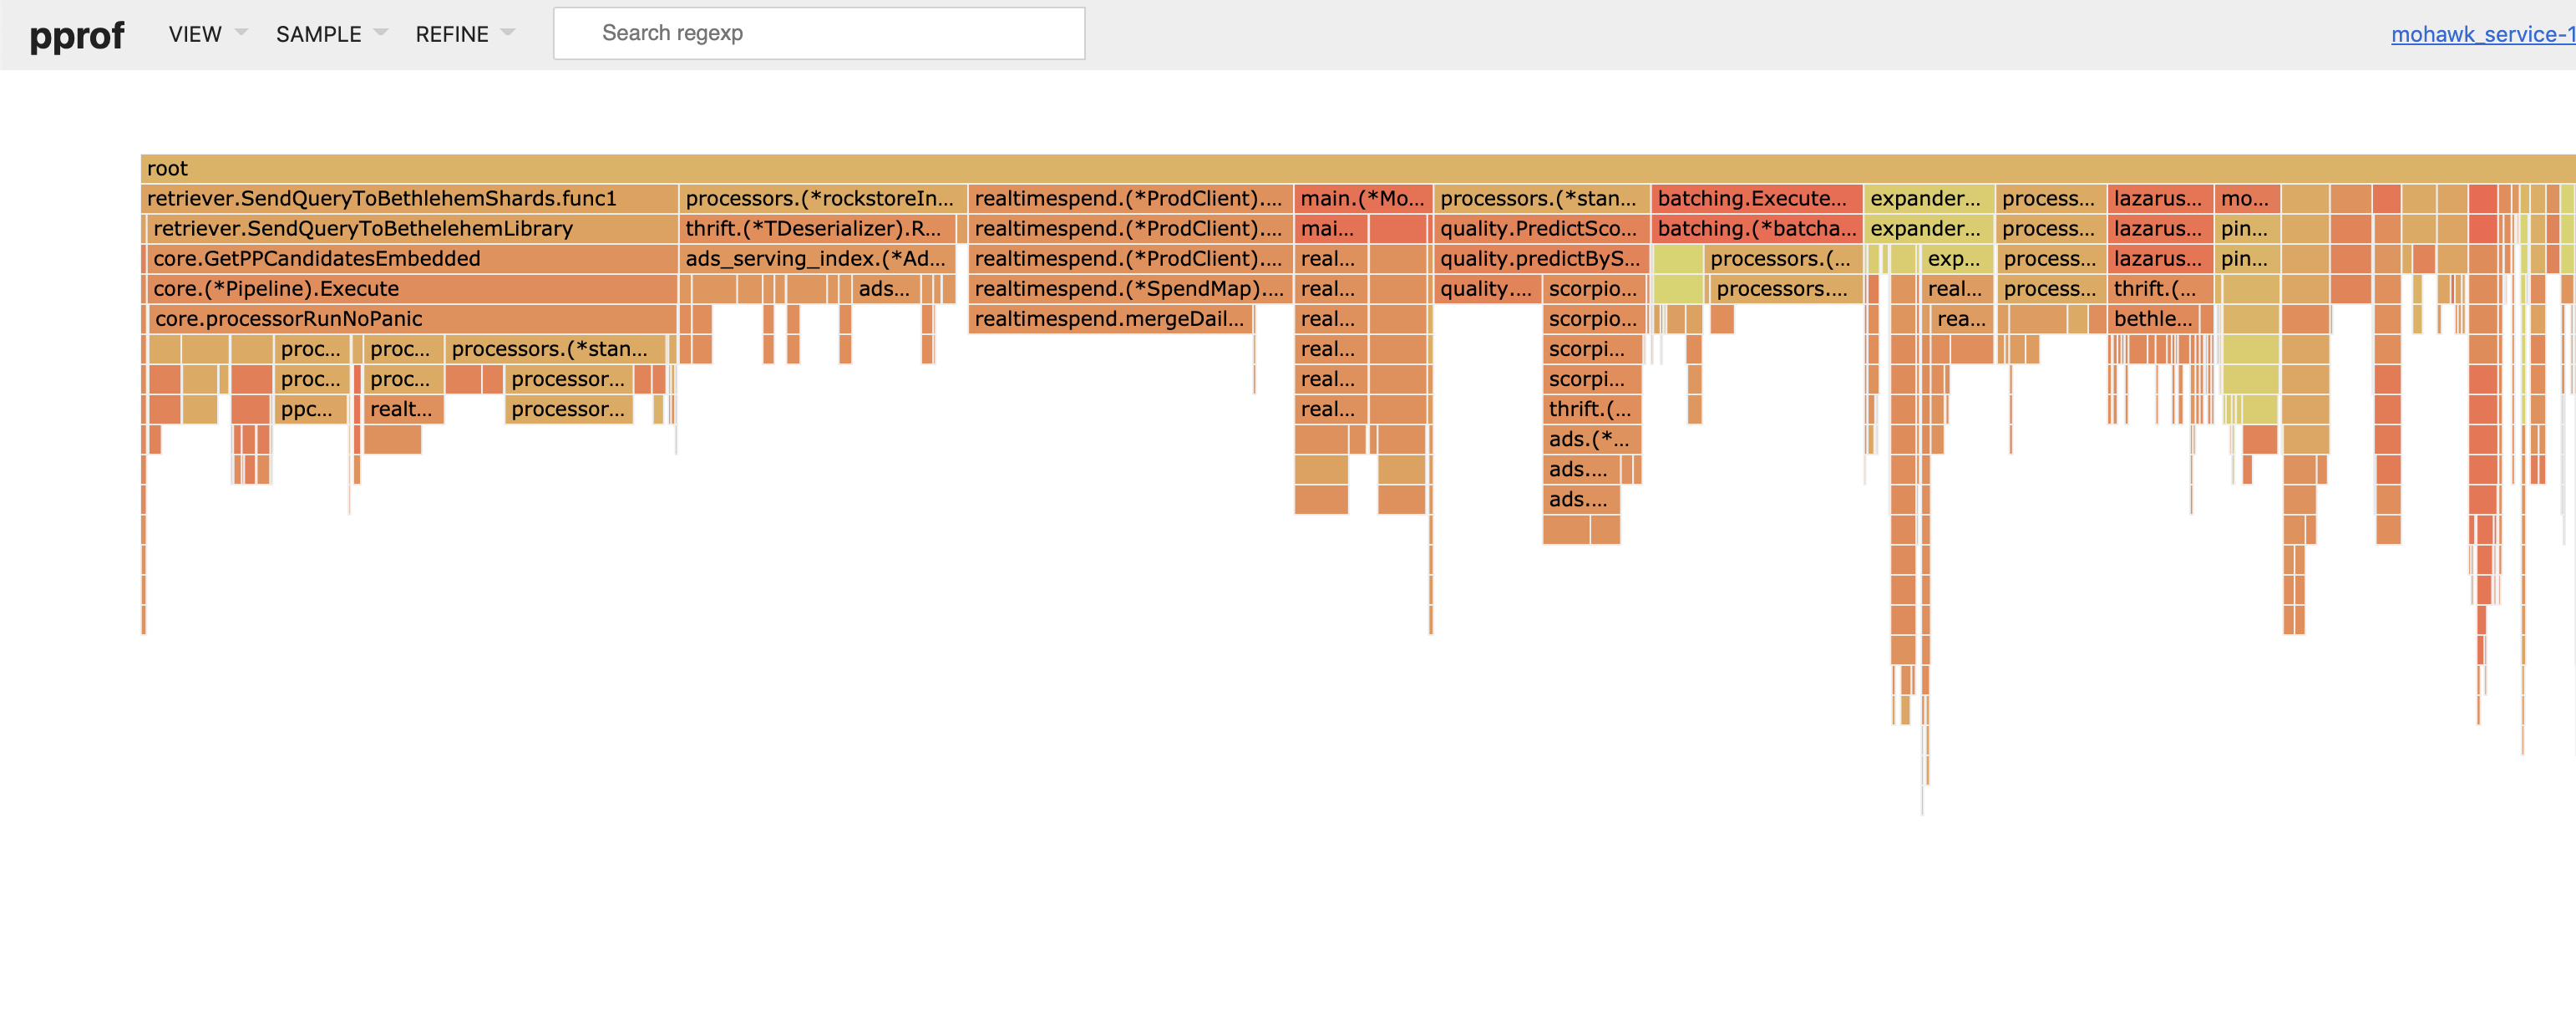
Example flamegraph
火焰图示例
Once you have identified some functions that are contributing a large number of objects, you can go back to the CLI that we entered when we first pulled the profile data. If you lost that window, you can pull it up again by running:
一旦确定了一些有助于大量对象的功能,就可以返回我们第一次提取配置文件数据时输入的CLI。 如果丢失了该窗口,则可以通过运行以下命令再次将其上拉:
go tool pprof -inuse_objects /path/to/profile.pb.gz
In here, we can use the **list** command to see how many objects are allocated by each line of a method. Run list <YourMethodName> to print out the data in your terminal:
在这里,我们可以使用**list**命令查看方法的每一行分配了多少个对象。 运行list <YourMethodName>以打印出终端中的数据:
This produces a line-by-line output, like the following. In this case, we can see that lines 233 and 237 create new objects resulting in a large number of heap allocations, while line 241 which adds the objects to a map also causes a large number of heap allocations.
这样会产生逐行输出,如下所示。 在这种情况下,我们可以看到第233行和第237行创建了导致大量堆分配的新对象,而将对象添加到映射的第241行也导致了大量堆分配。
(pprof) list createCatalogMapTotal: 132263423ROUTINE ======================== <CODE_PATH> 105268459 105268459 (flat, cum) 79.59% of Total . 63815675 233: product := BuildProduct(productID, productPrice, productSellerID) . . 234: if productPrice < minProductPrice { . . 235: minProductPrice = productPrice . . 236: } . 20726392 237: catalogListing := catalogs.CreateListing(product, contextFeatures) . . 238: . . 239: // Create listing key in string format by concatenating base64 encodings of the productID, sellerID, and catalog version . . 240: catalogListingKey := catalogs.CreateListingKey(productID, sellerID, catalogListing.GetVersion()) 20726392 20726392 241: catalogMap[catalogListingKey] = catalogListing . . 242: return catalogMap
Here’s a blog post with further examples of how to use the pprof web UI
这是一篇博客文章,其中包含有关如何使用pprof Web UI的更多示例
As previously discussed, one of the primary factors resulting in expensive Garbage Collection is the number of objects on heap. By optimizing our code to reduce the number of long-lived objects on heap, we can minimize the resources spent on GC, and improve our system performance.
如前所述,导致昂贵的垃圾收集的主要因素之一是堆上的对象数量。 通过优化代码以减少堆上的长期对象的数量,我们可以最大程度地减少在GC上花费的资源,并提高系统性能。
Here are some suggestions on how to do so:
以下是一些有关这样做的建议:
减少长寿物品的数量 (Reduce the number of long-living objects)
Rather than having objects live on the heap, they can be created as values rather than references on demand. For instance, if we need some data for each item in a user request, rather than precomputing and storing it in a long-lived map, we can compute it on a per-request basis to reduce the number of objects on the heap.
可以将对象创建为值而不是按需引用,而不是使对象驻留在堆上。 例如,如果我们需要用户请求中每个项目的一些数据,而不是将其预先计算并存储在长寿命的映射中,则可以基于每个请求进行计算以减少堆中的对象数量。
删除指针中的指针 (Remove pointers within pointers)
If we have a reference to an object, and the object itself contains further pointers, these are all considered individual objects on the heap even though they may be nested. By changing these nested values to be non-pointers, we can reduce the number of objects to be scanned.
如果我们有对一个对象的引用,并且该对象本身包含其他指针,则即使它们可能是嵌套的,也都将它们视为堆上的单个对象。 通过将这些嵌套值更改为非指针,我们可以减少要扫描的对象的数量。
避免不必要的字符串/字节数组分配 (Avoid unnecessary string/byte array allocations)
Since strings/bytes arrays are treated as pointers under the hood, each one is an object on the heap. If possible, try to represent these as other non-pointer values such as integers/floats, time.Time for dates, etc.
由于字符串/字节数组在幕后被视为指针,因此每个数组都是堆上的一个对象。 如果可能,请尝试将它们表示为其他非指针值,例如整数/浮点数,时间,日期时间等。
Looking at the createCatalogMap example from above, if we replace our map key which was previously a string with a struct containing the IDs instead, we see the number of heap objects drop by ~26 million (20%).
从上面查看createCatalogMap示例,如果我们将映射键(以前是一个string替换为包含ID的struct ,则会看到堆对象的数量减少了约2600万(20%)。
(pprof) list createCatalogMapTotal: 106261986ROUTINE ======================== <CODE_PATH> 34768 84576835 (flat, cum) 79.59% of Total . 63815675 233: product := BuildProduct(productID, productPrice, productSellerID) . . 234: if productPrice < minProductPrice { . . 235: minProductPrice = productPrice . . 236: } . 20726392 237: catalogListing := catalogs.CreateListing(product, contextFeatures) . . 238: . . 239: structKey := CatalogKeyStruct{ . . 240: ProductID: productID, . . 241: SellerID: productSellerID, . . 242: CatalogVersion: catalogListing.GetVersion(), . . 243: } 34768 34768 244: catalogMap[structKey] = catalogListing . . 245: return catalogMap
对象池 (Object pooling)
If your program tends to create a large number of short-lived objects in bursts, you may benefit from object pools, which can be used to allocate and free memory blocks manually. This can reduce the number of GC cycles needed, since the pool retains these objects for a longer scope, so we don’t need to keep allocating and cleaning up these objects.
如果您的程序倾向于突发创建大量短期对象,则您可能会受益于对象池,该对象池可用于手动分配和释放内存块。 由于池将这些对象保留更长的范围,因此可以减少所需的GC周期数,因此我们不需要继续分配和清理这些对象。
Note: Object pools can cause memory leaks if not used properly, so this is only recommended if you know what you’re doing
注意:如果使用不正确,对象池可能会导致内存泄漏,因此仅当您知道自己在做什么时才建议这样做
清理未使用的字段(Clean up unused fields)
Basic types in Go have default values (i.e., bool defaults to false, int defaults to 0, etc.), so if you have unused fields of these types, they are still consuming memory. An unused field is one that is no longer being read, used for online request serving, or offline logging. Removing such a field should be a no-op.
Go中的基本类型具有默认值(即bool默认为false , int默认为0等),因此,如果您有未使用的这些类型的字段,它们仍会占用内存。 未使用的字段是不再被读取,用于在线请求服务或脱机日志记录的字段。 删除此类字段应为空。
By removing these fields, we lower the program’s memory usage, and make the code more readable and easy to understand.
通过删除这些字段,我们降低了程序的内存使用率,并使代码更具可读性和易于理解。
从堆中迁移数据 (Migrate data off the heap)
If we remove data from the heap, we drastically reduce the amount of work that the garbage collector needs to do. One option here is to migrate the data to an external source (for example, in a microservice architecture, we may have a performant key-value store that can be leveraged for such a use case). It’s important to consider the additional overhead of making a request to fetch the data from this external source.
如果我们从堆中删除数据,则将大大减少垃圾收集器需要完成的工作量。 这里的一种选择是将数据迁移到外部源(例如,在微服务体系结构中,我们可能具有可用于这种用例的高性能键值存储)。 重要的是要考虑发出请求从此外部源获取数据的额外开销。
Another option is to leverage an open-source Go package to store data off the heap, but still within our system’s memory. Here is one such package.
另一个选择是利用开源Go包在堆外存储数据,但仍将其存储在系统内存中。 这是一个这样的包裹。
Note: Using off-heap storage can cause problems if not used properly, so this is only recommended if you know what you’re doing
注意:如果使用不当,使用堆外存储会引起问题,因此仅当您知道自己在做什么时才建议这样做
重新排列结构以降低内存使用量(Rearrange your structs for lower memory usage)
The Go memory allocator does not optimize for data structure alignment, so by rearranging the fields of your struct, you can lower your memory usage. For example, if we consider the following two objects, the GoodObject uses 16 bytes while the BadObject uses 24 bytes due to more optimal data alignment. The two bools are allocated on the same line in memory, as opposed to the first line having just one bool and padding, the second line being the int64, and then the last line again having one bool and padding.
Go内存分配器并未针对数据结构对齐进行优化,因此,通过重新排列结构的字段,可以降低内存使用量。 例如,如果我们考虑以下两个对象,则由于更优化的数据对齐, GoodObject使用16个字节,而BadObject使用24个字节。 两个bools被分配在存储器中的相同的行,而不是仅具有一个第一线路bool和填充,第二行是所述int64 ,然后最后一行再次具有一个bool和填充。
Go Playground Linktype BadObject struct { A bool B int64 C bool}type GoodObject struct { A bool C bool B int64}
The Go garbage collector is highly optimized for most use cases and developers mostly do not need to worry about the details of its implementation and performance. However, for some heavy use cases, the garbage collector may cause significant impact to program performance.
Go垃圾收集器针对大多数用例进行了高度优化,并且开发人员通常不需要担心其实现和性能的细节。 但是,对于某些繁重的用例,垃圾收集器可能会对程序性能产生重大影响。
Hopefully this blog posts helps you understand how to leverage the tools provided by Go to diagnose performance regressions caused by heavy memory usage, and provides you with some ideas of how to optimize your system to minimize the impact of garbage collection.
希望本博客文章可以帮助您了解Go提供的工具,以诊断由于内存占用过多而导致的性能下降,并为您提供一些有关如何优化系统以最大程度地减少垃圾收集影响的想法。 https://blog.csdn.net/weixin_26716079/article/details/109070870 ```

若有收获,就点个赞吧
0 人点赞
