Go语言内置了获取程序运行数据的工具,包括以下两个标准库:
runtime/pprof: 采集工具型应用运行数据进行分析net/http/pprof: 采集服务型应用运行时数据进行分析
pprof开启后,每隔一段时间(10ms)就会收集当前的堆栈信息,获取各个函数占用的CPU以及内存资源,然后通过对这些采样数据进行分析,形成一个性能分析报告。
性能优化主要有一下几个方面:
- CPU Profile:报告程序的CPU使用情况,按照一定频率去采集应用程序在CPU和寄存器上面的数据。
- Memory Profile(Heap Profile):报告程序的内存使用情况。
- Block Profiling: 报告goroutines不在运行状态的情况,可以用来分析和查找死锁等性能瓶颈。
- Goroutine Profiling: 报告goroutines的使用情况,有哪些roroutines,它们的调用关系是怎样的。
搭建
实例代码:
package mainimport ("net/http""github.com/gin-contrib/pprof""github.com/gin-gonic/gin")func main() {app := gin.Default()pprof.Register(app) // 性能app.GET("/test", func(c *gin.Context) {c.String(http.StatusOK, "test")})app.Run(":3000")}
package pprofimport ("net/http""net/http/pprof""github.com/gin-gonic/gin")const (// DefaultPrefix url prefix of pprofDefaultPrefix = "/debug/pprof")func getPrefix(prefixOptions ...string) string {prefix := DefaultPrefixif len(prefixOptions) > 0 {prefix = prefixOptions[0]}return prefix}// Register the standard HandlerFuncs from the net/http/pprof package with// the provided gin.Engine. prefixOptions is a optional. If not prefixOptions,// the default path prefix is used, otherwise first prefixOptions will be path prefix.func Register(r *gin.Engine, prefixOptions ...string) {RouteRegister(&(r.RouterGroup), prefixOptions...)}// RouteRegister the standard HandlerFuncs from the net/http/pprof package with// the provided gin.GrouterGroup. prefixOptions is a optional. If not prefixOptions,// the default path prefix is used, otherwise first prefixOptions will be path prefix.func RouteRegister(rg *gin.RouterGroup, prefixOptions ...string) {prefix := getPrefix(prefixOptions...)prefixRouter := rg.Group(prefix){prefixRouter.GET("/", pprofHandler(pprof.Index))prefixRouter.GET("/cmdline", pprofHandler(pprof.Cmdline))prefixRouter.GET("/profile", pprofHandler(pprof.Profile))prefixRouter.POST("/symbol", pprofHandler(pprof.Symbol))prefixRouter.GET("/symbol", pprofHandler(pprof.Symbol))prefixRouter.GET("/trace", pprofHandler(pprof.Trace))prefixRouter.GET("/allocs", pprofHandler(pprof.Handler("allocs").ServeHTTP))prefixRouter.GET("/block", pprofHandler(pprof.Handler("block").ServeHTTP))prefixRouter.GET("/goroutine", pprofHandler(pprof.Handler("goroutine").ServeHTTP))prefixRouter.GET("/heap", pprofHandler(pprof.Handler("heap").ServeHTTP))prefixRouter.GET("/mutex", pprofHandler(pprof.Handler("mutex").ServeHTTP))prefixRouter.GET("/threadcreate", pprofHandler(pprof.Handler("threadcreate").ServeHTTP))}}func pprofHandler(h http.HandlerFunc) gin.HandlerFunc {handler := http.HandlerFunc(h)return func(c *gin.Context) {handler.ServeHTTP(c.Writer, c.Request)}}
编译并运行代码。代码运行之后可以看到系统自动增加了很多/debug/pprof的API。通过这些API我们可以看到需要的数据。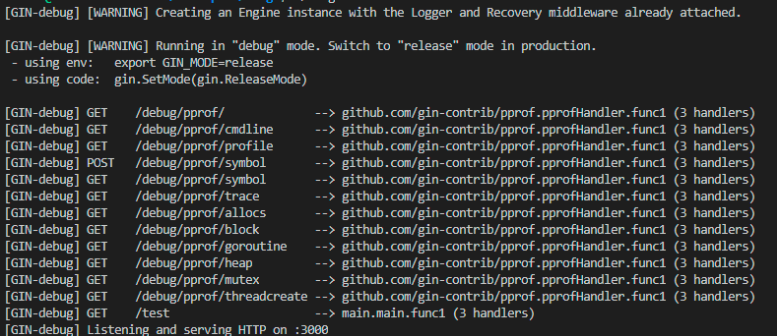
在浏览器里访问/debug/pprof, 通过这个页面我们可以看到我们需要的所有数据: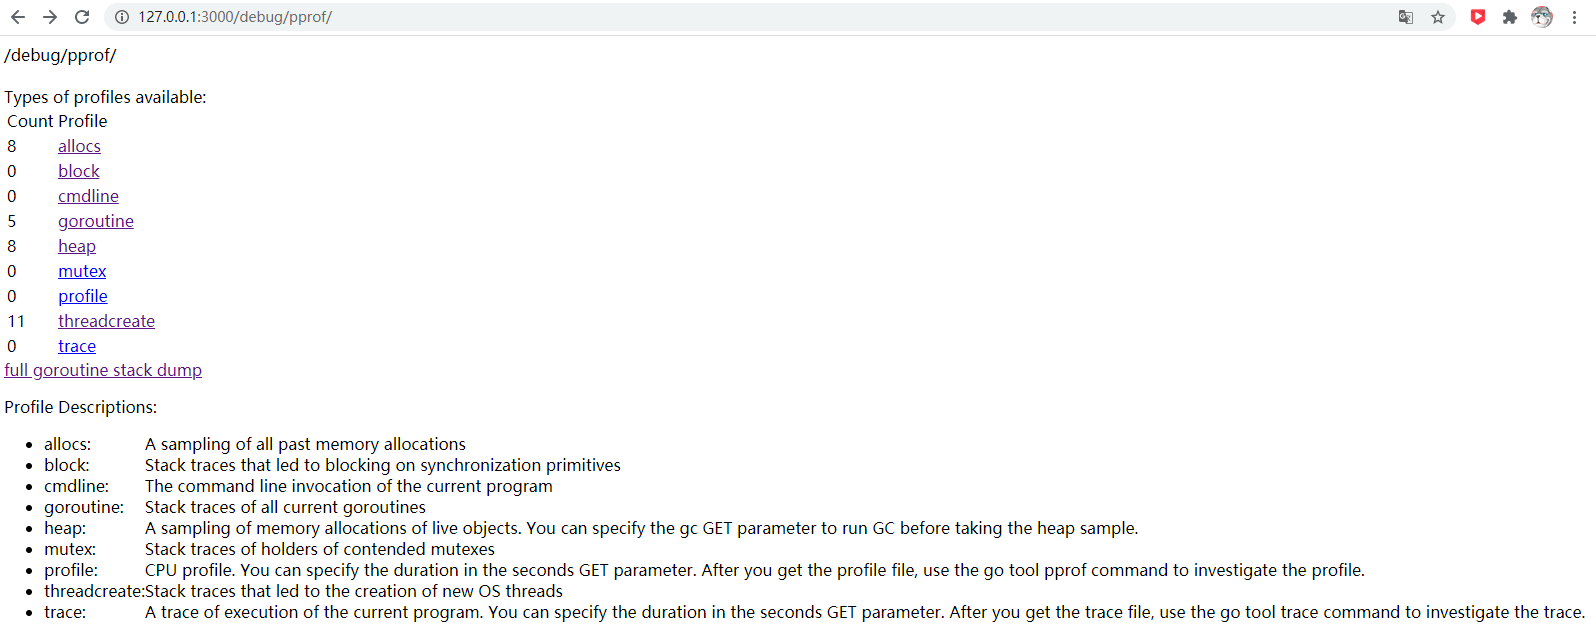 这几个路径表示的是
- /debug/pprof/profile:访问这个链接会自动进行 CPU profiling,持续 30s,并生成一个文件供下载
- /debug/pprof/block:Goroutine阻塞事件的记录。默认每发生一次阻塞事件时取样一次。
- /debug/pprof/goroutines:活跃Goroutine的信息的记录。仅在获取时取样一次。
- /debug/pprof/heap: 堆内存分配情况的记录。默认每分配512K字节时取样一次。
- /debug/pprof/mutex: 查看争用互斥锁的持有者。
- /debug/pprof/threadcreate: 系统线程创建情况的记录。 仅在获取时取样一次。
使用go tool pprof采集数据
go tool pprof http://localhost:3000/debug/pprof/profile?second=30
上述命令的意思是采集cpu数据并持续30S。执行结果如下:
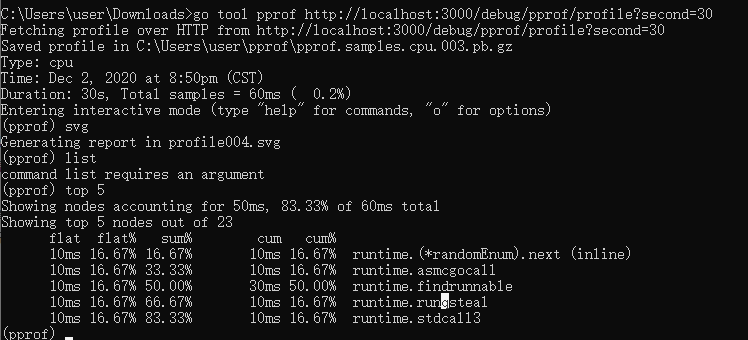
top命令展示函数的5个数据:
- flat: 函数执行时间
- flat%: 函数执行时间与总时间的百分比
- sum%: 前面每一行flat%的和
- cum: 累计量,加入函数调用了其它函数,其它函数的执行时间也会被记入
- cum%: 累计量占总量的百分比

若有收获,就点个赞吧
0 人点赞
