写于:2018-12-20 12:11:30
一、Spring Boot Actuator: Production-ready features
Spring Boot includes a number of additional features to help you monitor and manage your application when you push it to production. You can choose to manage and monitor your application by using HTTP endpoints or with JMX. Auditing, health, and metrics gathering can also be automatically applied to your application.
spring 官方的说法
Spring Boot Actuator 是为生产准备的特性。可以通过 HTTP 端点,或者JMX 来监控和管理 Spring Boot 应用。Spring Boot Actuator 提供了:审计,健康,指标运行状况等信息,并且还提供了扩展能力,能够自定义监控信息。
Spring Boot 应用 引入 Actuator 能力也很简单,只需要引入:spring-boot-starter-actuator 依赖 即可。
版本问题:在 Spring Boot 2.1.5.RELEASE 中,为了安全考虑,Spring Boot Actator 默认只开启了:info,health 功能。其他的需要手动进行开启。
二、Spring Boot Actuator 常见的监控能力
| ID | 功能介绍 |
|---|---|
| beans | 显示 Spring 上下文中注册 Bean |
| env | 显示环境变量信息 |
| health | 应用健康信息 |
| httptrace | http请求监控数据 |
| info | 自定义应用信息 |
| mappings | 显示所有的 @RequestMapping 路径信息 |
| scheduledtasks | 应用中的调度任务 |
| shutdown | 应用优雅停机 |
表格中列举了 spring-Boot-Actuator 提供的一些常见应用监控能力及对应的请求 URL。
下面通过 URL 请求 来看看个别监控信息的数据显示
通过查看官方文档,或者
**/actuatror**接口获取相关监测 API,URL 列表。
请求 /actuator/env 获取当前 Spring Boot 应用的环境变量信息
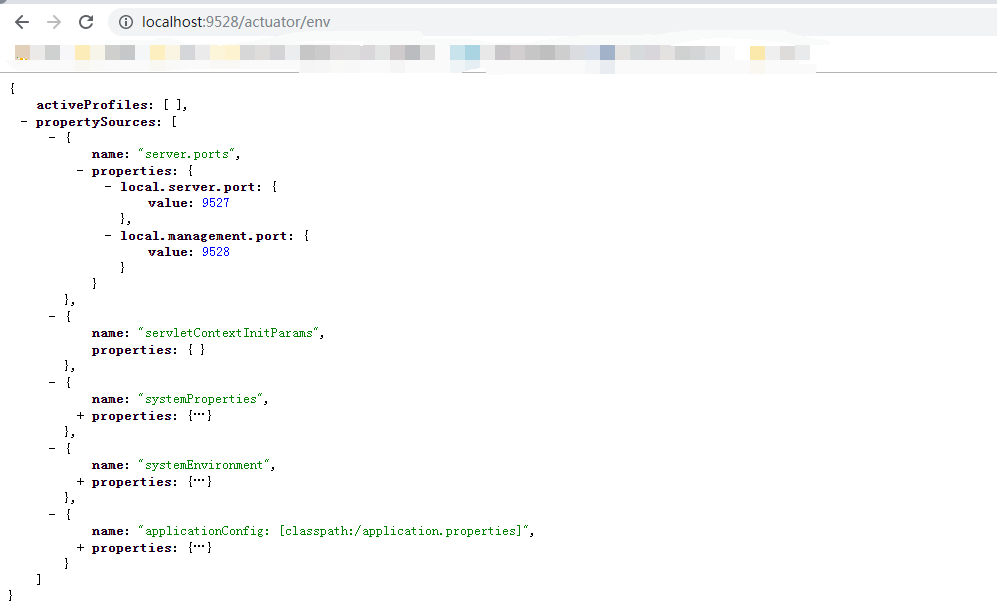
针对 Spring Boot 应用中不同的环境变量进行区分展示,如:系统环境、servlet 上下文环境等。
请求 /actuator/beans 获取当前 Spring Boot 应用 IOC 容器中的 Bean信息
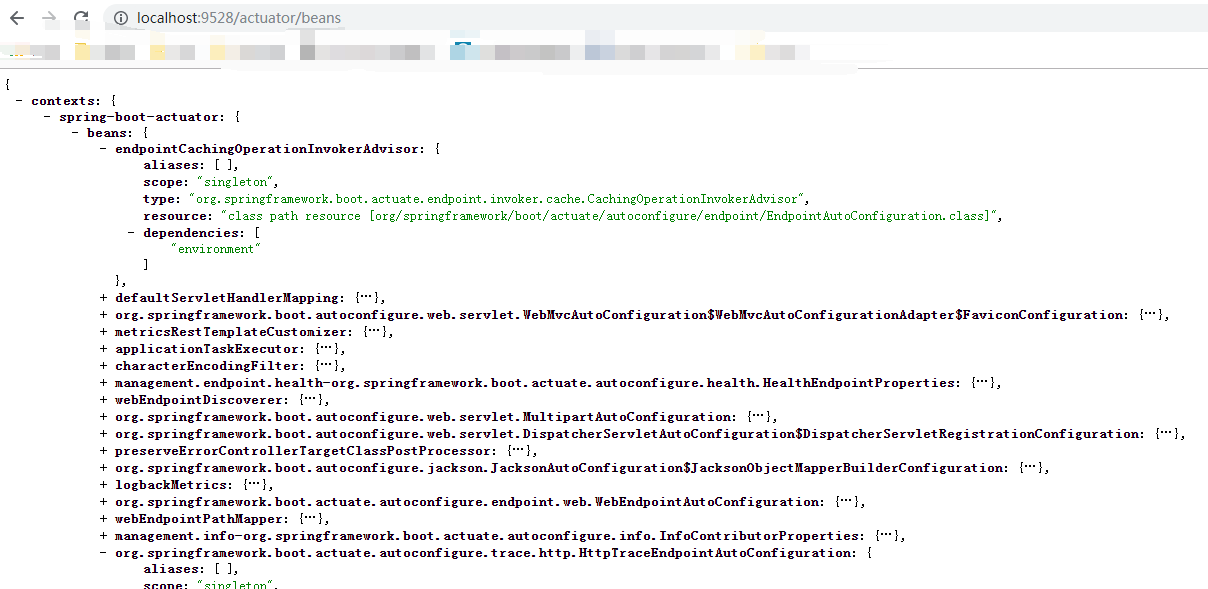
列举了 Spring Boot 应用中,对应的 IOC 容器中的 Bean 信息,譬如:别名(aliases)、生命周期(scope)等 Bean 信息。
请求 /actuator/httptrace 获取当前 Spring Boot 应用 HTTP 请求监测数据

针对每次 HTTP 请求进行数据记录:包括但不限于:请求时间、请求头等信息、请求 URL、响应信息等。
三、自定义健康指标检测器
实现 HealthIndicator 重写 health()
3.1、测试代码
@Componentpublic class SelfHealthInterceptor implements HealthIndicator {@Overridepublic Health health() {System.err.println("模拟进行一大堆的判定");// return Health.up().build();return Health.down().build();}}
3.2、结果
- 一:控制台打印信息
- 二:/health 请求数据返回
{status: "DOWN",selfHealthInterceptor: {status: "DOWN"},diskSpace: {status: "UP",total: 85901438976,free: 20284055552,threshold: 10485760}}
四、生产环境中 Actuator 使用注意事项
actuator 接口开放接口数据设计敏感数据,比如:env等接口。
为了保证系统系统安全,在引入 actuator时,需要按需开放 endpint 端点,同时需要引入 sercurity框架对接口进行安全校验管控。

若有收获,就点个赞吧
0 人点赞
