Linux top
在 Linux 操作系统上, top 命令:主要用于实时显示 process 的动态。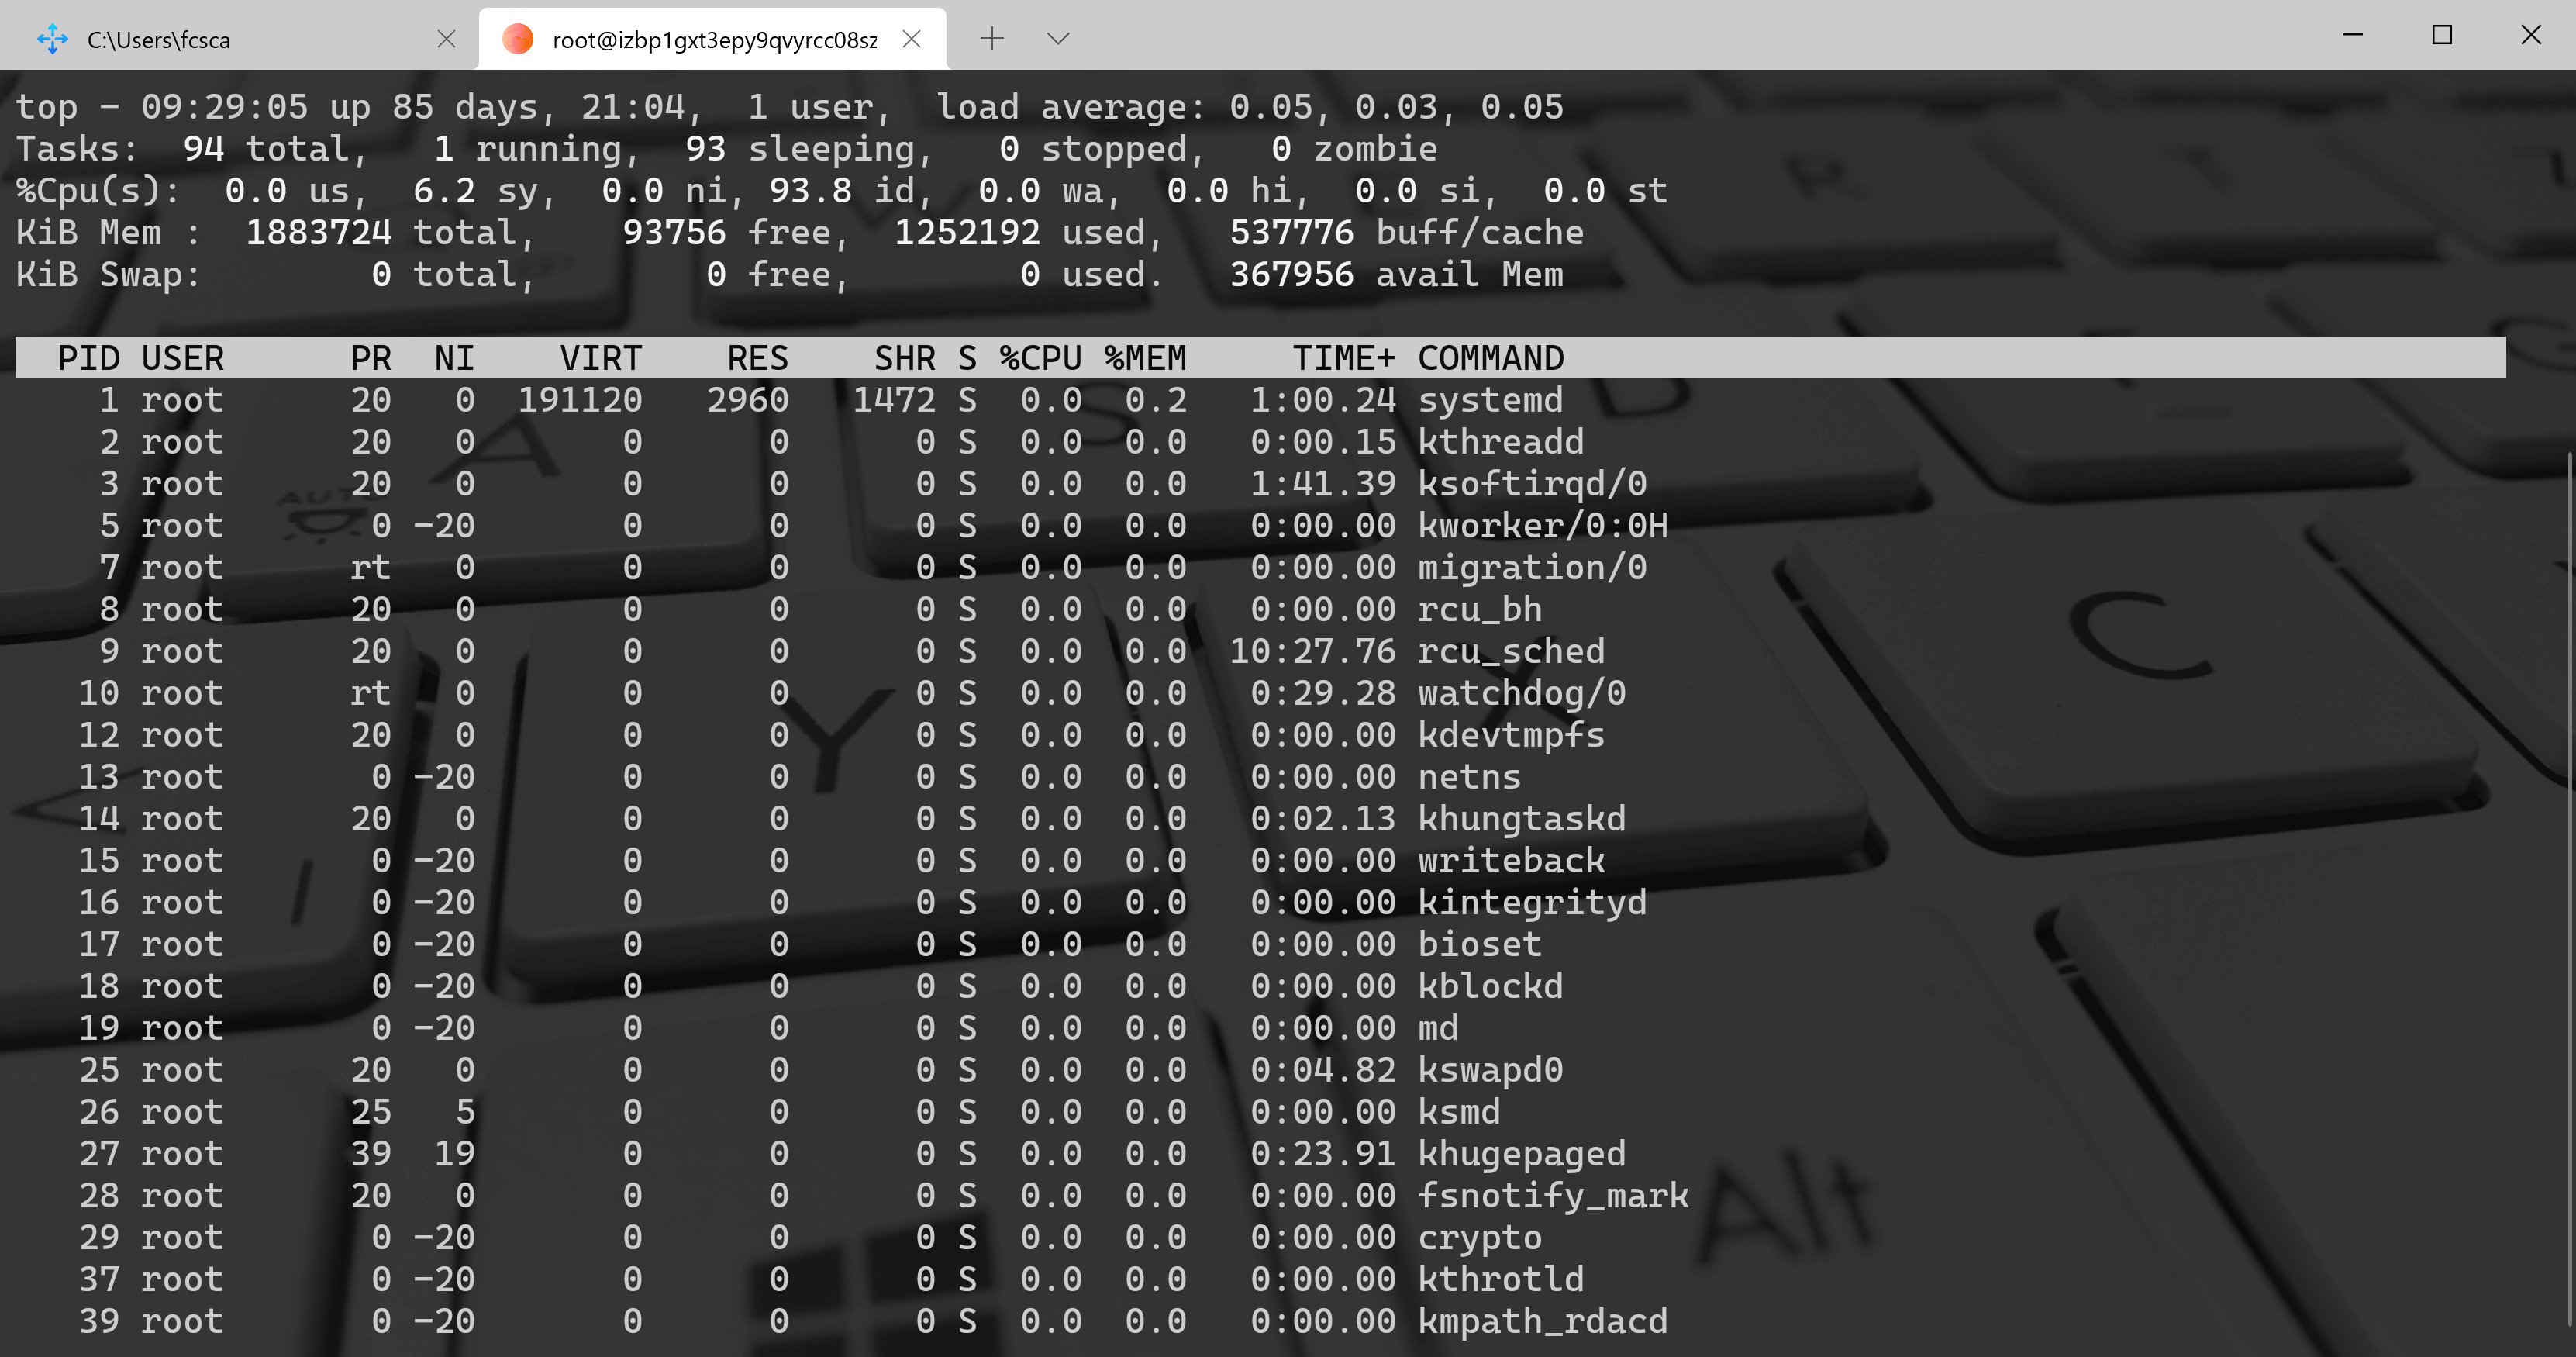
终端下执行命令:top,然后按下键盘上的某个键位,top 命令将会有不同的效果进行展示;1:显示每个 CPU 的运行情况。可以看到设备上有多少个 CPU,设备台数多的话将会被占满整个屏幕;z:进入高亮模式,将显示红色终端字体。再次按z可还原到最原始的终端字体;b:高亮显示正在运行的命令,s 为 R 的进程;c:显示 COMMAND 列的所有信息,包括一些参数;t:更直观的方式展示 task/cpu 信息;m:更置换的方式展示 mem 信息;M:根据内存的使用率进行排序。%MEM 列。P:根据 CPU 的使用率进行排序。%CPU 列。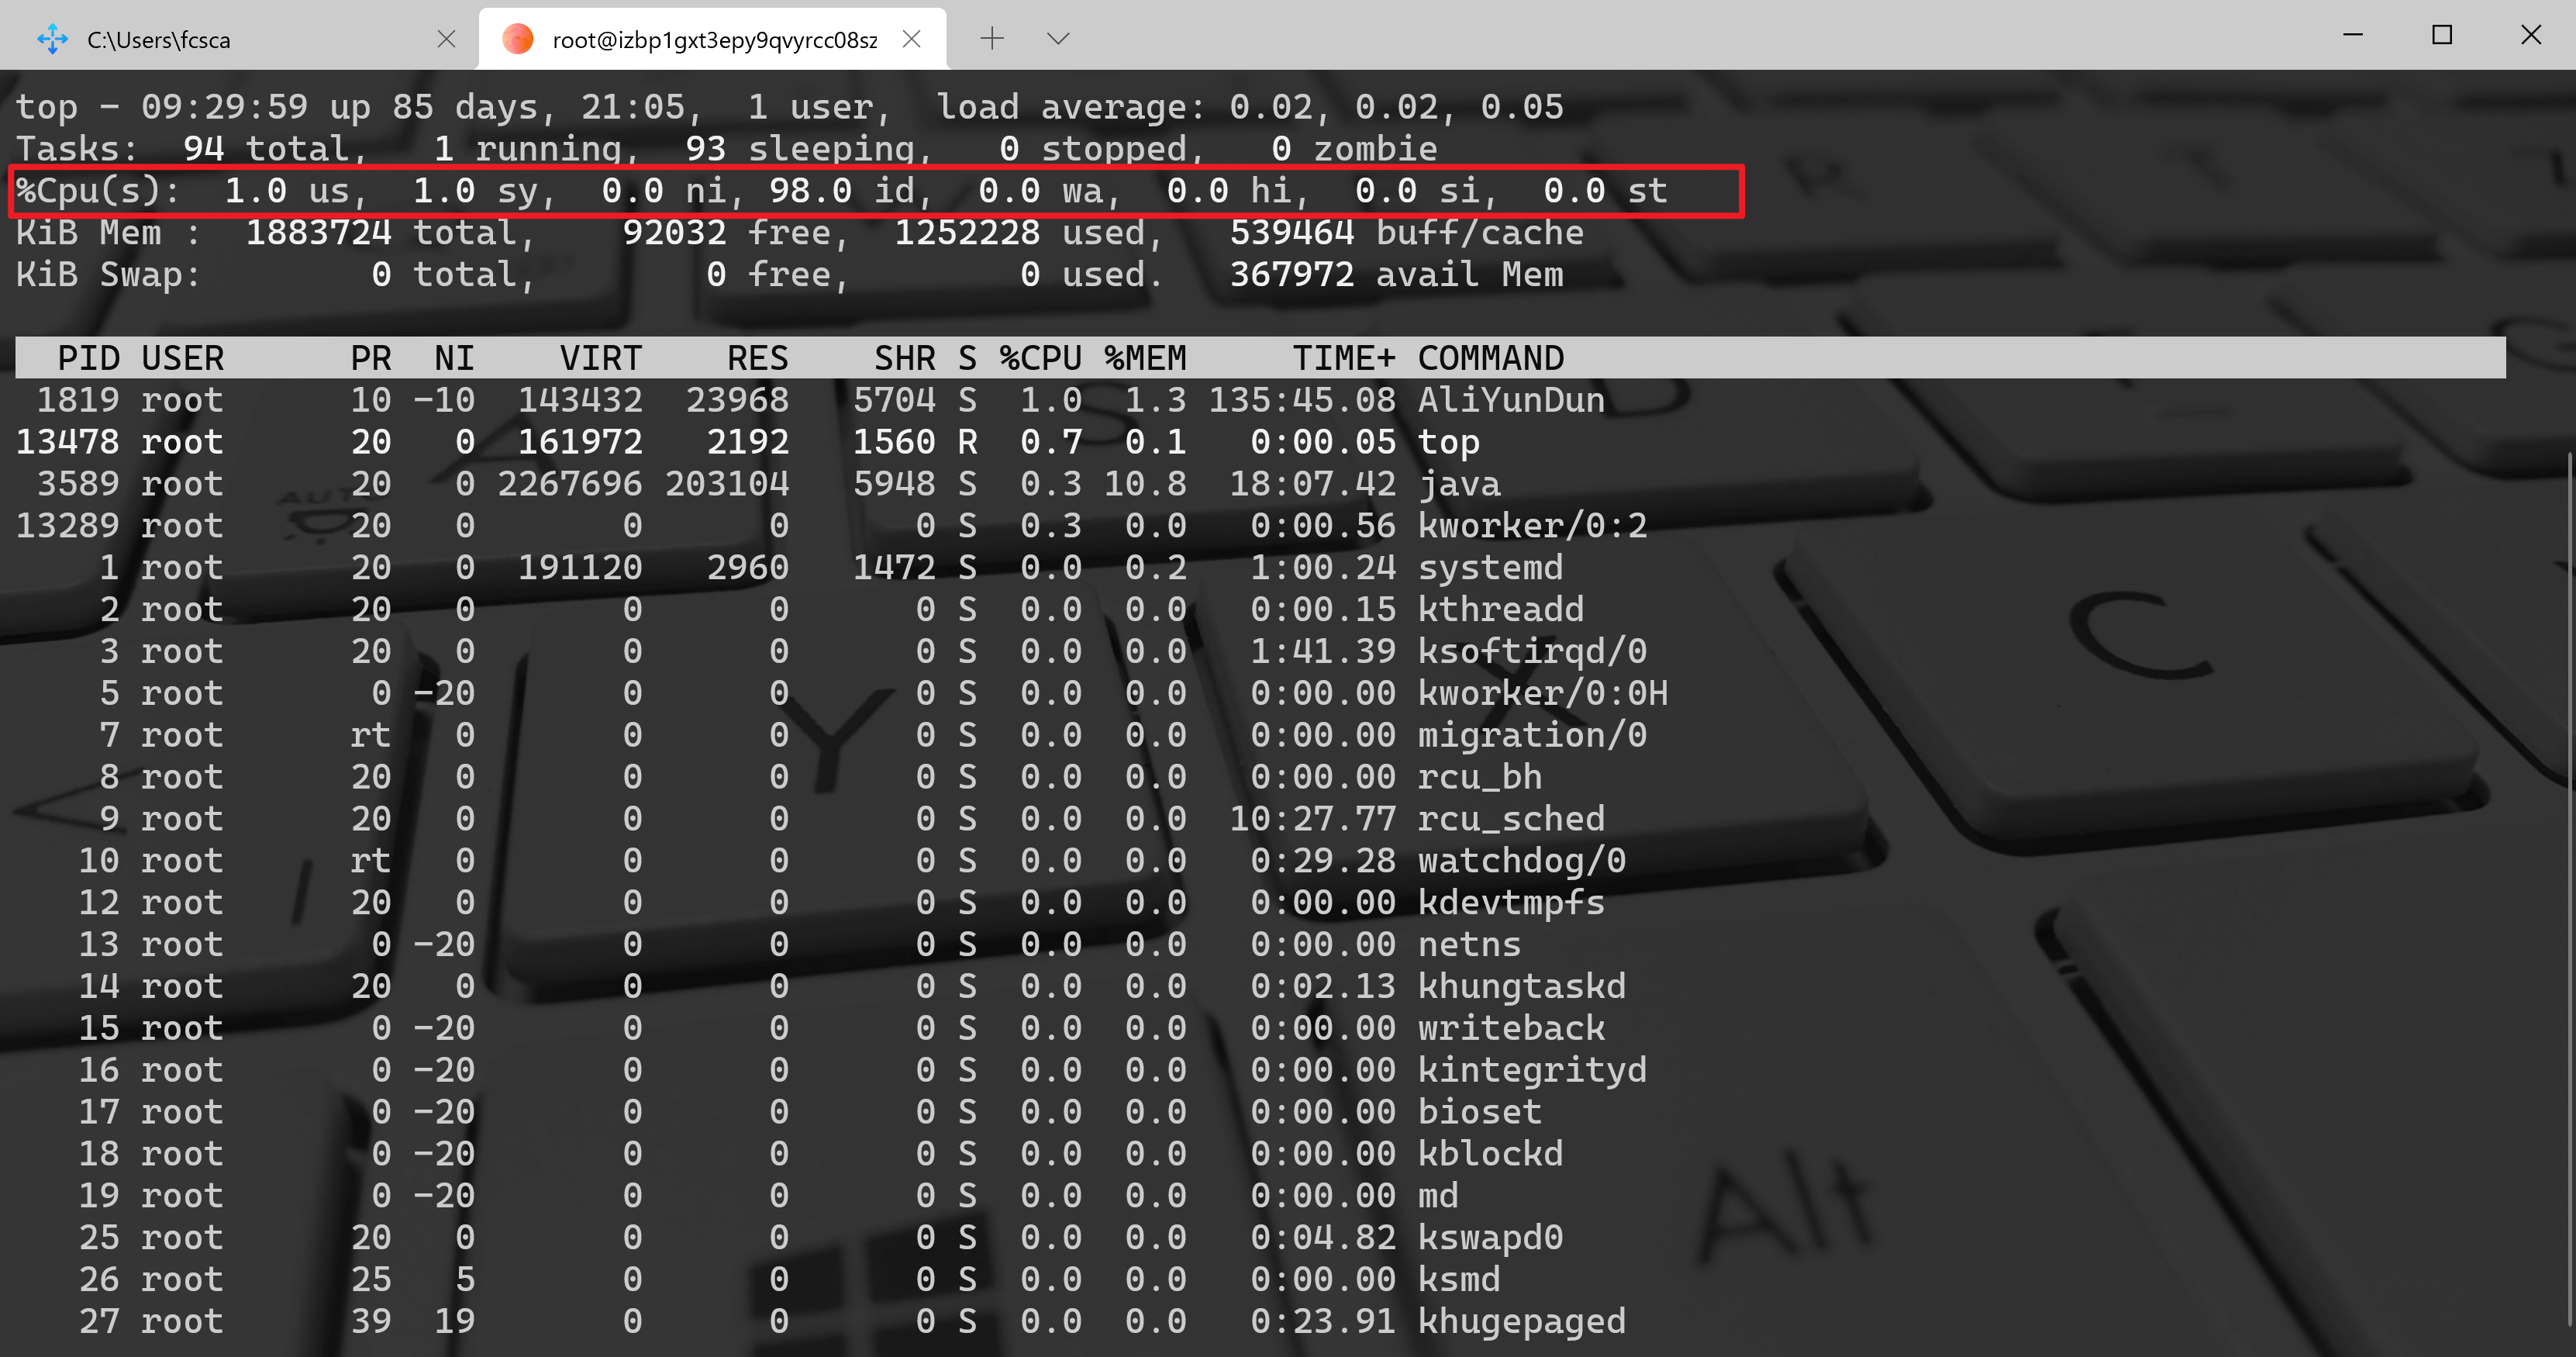
介绍一下这些 CPU 使用率的意义:
us:user time,表示 CPU 执行用户进程的时间,包括 nice 时间。通常都是希望用户空间CPU越高越好。sy:system time,表示 CPU 在内核运行的时间,包括 IRQ 和 softirq。系统 CPU 占用越高,表明系统某部分存在瓶颈。通常这个值越低越好。ni:nice time,具有优先级的用户进程执行时占用的 CPU 利用率百分比。id:idle time,表示系统处于空闲期,等待进程运行。wa:waiting time,表示 CPU 在等待 IO 操作完成所花费的时间。系统不应该花费大量的时间来等待 IO 操作,否则就说明 IO 存在瓶颈。hi:hard IRQ time,表示系统处理硬中断所花费的时间。si:soft IRQ time,表示系统处理软中断所花费的时间。st:steal time,被强制等待(involuntary wait)虚拟 CPU 的时间,此时 Hypervisor 在为另一个虚拟处理器服务。
时钟中断
首先要知道统计 CPU 使用情况在什么地方执行的。在分析之前,先来了解下 时钟中断:
时钟中断:是一种硬中断,由时间硬件(系统定时器,一种可编程硬件)产生。当 CPU 接收到时钟中断信号后,会在处理完当前指令后调用 时钟中断处理程序 来完成更新系统时间、执行周期性任务等。
可以发现,统计 CPU 使用情况是在 时钟中断处理程序 中完成的。
每个 CPU 的使用情况通过 cpu_usage_stat 结构来记录,来看看其定义:
struct cpu_usage_stat {cputime64_t user;cputime64_t nice;cputime64_t system;cputime64_t softirq;cputime64_t irq;cputime64_t idle;cputime64_t iowait;cputime64_t steal;cputime64_t guest;};
从 cpu_usage_stat 结构的定义可以看出,其每个字段与 top 命令的 CPU 使用率类型一一对应。在内核初始化时,会为每个 CPU 创建一个 cpu_usage_stat 结构,用于统计 CPU 的使用情况。
现在来分析下内核是怎么统计 CPU 的使用情况的。
每次执行 时钟中断处理程序 都会调用 account_process_tick 函数进行 CPU 使用情况统计,分析一下 account_process_tick 函数的实现:
void account_process_tick(struct task_struct *p, int user_tick){cputime_t one_jiffy_scaled = cputime_to_scaled(cputime_one_jiffy);struct rq *rq = this_rq();// 说明:user_tick 变量标识当前是否处于执行用户应用程序if (user_tick) {// 1. 如果 CPU 在执行用户程序, 那么调用 account_user_time 进行统计account_user_time(p, cputime_one_jiffy, one_jiffy_scaled);} else if ((p != rq->idle) || (irq_count() != HARDIRQ_OFFSET)) {// 2. 如果 CPU 在执行内核代码, 那么调用 account_system_time 进行统计account_system_time(p, HARDIRQ_OFFSET, cputime_one_jiffy,one_jiffy_scaled);} else {// 3. 否则说明 CPU 在执行 idle 进程(也就是处于空闲状态), 那么调用 account_idle_time 进行统计account_idle_time(cputime_one_jiffy);}}
account_process_tick 函数主要分 3 种情况进行统计,如下:
- 如果 CPU 在执行用户程序,那么调用
account_user_time进行统计。 - 如果 CPU 在执行内核代码,那么调用
account_system_time进行统计。 否则说明 CPU 在执行 idle 进程(也就是处于空闲状态),那么调用
account_idle_time进行统计。CPU 使用情况统计
1. 统计用户程序执行时间
统计用户程序的执行时间是通过
account_user_time函数来完成的,来看看其实现:void account_user_time(struct task_struct *p, cputime_t cputime,cputime_t cputime_scaled){// 获取 CPU 的统计结构(每个CPU一个 cpu_usage_stat 结构)struct cpu_usage_stat *cpustat = &kstat_this_cpu.cpustat;cputime64_t tmp;...// 分 2 种情况统计 CPU 的使用情况// 1. 如果进程的 nice 值大于0, 那么将会统计到 nice 字段中// 2. 如果进程的 nice 值小于等于0, 那么将会统计到 user 字段中if (TASK_NICE(p) > 0)cpustat->nice = cputime64_add(cpustat->nice, tmp);elsecpustat->user = cputime64_add(cpustat->user, tmp);...}
account_user_time函数主要分两种情况统计:如果进程的
nice值大于0,那么将会增加到 CPU 统计结构的nice字段中。- 如果进程的
nice值小于等于0,那么增加到 CPU 统计结构的user字段中。
这里说明一下进程 nice 值的作用,nice 值越大,说明进程的优先级越低。所以,nice 统计值主要用来统计低优先级进程的占使用 CPU 的情况。也说明了,user 和 nice 统计值都属于执行用户程序的 CPU 时间。
2. 统计内核代码执行时间
如果在发生时钟中断前,CPU 处于内核态,也就是说在执行内核代码。那么将会调用 account_system_time 函数进行统计,account_system_time 函数实现如下:
void account_system_time(struct task_struct *p, int hardirq_offset,cputime_t cputime, cputime_t cputime_scaled){// 获取 CPU 的统计结构(每个CPU一个 cpu_usage_stat 结构)struct cpu_usage_stat *cpustat = &kstat_this_cpu.cpustat;cputime64_t tmp;...// 主要分 3 种情况进行统计// 1. 如果当前处于硬中断执行上下文, 那么统计到 irq 字段中// 2. 如果当前处于软中断执行上下文, 那么统计到 softirq 字段中// 3. 否则统计到 system 字段中if (hardirq_count() - hardirq_offset)cpustat->irq = cputime64_add(cpustat->irq, tmp);else if (softirq_count())cpustat->softirq = cputime64_add(cpustat->softirq, tmp);elsecpustat->system = cputime64_add(cpustat->system, tmp);...}
account_system_time 函数主要分 3 种情况进行统计:
- 如果当前处于硬中断执行上下文,那么增加到 CPU 统计结构的
irq字段中。 - 如果当前处于软中断执行上下文,那么增加到 CPU 统计结构的
softirq字段中。 - 否则增加到 CPU 统计结构的
system字段中。
从上面代码可以看出,irq 和 softirq 统计值也算是内核代码执行时间。
3. idle 进程执行时间统计
当系统中没有可运行的进程时,将会执行 idle 进程。也就是说,当系统执行 idle 进程时,表示系统正处于空闲状态。idle 进程执行时间统计由 account_idle_time 函数完成,其实现如下:
void account_idle_time(cputime_t cputime){struct cpu_usage_stat *cpustat = &kstat_this_cpu.cpustat;cputime64_t cputime64 = cputime_to_cputime64(cputime);struct rq *rq = this_rq();// 分 2 种情况统计 CPU 的使用情况// 1. 如果系统有进程正在等待 I/O 操作完成, 那么将统计到 iowait 字段中// 2. 否则将统计到 idle 字段中if (atomic_read(&rq->nr_iowait) > 0)cpustat->iowait = cputime64_add(cpustat->iowait, cputime64);elsecpustat->idle = cputime64_add(cpustat->idle, cputime64);}
account_idle_time 函数也分两种情况进行统计:
- 如果系统中有正在等待 I/O 操作完成的进程,那么增加到 CPU 统计结构的
iowait字段中。 - 否则增加到 CPU 统计结构的
idle字段中。
从上面的分析可以看出,iowait 统计值也属于空闲时间的一种。
top 命令的 CPU 使用率
通过源码分析,可以知道 top 命令中 CPU 使用率各种类型的意思,现在来介绍一下 top 命令是怎么计算各种类型的 CPU 使用率。
要获取各个 CPU 的使用情况信息,可以通过读取 /proc/stat 文件获取,如下:
[vagrant@localhost ~]$ cat /proc/statcpu 245 10 1142 1097923 95 0 28 0 0 0cpu0 245 10 1142 1097923 95 0 28 0 0 0...
上面的结果显示了 CPU 的使用情况信息,第一行代表所有 CPU 的总和,而第二行开始表示每个 CPU 核心的使用情况信息。因为我的电脑只有一个核,所以只有一条数据。
下面说说这些数据的意义,从第一个数值开始分别代表:user,nice,system,idle,iowait, irq,softirq,steal。
所以,top 命令的 CPU 使用率计算公式如下:
CPU总时间 = user + nice + system + idle + wait + irq + softirq + steal%us = user / CPU总时间%ni = nice / CPU总时间%sy = system / CPU总时间%id = idel / CPU总时间%wa = wait / CPU总时间%hi = irq / CPU总时间%si = softirq / CPU总时间%st = steal / CPU总时间

若有收获,就点个赞吧
0 人点赞
