- 1. Overview
- 2. Base recalibration procedure details
- 3. Important factors for successful recalibration
- 4. Examples of pre- and post-recalibration metrics
- 5. Recalibration report
- :GATKTable:true:1:17::;
- :GATKTable:Arguments:Recalibration argument collection values used in this run
- :GATKTable:true:2:94:::;
- :GATKTable:Quantized:Quality quantization map
- :GATKTable:false:6:18:%s:%s:%.4f:%.4f:%d:%d:;
- :GATKTable:RecalTable0:
- :GATKTable:false:6:274:%s:%s:%s:%.4f:%d:%d:;
- :GATKTable:RecalTable1:
- :GATKTable:false:8:1003738:%s:%s:%s:%s:%s:%.4f:%d:%d:;
- :GATKTable:RecalTable2:
| BQSR stands for Base Quality Score Recalibration. In a nutshell, it is a data pre-processing step that detects systematic errors made by the sequencing machine when it estimates the accuracy of each base call. | BQSR是指碱基质量分数重新校准。 简而言之,它是一个数据预处理步骤,检测测序机在估计每个碱基call的准确性时产生的系统误差。 |
|---|---|
| Note that this base recalibration process (BQSR) should not be confused with variant recalibration (VQSR), which is a sophisticated filtering technique applied on the variant callset produced in a later step. The developers who named these methods wish to apologize sincerely to anyone, especially Spanish-speaking users, who get tripped up by the similarity of these names. | 请注意,这个碱基重新校准过程(BQSR)不应该与变体重新校准(VQSR)相混淆,后者是一种复杂的过滤技术,应用于后面步骤中产生的变体呼叫集。 命名这些方法的开发者希望向任何被这些名称的相似性绊倒的人,特别是讲西班牙语的用户真诚地道歉。 |
1. Overview
It’s all about the base, ‘bout the base (quality scores)
| Base quality scores are per-base estimates of error emitted by the sequencing machines; they express how confident the machine was that it called the correct base each time. For example, let’s say the machine reads an A nucleotide, and assigns a quality score of Q20 — in Phred-scale, that means it’s 99% sure it identified the base correctly. This may seem high, but it does mean that we can expect it to be wrong in one case out of 100; so if we have several billion base calls (we get ~90 billion in a 30x genome), at that rate the machine would make the wrong call in 900 million bases — which is a lot of bad bases. The quality score each base call gets is determined through some dark magic jealously guarded by the manufacturer of the sequencing machines. | 碱基质量分数是测序仪发出的每个碱基的错误估计;它们表示机器对每次调用正确的碱基有多大信心。 例如,假设机器读取了一个A核苷酸,并给出了Q20的质量分数—在Phred尺度中,这意味着它有99%的把握能正确识别该碱基。 这看起来很高,但它确实意味着我们可以预期100个案例中有一个是错误的;因此,如果我们有几十亿个碱基调用(我们在30x的基因组中得到约900亿个),按照这个比率,机器会在9亿个碱基中做出错误的调用—这就会有很多的坏碱基。 每个碱基调用得到的质量分数是通过一些黑暗的魔法来确定的,这些魔法被测序机的制造商小心翼翼地保护着 |
|---|---|
| Why does it matter? Because our short variant calling algorithms rely heavily on the quality score assigned to the individual base calls in each sequence read. This is because the quality score tells us how much we can trust that particular observation to inform us about the biological truth of the site where that base aligns. If we have a base call that has a low quality score, that means we’re not sure we actually read that A correctly, and it could actually be something else. So we won’t trust it as much as other base calls that have higher qualities. In other words we use that score to weigh the evidence that we have for or against a variant allele existing at a particular site. | 为什么这很重要?因为我们的短变体调用算法在很大程度上依赖于分配给每个序列读数中单个碱基调用的质量分数。 这是因为质量分数告诉我们,我们可以在多大程度上相信该特定的观察结果,以告知我们该碱基所对准的部位的生物学真相。 如果我们有一个质量分数很低的碱基调用,这意味着我们不确定我们是否真的正确读取了那个A,它实际上可能是别的东西。所以我们不会像其他质量较高的基数调用那样信任它。换句话说,我们用这个分数来权衡我们拥有的支持或反对某一特定部位存在变异等位基因的证据。 |
Okay, so what is base recalibration?
| Unfortunately the scores produced by the machines are subject to various sources of systematic (non-random) technical error, leading to over- or under-estimated base quality scores in the data. Some of these errors are due to the physics or the chemistry of how the sequencing reaction works, and some are probably due to manufacturing flaws in the equipment. | 不幸的是,机器产生的分数会受到各种来源的系统(非随机)技术误差的影响,导致数据中的基础质量分数被高估或低估。 这些错误有些是由于测序反应的物理或化学原理造成的,有些可能是由于设备的制造缺陷造成的。 |
|---|---|
| Base quality score recalibration (BQSR) is a process in which we apply machine learning to model these errors empirically and adjust the quality scores accordingly. For example we can identify that, for a given run, whenever we called two A nucleotides in a row, the next base we called had a 1% higher rate of error. So any base call that comes after AA in a read should have its quality score reduced by 1%. We do that over several different covariates (mainly sequence context and position in read, or cycle) in a way that is additive. So the same base may have its quality score increased for one reason and decreased for another. | 基础质量分数重新校准(BQSR)是一个过程,在这个过程中,我们应用机器学习对这些错误进行经验建模,并相应地调整质量分数。 例如,我们可以确定,对于一个特定的运行,只要我们连续调用两个A核苷酸,我们调用的下一个碱基的错误率就会高出1%。 因此,任何在读数中AA之后的碱基调用都应该使其质量分数降低1%。我们对几个不同的协变量(主要是序列背景和在read中的位置,或周期)以一种加法的方式来做。 因此,同一个碱基可能会因为一个原因而增加其质量分数,又因为另一个原因而减少。 |
| This allows us to get more accurate base qualities overall, which in turn improves the accuracy of our variant calls. To be clear, we can’t correct the base calls themselves, i.e. we can’t determine whether that low-quality A should actually have been a T — but we can at least tell the variant caller more accurately how far it can trust that A. Note that in some cases we may find that some bases should have a higher quality score, which allows us to rescue observations that otherwise may have been given less consideration than they deserve. Anecdotally our impression is that sequencers are more often over-confident than under-confident, but we do occasionally see runs from sequencers that seemed to suffer from low self-esteem. | 这使我们在整体上得到更准确的碱基质量,这反过来又提高了我们变异体调用的准确性。 明确地说,我们不能纠正碱基调用本身,也就是说,我们不能确定那个低质量的A实际上是否应该是T — 但我们至少可以更准确地告诉变体调用者它可以在多大程度上相信那个A。 注意,在某些情况下,我们可能发现一些碱基应该有更高的质量分数,这使我们能够挽救那些否则可能被考虑得不够充分的观察。 从轶事上看,我们的印象是,测序者往往是过度自信,而不是自信不足,但我们偶尔也会看到测序者的运行似乎受到自卑的影响。 |
| This procedure can be applied to BAM files containing data from any sequencing platform that outputs base quality scores on the expected scale. We have run it ourselves on data from several generations of Illumina, SOLiD, 454, Complete Genomics, and Pacific Biosciences sequencers. | 这个程序可以应用于包含来自任何测序平台的数据的BAM文件,这些平台在预期范围内输出基础质量分数。我们已经对来自几代Illumina、SOLiD、454、Complete Genomics和Pacific Biosciences测序仪的数据进行了测试。 |
That sounds great! How does it work?
| The base recalibration process involves two key steps: first the BaseRecalibrator tool builds a model of covariation based on the input data and a set of known variants, producing a recalibration file; then the ApplyBQSR tool adjusts the base quality scores in the data based on the model, producing a new BAM file. The known variants are used to mask out bases at sites of real (expected) variation, to avoid counting real variants as errors. Outside of the masked sites, every mismatch is counted as an error. The rest is mostly accounting. | 碱基重新校准过程包括两个关键步骤:首先,BaseRecalibrator工具根据输入数据和一组已知变体建立一个共变模型,产生一个重新校准文件; 然后,ApplyBQSR工具根据该模型调整数据中的碱基质量分数,产生一个新的BAM文件。 已知变异体被用来掩盖真实(预期)变异部位的碱基,以避免将真实变异体算作错误。 在屏蔽的位点之外,每一个错配都被算作一个错误。其余的主要是核算。 |
|---|---|
| There is an optional but highly recommended step that involves building a second model and generating before/after plots to visualize the effects of the recalibration process. This is useful for quality control purposes. | 有一个可选的但强烈推荐的步骤,涉及建立第二个模型,并生成前后图,以可视化重新校准过程的效果。 这对质量控制是很有用的。 |
2. Base recalibration procedure details
BaseRecalibrator builds the model
| To build the recalibration model, this first tool goes through all of the reads in the input BAM file and tabulates data about the following features of the bases: - read group the read belongs to - quality score reported by the machine - machine cycle producing this base (Nth cycle = Nth base from the start of the read) - current base + previous base (dinucleotide) |
为了建立重新校准模型,这第一个工具会浏览输入的BAM文件中的所有read,并将有关碱基的以下特征的数据列表: - 该读数所属的read组 - 机器报告的质量分数 - 产生这个碱基的机器周期(第N个周期=从read开始的第N个碱基) - 当前碱基+前一个碱基(二核苷酸)。 |
|---|---|
| For each bin, we count the number of bases within the bin and how often such bases mismatch the reference base, excluding loci known to vary in the population, according to the known variants resource (typically dbSNP). This information is output to a recalibration file in GATKReport format. | 对于每个bin,我们计算bin内的碱基数量以及这些碱基与参考碱基不匹配的频率,根据已知变异体资源(通常是dbSNP),排除已知在人群中变化的位点。 这些信息被输出到GATKReport格式的重新校准文件中 |
| Note that the recalibrator applies a “yates” correction for low occupancy bins. Rather than inferring the true Q score from # mismatches / # bases we actually infer it from (# mismatches + 1) / (# bases + 2). This deals very nicely with overfitting problems, which has only a minor impact on data sets with billions of bases but is critical to avoid overconfidence in rare bins in sparse data. | 请注意,重新校准器对低占有率仓进行了 “yates “校正。我们不是从#错配/#碱基来推断真实的Q分数,而是从(#错配+1)/(#碱基+2)来推断。 这很好地处理了过拟合问题,这对有数十亿个碱基的数据集只有很小的影响,但对避免稀疏数据中的稀有仓的过度自信至关重要。 |
ApplyBQSR adjusts the scores
| This second tool goes through all the reads again, using the recalibration file to adjust each base’s score based on which bins it falls in. So effectively the new quality score is: - the sum of the global difference between reported quality scores and the empirical quality - plus the quality bin specific shift - plus the cycle x qual and dinucleotide x qual effect |
第二个工具再次检查所有的reads,使用重新校准文件来调整每个碱基的分数,基于它所处的分类。因此,新的质量分数实际上是: - 报告的质量分数与经验质量之间的总体差异之和 - 加上质量仓的具体转变 - 加上周期x质量和二核苷酸x质量的影响 |
|---|---|
| Following recalibration, the read quality scores are much closer to their empirical scores than before. This means they can be used in a statistically robust manner for downstream processing, such as variant calling. In addition, by accounting for quality changes by cycle and sequence context, we can identify truly high quality bases in the reads, often finding a subset of bases that are Q30 even when no bases were originally labeled as such. | 经过重新校准,reads的质量分数比以前更接近其经验分数。 这意味着它们可以以统计学的方式用于下游处理,如变体调用。 此外,通过考虑周期和序列环境的质量变化,我们可以在reads中识别真正的高质量碱基,通常可以找到一个Q30的碱基子集,即使最初没有碱基被标记为Q30。 |
3. Important factors for successful recalibration
Read groups
| The recalibration system is read-group aware, meaning it uses @RG tags to partition the data by read group. This allows it to perform the recalibration per read group, which reflects which library a read belongs to and what lane it was sequenced in on the flowcell. We know that systematic biases can occur in one lane but not the other, or one library but not the other, so being able to recalibrate within each unit of sequence data makes the modeling process more accurate. As a corollary, that means it’s okay to run BQSR on BAM files with multiple read groups. However, please note that the memory requirements scale linearly with the number of read groups in the file, so that files with many read groups could require a significant amount of RAM to store all of the covariate data. | 重新校准系统是感知read组的,意味着它使用@RG标签按read组划分数据。 这使得它可以按read组进行重新校正,这反映了一个read属于哪个库,以及它在流式细胞上的哪个泳道上测序。 我们知道,系统性偏差可能发生在一个泳道,而不是另一个泳道,或者一个库,而不是另一个库,所以能够在每个单元的序列数据中进行重新校准,使建模过程更加准确。 作为一个推论,这意味着在有多个read组的BAM文件上运行BQSR是可以的。 然而,请注意,内存要求与文件中read组的数量成线性比例,所以有许多read组的文件可能需要大量的RAM来存储所有的协变量数据。 |
|---|---|
Amount of data
| A critical determinant of the quality of the recalibration is the number of observed bases and mismatches in each bin. This procedure will not work well on a small number of aligned reads. We usually expect to see more than 100M bases per read group; as a rule of thumb, larger numbers will work better. | 决定重新校准质量的一个关键因素是每个bin中观察到的碱基和错配的数量。 这个程序在少量对齐的read上不能很好地工作。我们通常希望看到每个read有超过100M的碱基;作为经验法则,更大的数字会更好。 |
|---|---|
No excuses
| You should almost always perform recalibration on your sequencing data. In human data, given the exhaustive databases of variation we have available, almost all of the remaining mismatches — even in cancer — will be errors, so it’s super easy to ascertain an accurate error model for your data, which is essential for downstream analysis. For non-human data it can be a little bit more work since you may need to bootstrap your own set of variants if there are no such resources already available for you organism, but it’s worth it. | 你几乎应该总是对你的测序数据进行重新校准。在人类数据中,鉴于我们有详尽的变异数据库,几乎所有剩余的错配—甚至在癌症中—都是错误的,所以为你的数据确定一个准确的错误模型是非常容易的,这对下游分析至关重要。 对于非人类的数据来说,这可能需要更多的工作,因为如果你的生物体没有这样的资源,你可能需要引导你自己的变体集,但这是值得的。 |
|---|---|
| Here’s how you would bootstrap a set of known variants: - First do an initial round of variant calling on your original, unrecalibrated data. - Then take the variants that you have the highest confidence in and use that set as the database of known variants by feeding it as a VCF file to the BaseRecalibrator. - Finally, do a real round of variant calling with the recalibrated data. These steps could be repeated several times until convergence. |
以下是你如何引导一组已知变异体的方法: - 首先对你的原始的、未经校准的数据进行第一轮变体调用。 - 然后选取你最有信心的变体,将其作为已知变体的数据库,将其作为VCF文件输入到BaseRecalibrator。 - 最后,用重新校准的数据做一轮真正的变体调用。这些步骤可以重复数次,直到收敛。 |
| The main case figure where you really might need to skip BQSR is when you have too little data (some small gene panels have that problem), or you’re working with a really weird organism that displays insane amounts of variation. | 你真正需要跳过BQSR的主要情况是,你的数据太少(一些小的基因小组有这个问题),或者你正在处理一个非常奇怪的生物体,它显示出疯狂的变异量。 |
4. Examples of pre- and post-recalibration metrics
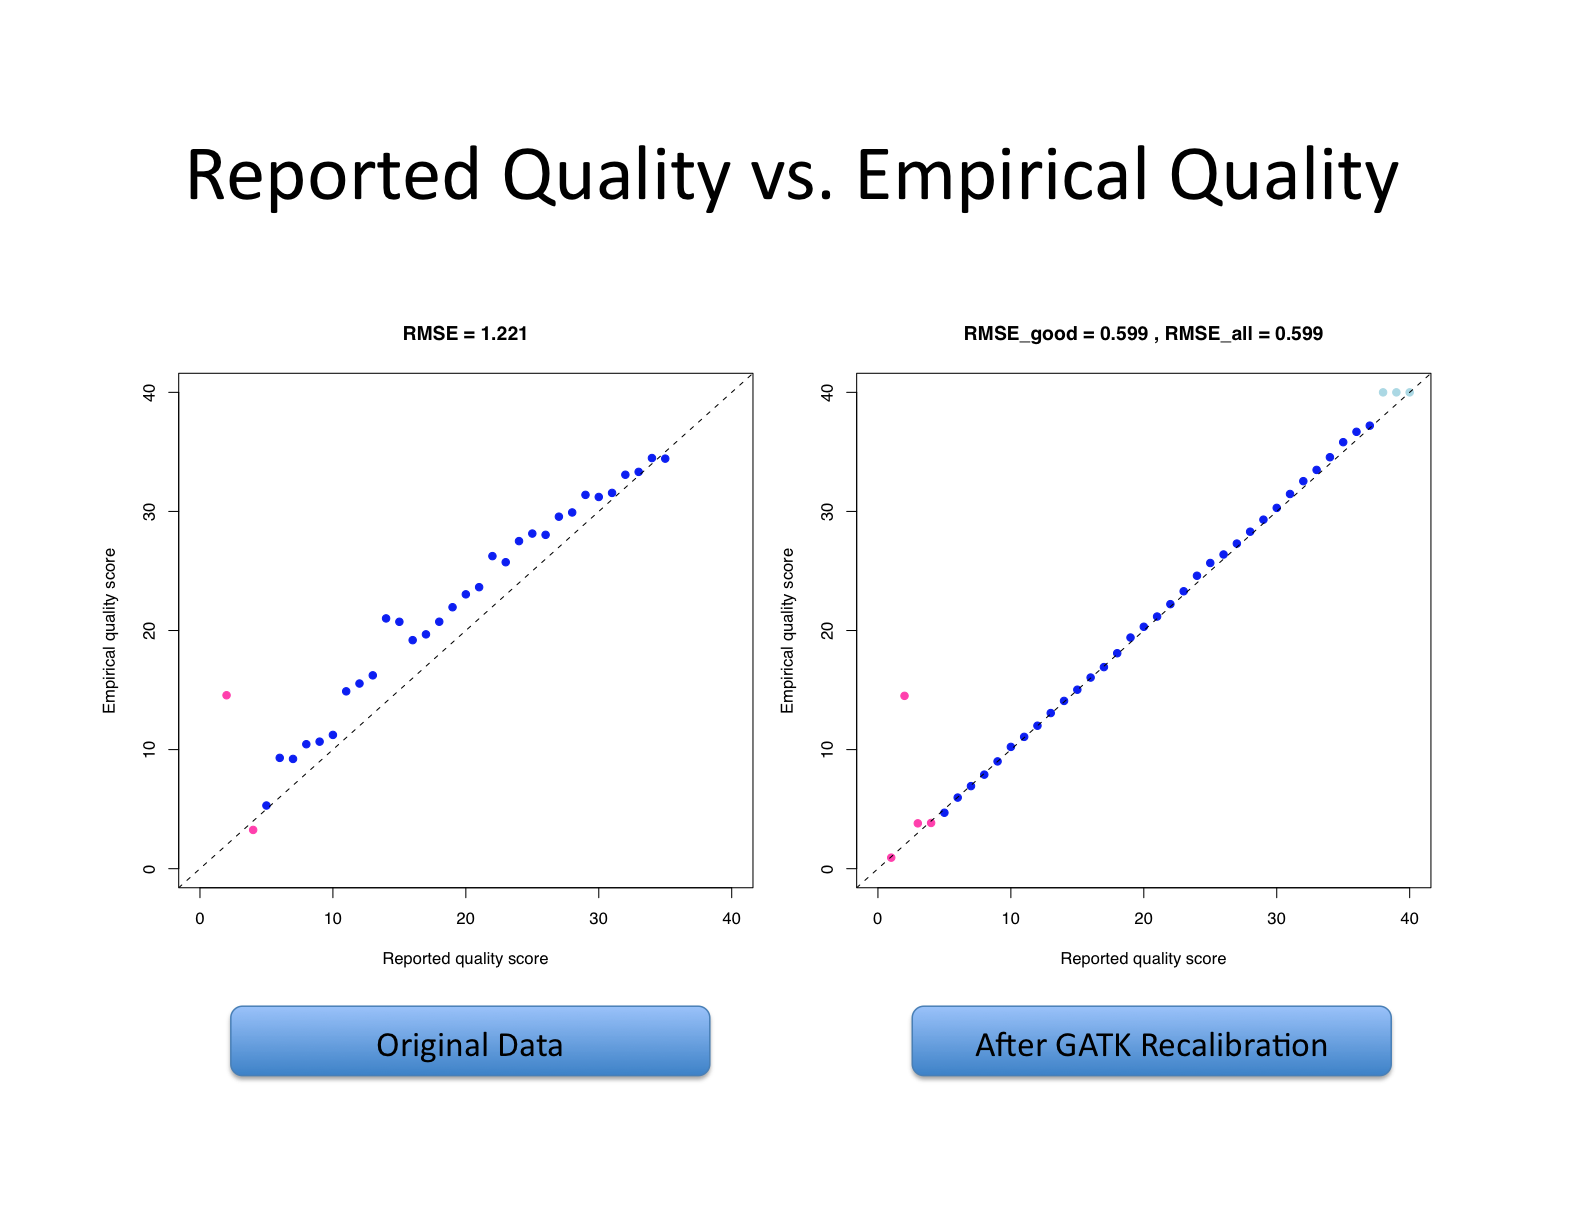
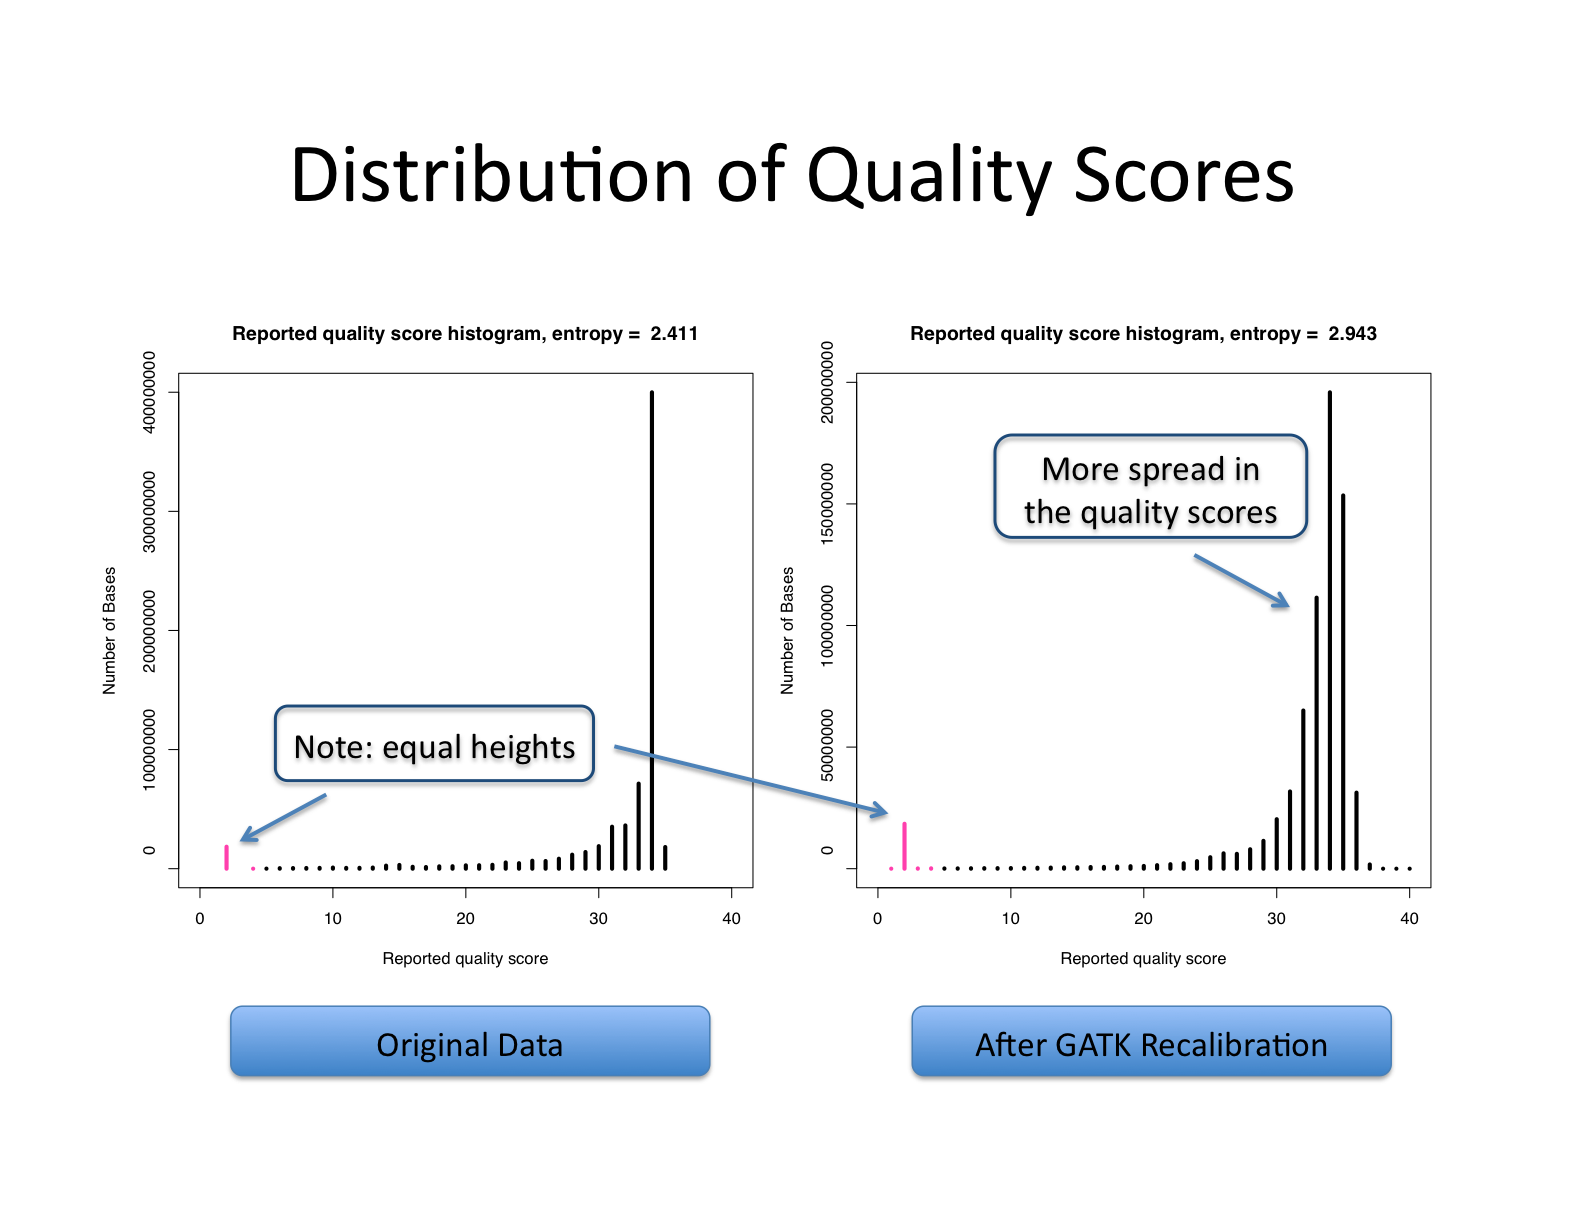
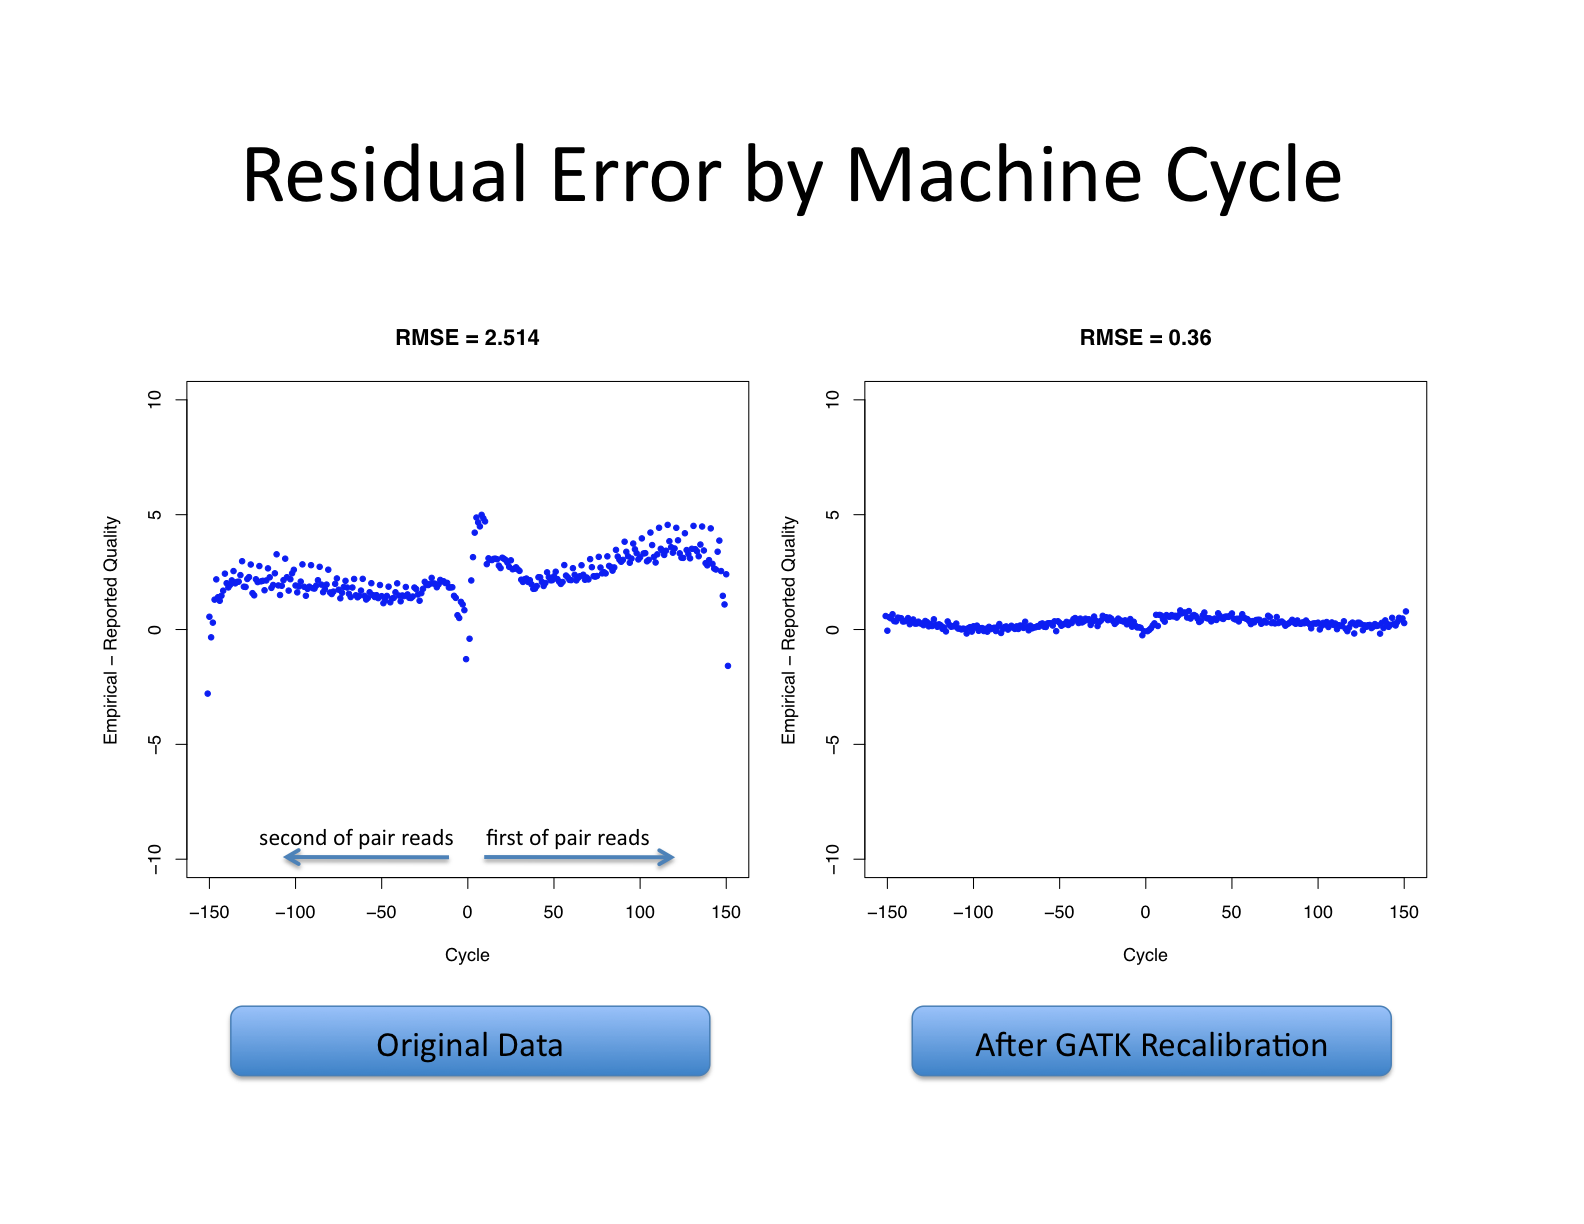
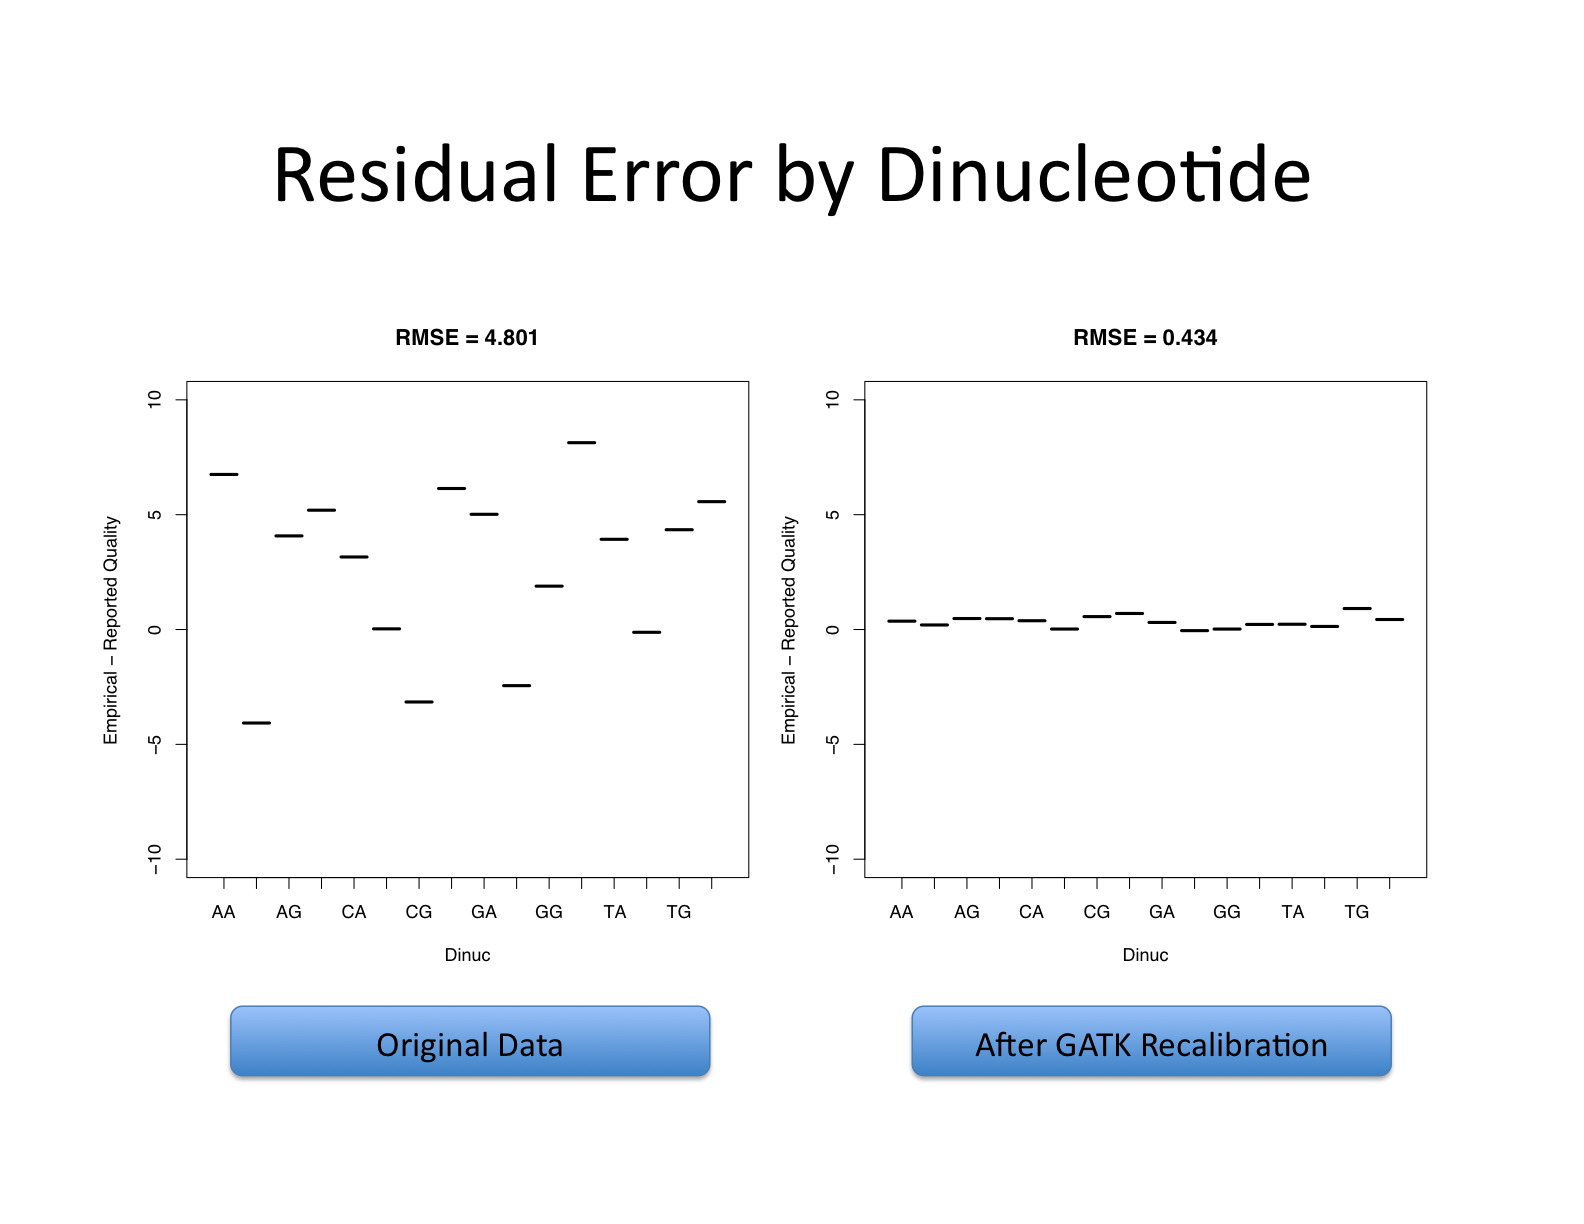
| This shows recalibration results from a lane sequenced at the Broad by an Illumina GA-II in February 2010. This is admittedly not very recent but the results are typical of what we still see on some more recent runs, even if the overall quality of sequencing has improved. You can see there is a significant improvement in the accuracy of the base quality scores after applying the recalibration procedure. Note that the plots shown below are not the same as the plots that are produced by the AnalyzeCovariates tool. | 这显示了2010年2月在Broad由Illumina GA-II测序的一个通道的重新校准结果。 诚然,这不是最近的,但其结果是我们在一些较新的运行中仍然看到的典型情况,即使测序的整体质量已经提高。 你可以看到,在应用重新校准程序后,碱基质量分数的准确性有了明显的改善。 注意,下面显示的图与AnalyzeCovariates工具产生的图不一样。 |
|---|---|
  |
|
| Note: The scale for number of bases in the two graphs are different. | 注意:两张图中碱基数的比例是不同的。 |
 |
|
 |
5. Recalibration report
| The recalibration report contains the following 5 tables: - Arguments Table — a table with all the arguments and its values - Quantization Table - ReadGroup Table - Quality Score Table - Covariates Table |
重新校准报告包含以下5个表。 - 参数表 - 包含所有参数及其数值的表格 - 量化表 - 读取组表 - 质量得分表 - 协变量表 |
|---|---|
Arguments Table
| This is the table that contains all the arguments used to run BQSR for this dataset. | 这张表包含了为这个数据集运行BQSR而使用的所有参数。 |
|---|---|
| ``` |
:GATKTable:true:1:17::;
:GATKTable:Arguments:Recalibration argument collection values used in this run
Argument Value covariate null default_platform null deletions_context_size 6 force_platform null insertions_context_size 6 …
| |<a name="nyWna"></a>## Quantization Table| The GATK offers native support to quantize base qualities. The GATK quantization procedure uses a statistical approach to determine the best binning system that minimizes the error introduced by amalgamating the different qualities present in the specific dataset. When running BQSR, a table with the base counts for each base quality is generated and a 'default' quantization table is generated. This table is a required parameter for any other tool in the GATK if you want to quantize your quality scores. | GATK提供了对基础质量量化的本地支持。<br />GATK的量化程序使用一种统计方法来确定最佳的分选系统,以最大限度地减少通过合并特定数据集中存在的不同质量而引入的误差。<br />当运行BQSR时,会生成一个包含每个基本质量的基本计数的表格,并生成一个 "默认 "量化表。如果你想量化你的质量分数,这个表是GATK中任何其他工具的一个必要参数。 || --- | --- || The default behavior (currently) is to use no quantization. You can override this by using the engine argument -qq. With -qq 0 you don't quantize qualities, or -qq N you recalculate the quantization bins using N bins. | 默认行为(目前)是不使用量化。你可以通过使用引擎参数-qq来重写这一点。<br />如果使用-qq 0,你就不对质量进行量化,如果使用-qq N,你就用N个bin来重新计算量化的bin。 ||
:GATKTable:true:2:94:::;
:GATKTable:Quantized:Quality quantization map
QualityScore Count QuantizedScore 0 252 0 1 15972 1 2 553525 2 3 2190142 9 4 5369681 9 9 83645762 9
| |<a name="wfEcS"></a>## ReadGroup Table| This table contains the empirical quality scores for each read group, for mismatches insertions and deletions. | 该表包含了每个读数组的经验质量分数,用于错配插入和删除。 || --- | --- ||
:GATKTable:false:6:18:%s:%s:%.4f:%.4f:%d:%d:;
:GATKTable:RecalTable0:
ReadGroup EventType EmpiricalQuality EstimatedQReported Observations Errors SRR032768 D 40.7476 45.0000 2642683174 222475 SRR032766 D 40.9072 45.0000 2630282426 213441 SRR032764 D 40.5931 45.0000 2919572148 254687 SRR032769 D 40.7448 45.0000 2850110574 240094 SRR032767 D 40.6820 45.0000 2820040026 241020 SRR032765 D 40.9034 45.0000 2441035052 198258 SRR032766 M 23.2573 23.7733 2630282426 12424434 SRR032768 M 23.0281 23.5366 2642683174 13159514 SRR032769 M 23.2608 23.6920 2850110574 13451898 SRR032764 M 23.2302 23.6039 2919572148 13877177 SRR032765 M 23.0271 23.5527 2441035052 12158144 SRR032767 M 23.1195 23.5852 2820040026 13750197 SRR032766 I 41.7198 45.0000 2630282426 177017 SRR032768 I 41.5682 45.0000 2642683174 184172 SRR032769 I 41.5828 45.0000 2850110574 197959 SRR032764 I 41.2958 45.0000 2919572148 216637 SRR032765 I 41.5546 45.0000 2441035052 170651 SRR032767 I 41.5192 45.0000 2820040026 198762
| |<a name="FoPTq"></a>## Quality Score Table| This table contains the empirical quality scores for each read group and original quality score, for mismatches insertions and deletions. | 该表包含每个读数组的经验质量分数和原始质量分数,对于错配插入和删除。 || --- | --- ||
:GATKTable:false:6:274:%s:%s:%s:%.4f:%d:%d:;
:GATKTable:RecalTable1:
ReadGroup QualityScore EventType EmpiricalQuality Observations Errors SRR032767 49 M 33.7794 9549 3 SRR032769 49 M 36.9975 5008 0 SRR032764 49 M 39.2490 8411 0 SRR032766 18 M 17.7397 16330200 274803 SRR032768 18 M 17.7922 17707920 294405 SRR032764 45 I 41.2958 2919572148 216637 SRR032765 6 M 6.0600 3401801 842765 SRR032769 45 I 41.5828 2850110574 197959 SRR032764 6 M 6.0751 4220451 1041946 SRR032767 45 I 41.5192 2820040026 198762 SRR032769 6 M 6.3481 5045533 1169748 SRR032768 16 M 15.7681 12427549 329283 SRR032766 16 M 15.8173 11799056 309110 SRR032764 16 M 15.9033 13017244 334343 SRR032769 16 M 15.8042 13817386 363078 …
| |<a name="dli7g"></a>## Covariates Table| This table has the empirical qualities for each covariate used in the dataset. The default covariates are cycle and context. In the current implementation, context is of a fixed size (default 6). Each context and each cycle will have an entry on this table stratified by read group and original quality score. | 该表有数据集中使用的每个协变量的经验质量。默认的协变量是周期和背景。在目前的实现中,上下文是一个固定的大小(默认为6)。每个上下文和每个周期在这个表中都有一个条目,按阅读组和原始质量分数进行分层。 || --- | --- ||
:GATKTable:false:8:1003738:%s:%s:%s:%s:%s:%.4f:%d:%d:;
:GATKTable:RecalTable2:
ReadGroup QualityScore CovariateValue CovariateName EventType EmpiricalQuality Observations Errors SRR032767 16 TACGGA Context M 14.2139 817 30 SRR032766 16 AACGGA Context M 14.9938 1420 44 SRR032765 16 TACGGA Context M 15.5145 711 19 SRR032768 16 AACGGA Context M 15.0133 1585 49 SRR032764 16 TACGGA Context M 14.5393 710 24 SRR032766 16 GACGGA Context M 17.9746 1379 21 SRR032768 45 CACCTC Context I 40.7907 575849 47 SRR032764 45 TACCTC Context I 43.8286 507088 20 SRR032769 45 TACGGC Context D 38.7536 37525 4 SRR032768 45 GACCTC Context I 46.0724 445275 10 SRR032766 45 CACCTC Context I 41.0696 575664 44 SRR032769 45 TACCTC Context I 43.4821 490491 21 SRR032766 45 CACGGC Context D 45.1471 65424 1 SRR032768 45 GACGGC Context D 45.3980 34657 0 SRR032767 45 TACGGC Context D 42.7663 37814 1 SRR032767 16 AACGGA Context M 15.9371 1647 41 SRR032764 16 GACGGA Context M 18.2642 1273 18 SRR032769 16 CACGGA Context M 13.0801 1442 70 SRR032765 16 GACGGA Context M 15.9934 1271 31 … ``` | |

若有收获,就点个赞吧
0 人点赞
