Plotting Functions: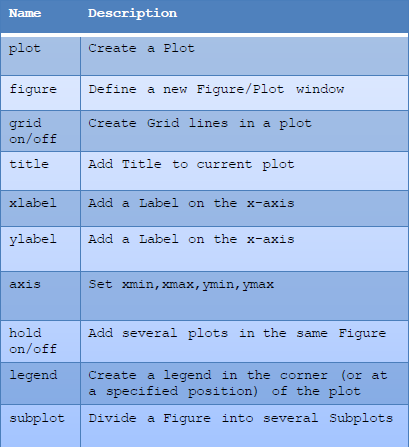
grid网格
title(‘…..’) xlabel ylabel
hold on将后面的波形画在前面面板上,hold off只显示最后绘制的波形。
subplot(行,列,第几个图呈现)
clearclcx = 0:0.1:2*pi;y = sin(x);y2 = cos(x);subplot(2,2,2)plot(x,y)subplot(2,2,1)plot(x,y2)

若有收获,就点个赞吧
0 人点赞
