一、基本设置
在工具箱中找到ChartControl—RunDesigner—Series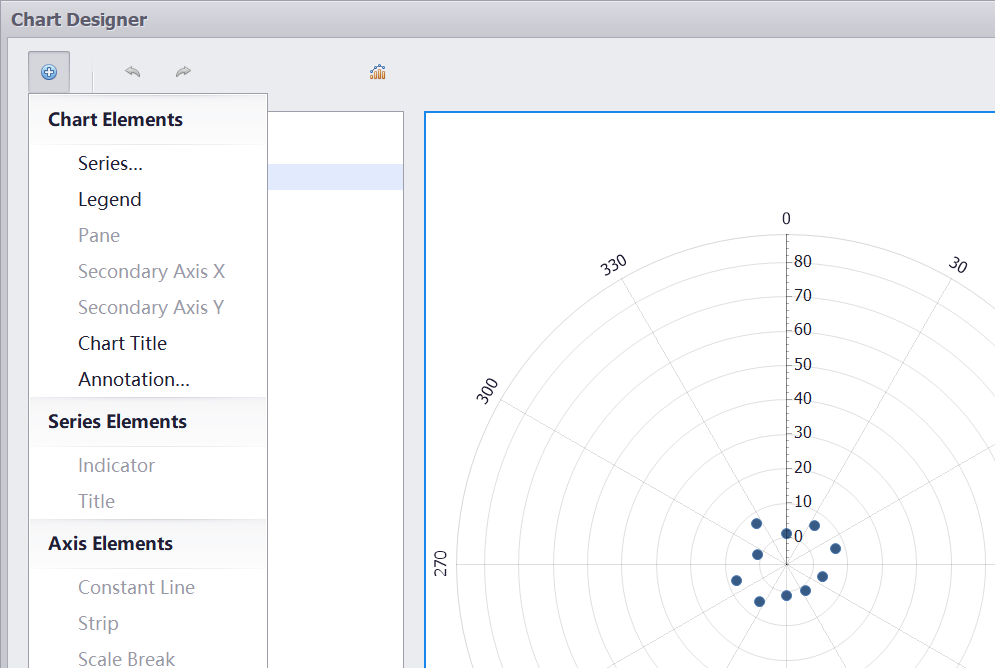
在Series窗体中找到Polar Point这一项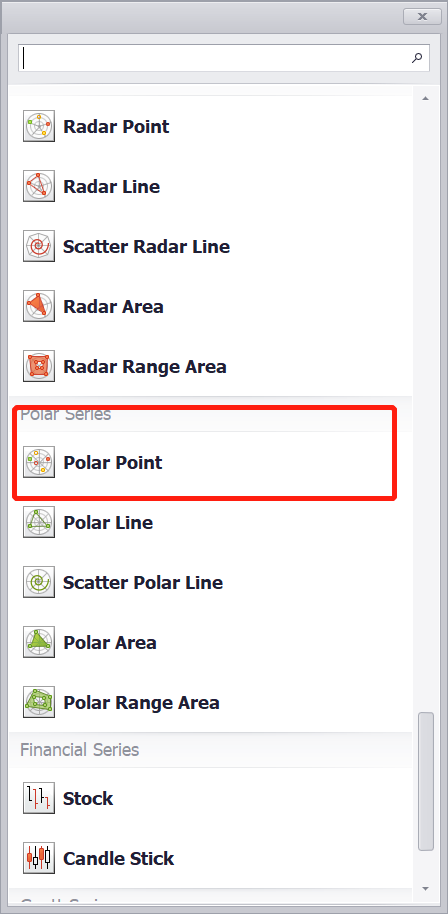
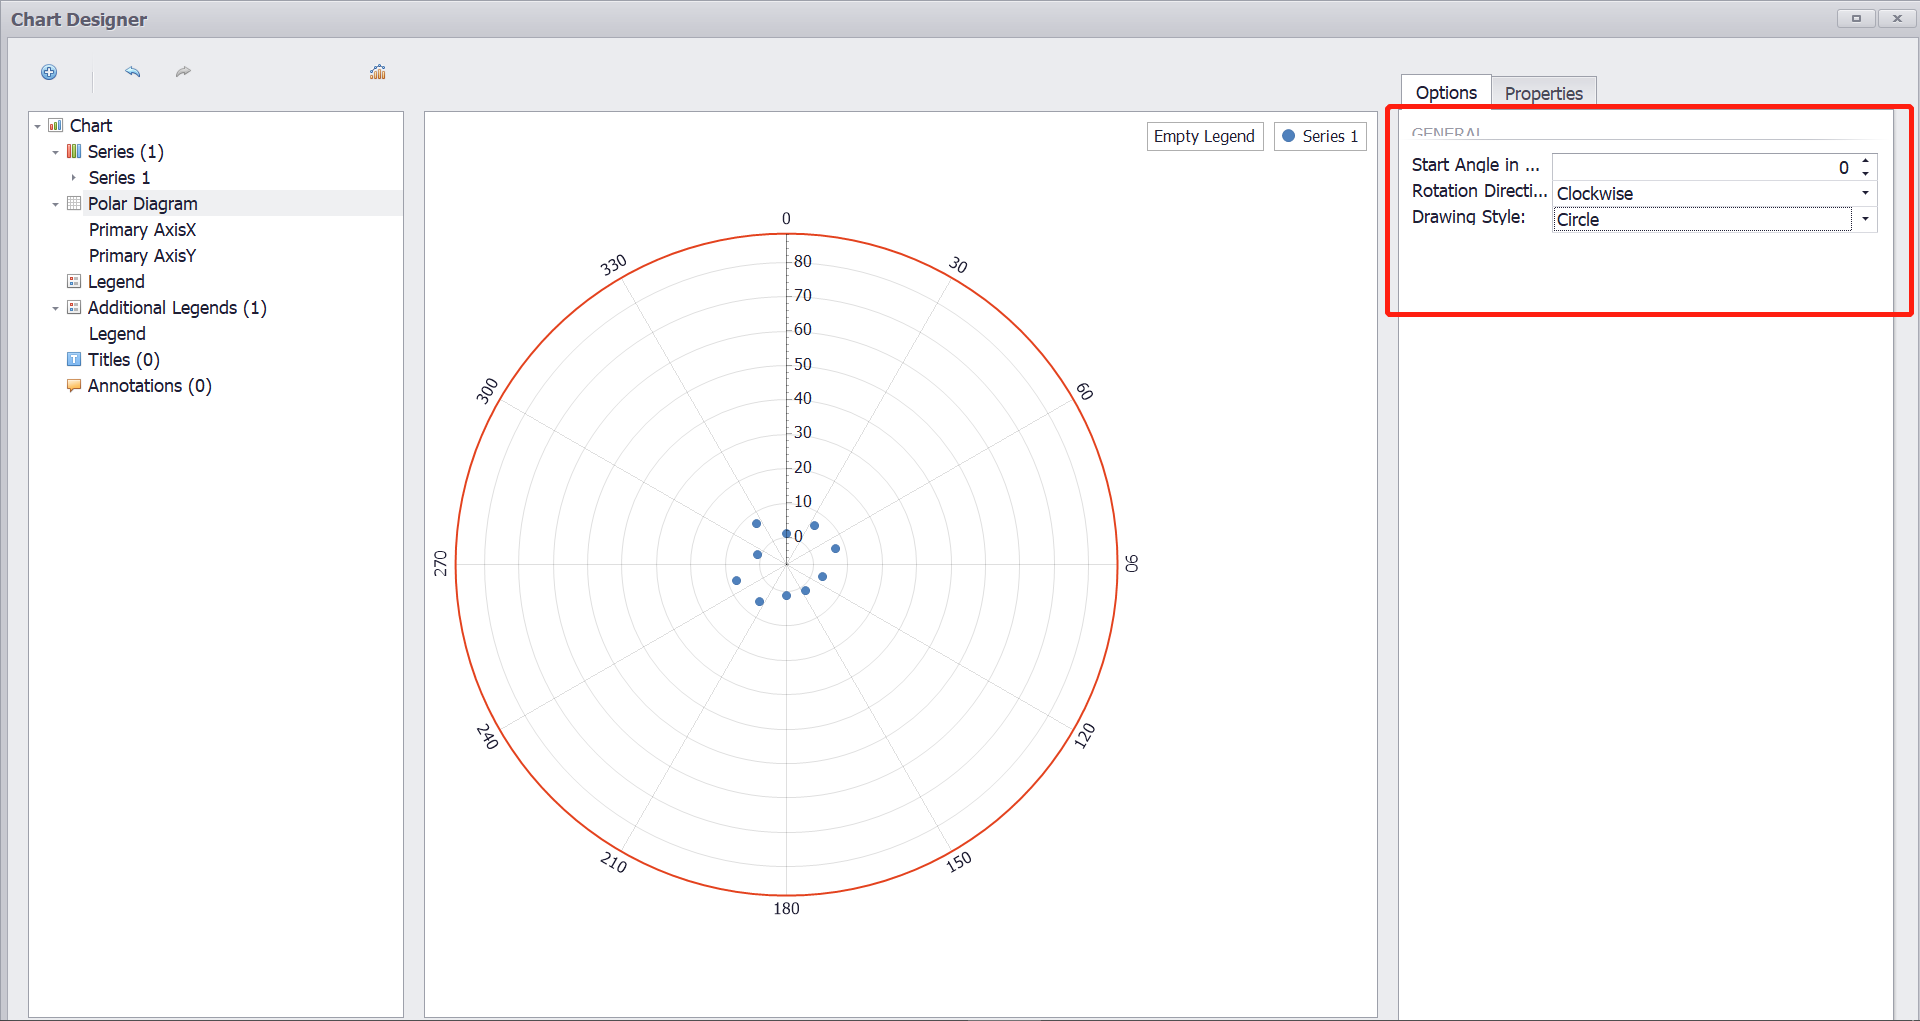
选择StartAngleInDegree为0度,旋转角度RotationDirection为顺时针,DrawingStyle为Circle
用代码设置则为
// Adjust the view-type specific properties of the series.PolarPointSeriesView myView = (PolarPointSeriesView)series.View;//图标样式//myView.PointMarkerOptions.Kind = MarkerKind.Star;//Set the Visual Range of AxisYmyView.PointMarkerOptions.Kind = MarkerKind.Circle;myView.PointMarkerOptions.StarPointCount = 5;myView.PointMarkerOptions.Size = 5;// Flip the diagram (if necessary).((PolarDiagram)chartControl1.Diagram).StartAngleInDegrees = 180;((PolarDiagram)chartControl1.Diagram).RotationDirection =RadarDiagramRotationDirection.Counterclockwise;//逆时针
还有一些其他的设置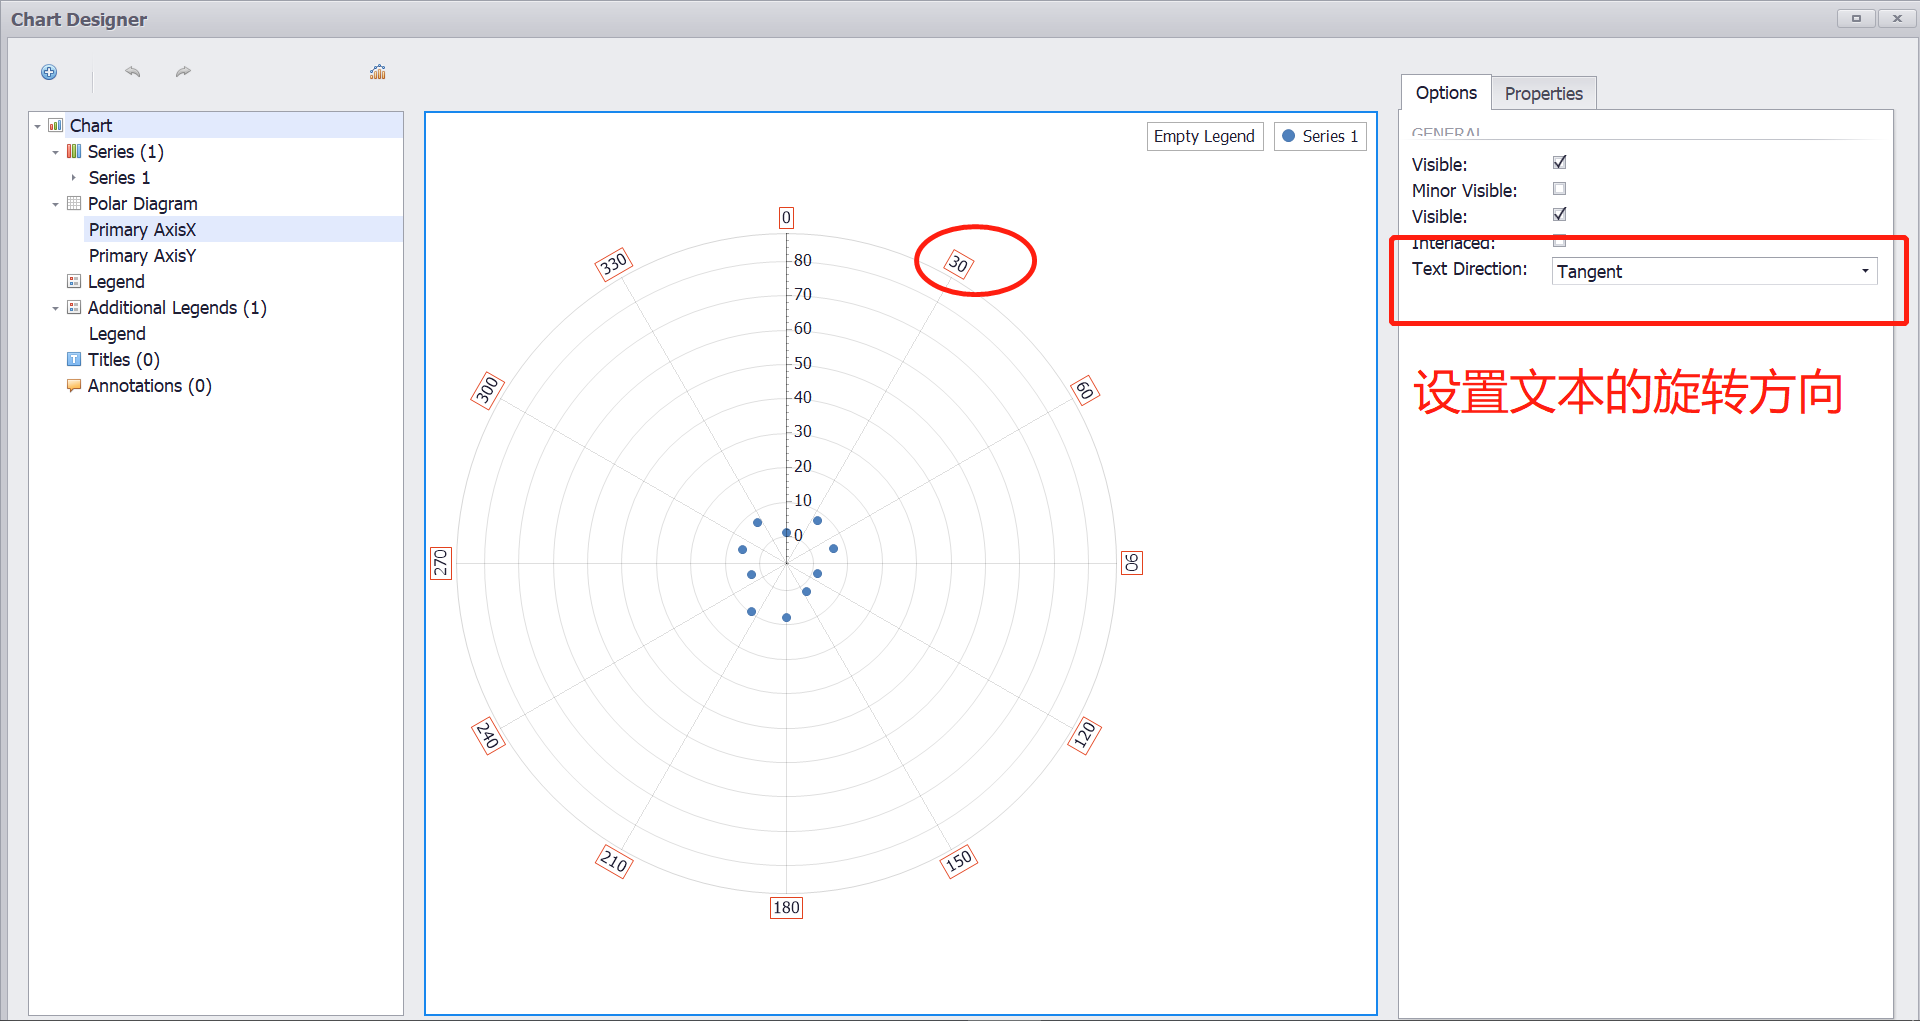
绑定数据源操作DataSources可以用我们自己定义的引用类型(如类)
这里我定义了一个卫星的类。并且设置了可视Y坐标轴的最大范围,因为Y坐标绑定的是卫星仰角(范围0-90度)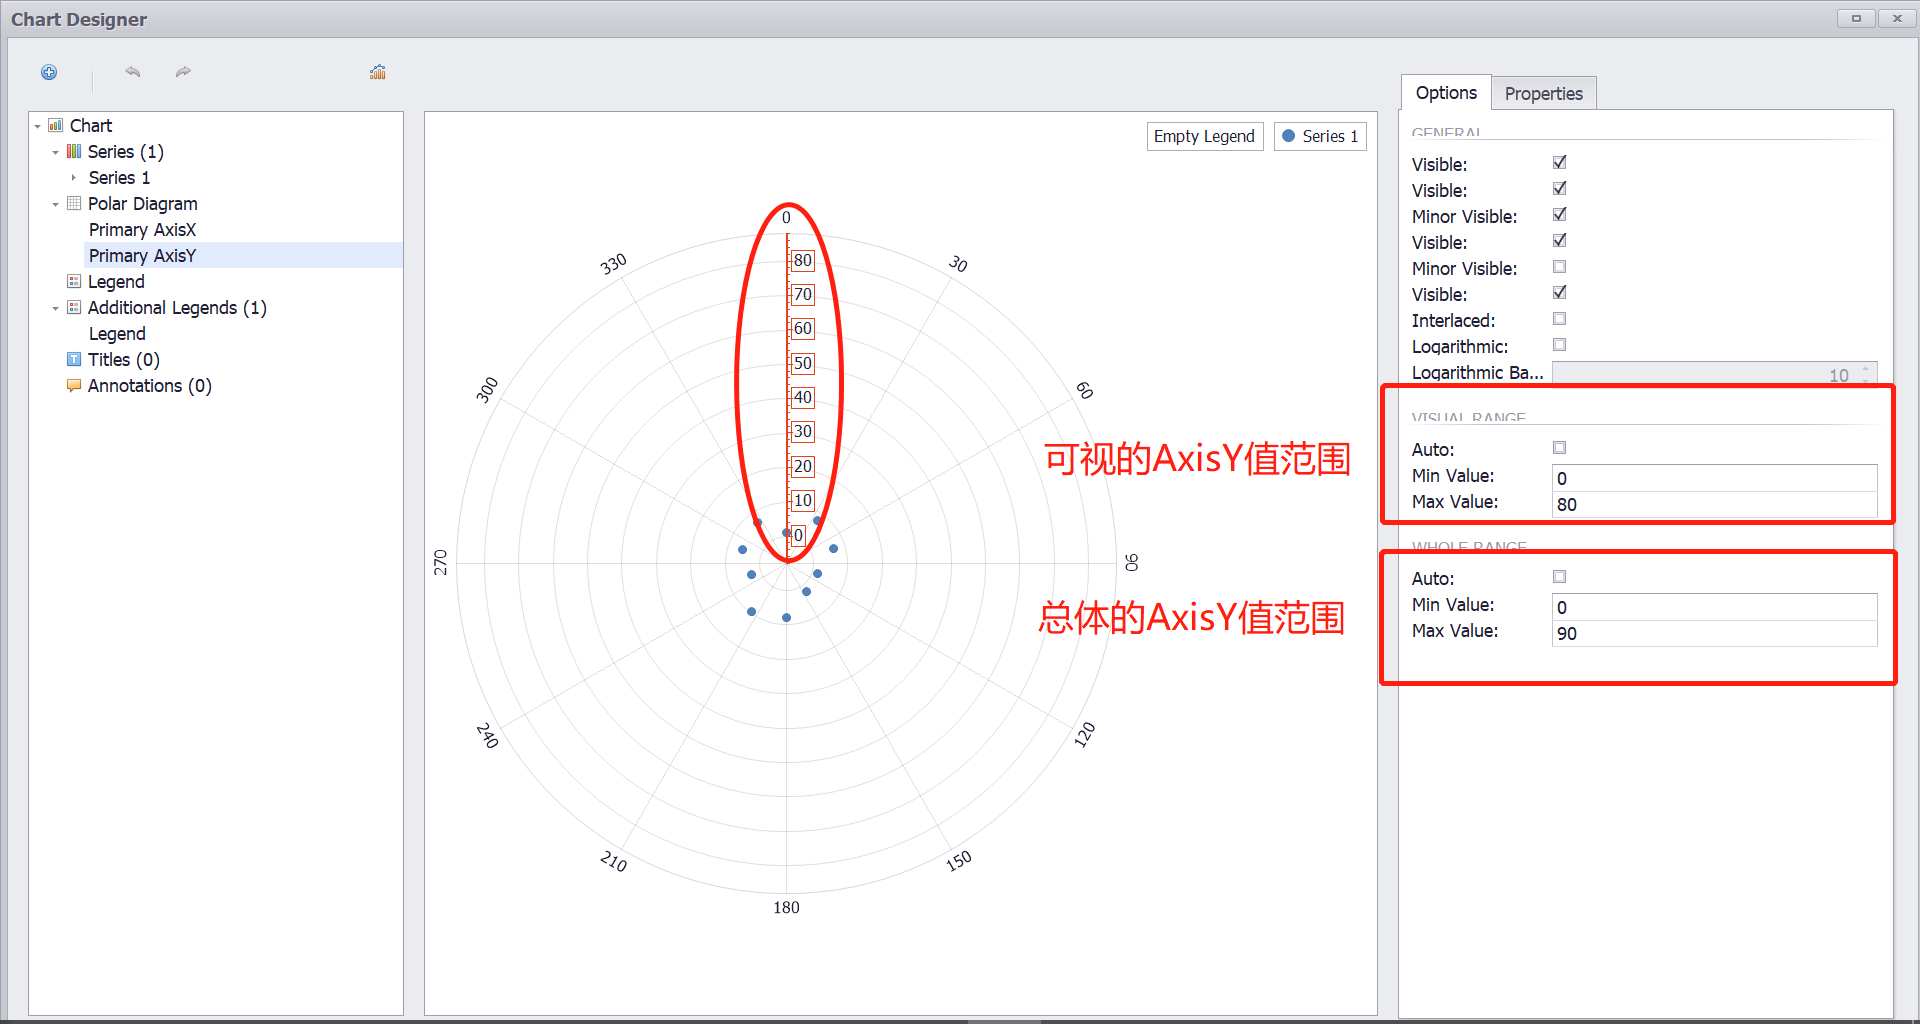
卫星的类为
public class Satellite{public int ID { get; set; }//PRN编号public string Country { get; set; }public string Name { get; set; }//Name=County+ID;public int Elevation { get; set; } //卫星仰角0-90public int Azimuth { get; set; } //卫星方位角0-360public TimeSpan BeginTime { get; set; }//开始时间public TimeSpan EndTime { get; set; }//结束时间public bool IsExist { get; set; }public int SNR { get; set; }public Color Color { get; set; } = Color.Blue;public Satellite(){}public Satellite(int Id,string country){this.ID = Id;this.Country = country;this.Name = country + Id.ToString();}public Satellite(int id, int elevation, int az){this.ID = id;this.Elevation = elevation;this.Azimuth = az;}public Satellite(int id,int elevation,int az,int snr){this.ID = id;this.Elevation = elevation;this.Azimuth = az;this.SNR = snr;}public void SetColor(string countryName){switch(countryName){case "GP":this.Color = Color.Blue;break;case "BD":this.Color = Color.Red;break;case "GL":this.Color = Color.Red;break;case "GN":this.Color = Color.Red;break;default:break;}}public bool IsValid(){bool flag = true;if (ID == 0 || Azimuth == 0||Elevation==0){flag = false;}return flag;}}
绑定的数据源需要设置参数和数据的名称
private void InitializeChartControl(){series = new Series("Series", ViewType.PolarPoint);// Add the series to the chart.chartControl1.Series.Add(series);//Specify data member to bind the series;series.ArgumentScaleType = ScaleType.Numerical;series.ArgumentDataMember = "Azimuth";// AxisX;series.ValueScaleType = ScaleType.Numerical;series.ValueDataMembers[0] = "Elevation";//AxisY上的参数名称series.ColorDataMember = "Color";//数据源的颜色参数名称// Adjust the view-type specific properties of the series.PolarPointSeriesView myView = (PolarPointSeriesView)series.View;//Set the Visual Range of AxisYmyView.PointMarkerOptions.Kind = MarkerKind.Circle;myView.PointMarkerOptions.StarPointCount = 5;myView.PointMarkerOptions.Size = 8;// Add a title to the chart, and hide the legend.chartControl1.Titles.Add(new ChartTitle());chartControl1.Titles[0].Text = "A Polar Point Chart";chartControl1.Legend.Visibility = DevExpress.Utils.DefaultBoolean.False;}
private List<Satellite> BindingSatellites(){List<Satellite> satellites = new List<Satellite>();satellites.Add(new Satellite(1, 0, 90, Color.Red));satellites.Add(new Satellite(2, 45, 270,Color.PeachPuff));satellites.Add(new Satellite(3, 35, 300,Color.Peru));return satellites;}
使用时用两个语句即可
在Form构造函数中写
InitializeChartControl3();
series.DataSource = BindingSatellites();

若有收获,就点个赞吧
0 人点赞
